Free Statistics

of Irreproducible Research!

Author's title

Author*Unverified author*
R Software Modulerwasp_autocorrelation.wasp
Title produced by software(Partial) Autocorrelation Function
Date of computationWed, 19 Oct 2016 12:28:08 +0100
Cite this page as followsStatistical Computations at FreeStatistics.org, Office for Research Development and Education, URL https://freestatistics.org/blog/index.php?v=date/2016/Oct/19/t1476876562s8srvcvlbkk9hzn.htm/, Retrieved Tue, 30 Apr 2024 09:55:32 +0200
Statistical Computations at FreeStatistics.org, Office for Research Development and Education, URL https://freestatistics.org/blog/index.php?pk=, Retrieved Tue, 30 Apr 2024 09:55:32 +0200
QR Codes:

Original text written by user:
IsPrivate?No (this computation is public)
User-defined keywords
Estimated Impact0
Dataseries X:
91.16
91.17
91.17
91.38
92.68
92.72
92.79
92.81
92.81
92.81
92.81
92.81
92.81
92.82
92.82
92.88
93.38
93.89
94.1
94.18
94.3
94.31
94.36
94.38
94.38
94.5
94.57
94.89
96.71
97.57
97.88
97.97
98.4
98.51
98.46
98.46
98.48
98.6
98.6
98.71
99.13
99.2
99.3
100.18
101.37
101.77
102.28
102.38
102.35
103.23
105.37
106.62
107
107.24
107.31
107.35
107.42
107.58
107.64
107.64
107.68
108.51
110.37
111.31
111.57
111.66
111.69
111.9
111.95
112.04
112.13
112.14


Summary of computational transaction
Raw Inputview raw input (R code)
Raw Outputview raw output of R engine
Computing time2 seconds
R Server'Sir Ronald Aylmer Fisher' @ fisher.wessa.net

\begin{tabular}{lllllllll}
\hline
Summary of computational transaction \tabularnewline
Raw Input & view raw input (R code)  \tabularnewline
Raw Output & view raw output of R engine  \tabularnewline
Computing time & 2 seconds \tabularnewline
R Server & 'Sir Ronald Aylmer Fisher' @ fisher.wessa.net \tabularnewline
\hline
\end{tabular}
%Source: https://freestatistics.org/blog/index.php?pk=&T=0

[TABLE]
[ROW][C]Summary of computational transaction[/C][/ROW]
[ROW][C]Raw Input[/C][C]view raw input (R code) [/C][/ROW]
[ROW][C]Raw Output[/C][C]view raw output of R engine [/C][/ROW]
[ROW][C]Computing time[/C][C]2 seconds[/C][/ROW]
[ROW][C]R Server[/C][C]'Sir Ronald Aylmer Fisher' @ fisher.wessa.net[/C][/ROW]
[/TABLE]
Source: https://freestatistics.org/blog/index.php?pk=&T=0

Globally Unique Identifier (entire table): ba.freestatistics.org/blog/index.php?pk=&T=0

As an alternative you can also use a QR Code:  

The GUIDs for individual cells are displayed in the table below:

Summary of computational transaction
Raw Inputview raw input (R code)
Raw Outputview raw output of R engine
Computing time2 seconds
R Server'Sir Ronald Aylmer Fisher' @ fisher.wessa.net


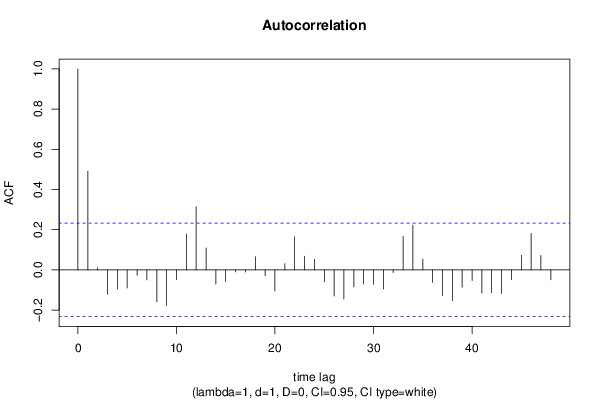
Autocorrelation Function
Time lag kACF(k)T-STATP-value
10.4906284.13414.8e-05
20.0107230.09040.464131
3-0.121066-1.02010.155568
4-0.094805-0.79880.213523
5-0.08997-0.75810.225449
6-0.026397-0.22240.412312
7-0.049564-0.41760.338738
8-0.158694-1.33720.092716
9-0.176824-1.48990.070334
10-0.048279-0.40680.342686
110.1787411.50610.068239
120.3140442.64620.005009
130.1094790.92250.1797
14-0.070222-0.59170.277964
15-0.058018-0.48890.31322
16-0.009934-0.08370.466762
17-0.010181-0.08580.465937
180.0653360.55050.291841
19-0.02921-0.24610.403146
20-0.105137-0.88590.189332
210.0309150.26050.397619
220.1657241.39640.08347
230.0678920.57210.28454
240.0522970.44070.330398
25-0.058737-0.49490.311091
26-0.130172-1.09680.138207
27-0.144992-1.22170.112926
28-0.085477-0.72020.23687
29-0.070366-0.59290.277561
30-0.071588-0.60320.274146
31-0.094826-0.7990.213472
32-0.012795-0.10780.457223
330.1659431.39830.083194
340.2227441.87690.032322
350.0530740.44720.328042
36-0.061902-0.52160.301787
37-0.127227-1.0720.143667
38-0.153754-1.29560.099663
39-0.086537-0.72920.234147
40-0.052462-0.44210.329897
41-0.115675-0.97470.166511
42-0.113403-0.95550.171271
43-0.117255-0.9880.163252
44-0.048331-0.40720.342527
450.0723230.60940.272102
460.1815661.52990.065242
470.071990.60660.273025
48-0.049465-0.41680.339042

\begin{tabular}{lllllllll}
\hline
Autocorrelation Function \tabularnewline
Time lag k & ACF(k) & T-STAT & P-value \tabularnewline
1 & 0.490628 & 4.1341 & 4.8e-05 \tabularnewline
2 & 0.010723 & 0.0904 & 0.464131 \tabularnewline
3 & -0.121066 & -1.0201 & 0.155568 \tabularnewline
4 & -0.094805 & -0.7988 & 0.213523 \tabularnewline
5 & -0.08997 & -0.7581 & 0.225449 \tabularnewline
6 & -0.026397 & -0.2224 & 0.412312 \tabularnewline
7 & -0.049564 & -0.4176 & 0.338738 \tabularnewline
8 & -0.158694 & -1.3372 & 0.092716 \tabularnewline
9 & -0.176824 & -1.4899 & 0.070334 \tabularnewline
10 & -0.048279 & -0.4068 & 0.342686 \tabularnewline
11 & 0.178741 & 1.5061 & 0.068239 \tabularnewline
12 & 0.314044 & 2.6462 & 0.005009 \tabularnewline
13 & 0.109479 & 0.9225 & 0.1797 \tabularnewline
14 & -0.070222 & -0.5917 & 0.277964 \tabularnewline
15 & -0.058018 & -0.4889 & 0.31322 \tabularnewline
16 & -0.009934 & -0.0837 & 0.466762 \tabularnewline
17 & -0.010181 & -0.0858 & 0.465937 \tabularnewline
18 & 0.065336 & 0.5505 & 0.291841 \tabularnewline
19 & -0.02921 & -0.2461 & 0.403146 \tabularnewline
20 & -0.105137 & -0.8859 & 0.189332 \tabularnewline
21 & 0.030915 & 0.2605 & 0.397619 \tabularnewline
22 & 0.165724 & 1.3964 & 0.08347 \tabularnewline
23 & 0.067892 & 0.5721 & 0.28454 \tabularnewline
24 & 0.052297 & 0.4407 & 0.330398 \tabularnewline
25 & -0.058737 & -0.4949 & 0.311091 \tabularnewline
26 & -0.130172 & -1.0968 & 0.138207 \tabularnewline
27 & -0.144992 & -1.2217 & 0.112926 \tabularnewline
28 & -0.085477 & -0.7202 & 0.23687 \tabularnewline
29 & -0.070366 & -0.5929 & 0.277561 \tabularnewline
30 & -0.071588 & -0.6032 & 0.274146 \tabularnewline
31 & -0.094826 & -0.799 & 0.213472 \tabularnewline
32 & -0.012795 & -0.1078 & 0.457223 \tabularnewline
33 & 0.165943 & 1.3983 & 0.083194 \tabularnewline
34 & 0.222744 & 1.8769 & 0.032322 \tabularnewline
35 & 0.053074 & 0.4472 & 0.328042 \tabularnewline
36 & -0.061902 & -0.5216 & 0.301787 \tabularnewline
37 & -0.127227 & -1.072 & 0.143667 \tabularnewline
38 & -0.153754 & -1.2956 & 0.099663 \tabularnewline
39 & -0.086537 & -0.7292 & 0.234147 \tabularnewline
40 & -0.052462 & -0.4421 & 0.329897 \tabularnewline
41 & -0.115675 & -0.9747 & 0.166511 \tabularnewline
42 & -0.113403 & -0.9555 & 0.171271 \tabularnewline
43 & -0.117255 & -0.988 & 0.163252 \tabularnewline
44 & -0.048331 & -0.4072 & 0.342527 \tabularnewline
45 & 0.072323 & 0.6094 & 0.272102 \tabularnewline
46 & 0.181566 & 1.5299 & 0.065242 \tabularnewline
47 & 0.07199 & 0.6066 & 0.273025 \tabularnewline
48 & -0.049465 & -0.4168 & 0.339042 \tabularnewline
\hline
\end{tabular}
%Source: https://freestatistics.org/blog/index.php?pk=&T=1

[TABLE]
[ROW][C]Autocorrelation Function[/C][/ROW]
[ROW][C]Time lag k[/C][C]ACF(k)[/C][C]T-STAT[/C][C]P-value[/C][/ROW]
[ROW][C]1[/C][C]0.490628[/C][C]4.1341[/C][C]4.8e-05[/C][/ROW]
[ROW][C]2[/C][C]0.010723[/C][C]0.0904[/C][C]0.464131[/C][/ROW]
[ROW][C]3[/C][C]-0.121066[/C][C]-1.0201[/C][C]0.155568[/C][/ROW]
[ROW][C]4[/C][C]-0.094805[/C][C]-0.7988[/C][C]0.213523[/C][/ROW]
[ROW][C]5[/C][C]-0.08997[/C][C]-0.7581[/C][C]0.225449[/C][/ROW]
[ROW][C]6[/C][C]-0.026397[/C][C]-0.2224[/C][C]0.412312[/C][/ROW]
[ROW][C]7[/C][C]-0.049564[/C][C]-0.4176[/C][C]0.338738[/C][/ROW]
[ROW][C]8[/C][C]-0.158694[/C][C]-1.3372[/C][C]0.092716[/C][/ROW]
[ROW][C]9[/C][C]-0.176824[/C][C]-1.4899[/C][C]0.070334[/C][/ROW]
[ROW][C]10[/C][C]-0.048279[/C][C]-0.4068[/C][C]0.342686[/C][/ROW]
[ROW][C]11[/C][C]0.178741[/C][C]1.5061[/C][C]0.068239[/C][/ROW]
[ROW][C]12[/C][C]0.314044[/C][C]2.6462[/C][C]0.005009[/C][/ROW]
[ROW][C]13[/C][C]0.109479[/C][C]0.9225[/C][C]0.1797[/C][/ROW]
[ROW][C]14[/C][C]-0.070222[/C][C]-0.5917[/C][C]0.277964[/C][/ROW]
[ROW][C]15[/C][C]-0.058018[/C][C]-0.4889[/C][C]0.31322[/C][/ROW]
[ROW][C]16[/C][C]-0.009934[/C][C]-0.0837[/C][C]0.466762[/C][/ROW]
[ROW][C]17[/C][C]-0.010181[/C][C]-0.0858[/C][C]0.465937[/C][/ROW]
[ROW][C]18[/C][C]0.065336[/C][C]0.5505[/C][C]0.291841[/C][/ROW]
[ROW][C]19[/C][C]-0.02921[/C][C]-0.2461[/C][C]0.403146[/C][/ROW]
[ROW][C]20[/C][C]-0.105137[/C][C]-0.8859[/C][C]0.189332[/C][/ROW]
[ROW][C]21[/C][C]0.030915[/C][C]0.2605[/C][C]0.397619[/C][/ROW]
[ROW][C]22[/C][C]0.165724[/C][C]1.3964[/C][C]0.08347[/C][/ROW]
[ROW][C]23[/C][C]0.067892[/C][C]0.5721[/C][C]0.28454[/C][/ROW]
[ROW][C]24[/C][C]0.052297[/C][C]0.4407[/C][C]0.330398[/C][/ROW]
[ROW][C]25[/C][C]-0.058737[/C][C]-0.4949[/C][C]0.311091[/C][/ROW]
[ROW][C]26[/C][C]-0.130172[/C][C]-1.0968[/C][C]0.138207[/C][/ROW]
[ROW][C]27[/C][C]-0.144992[/C][C]-1.2217[/C][C]0.112926[/C][/ROW]
[ROW][C]28[/C][C]-0.085477[/C][C]-0.7202[/C][C]0.23687[/C][/ROW]
[ROW][C]29[/C][C]-0.070366[/C][C]-0.5929[/C][C]0.277561[/C][/ROW]
[ROW][C]30[/C][C]-0.071588[/C][C]-0.6032[/C][C]0.274146[/C][/ROW]
[ROW][C]31[/C][C]-0.094826[/C][C]-0.799[/C][C]0.213472[/C][/ROW]
[ROW][C]32[/C][C]-0.012795[/C][C]-0.1078[/C][C]0.457223[/C][/ROW]
[ROW][C]33[/C][C]0.165943[/C][C]1.3983[/C][C]0.083194[/C][/ROW]
[ROW][C]34[/C][C]0.222744[/C][C]1.8769[/C][C]0.032322[/C][/ROW]
[ROW][C]35[/C][C]0.053074[/C][C]0.4472[/C][C]0.328042[/C][/ROW]
[ROW][C]36[/C][C]-0.061902[/C][C]-0.5216[/C][C]0.301787[/C][/ROW]
[ROW][C]37[/C][C]-0.127227[/C][C]-1.072[/C][C]0.143667[/C][/ROW]
[ROW][C]38[/C][C]-0.153754[/C][C]-1.2956[/C][C]0.099663[/C][/ROW]
[ROW][C]39[/C][C]-0.086537[/C][C]-0.7292[/C][C]0.234147[/C][/ROW]
[ROW][C]40[/C][C]-0.052462[/C][C]-0.4421[/C][C]0.329897[/C][/ROW]
[ROW][C]41[/C][C]-0.115675[/C][C]-0.9747[/C][C]0.166511[/C][/ROW]
[ROW][C]42[/C][C]-0.113403[/C][C]-0.9555[/C][C]0.171271[/C][/ROW]
[ROW][C]43[/C][C]-0.117255[/C][C]-0.988[/C][C]0.163252[/C][/ROW]
[ROW][C]44[/C][C]-0.048331[/C][C]-0.4072[/C][C]0.342527[/C][/ROW]
[ROW][C]45[/C][C]0.072323[/C][C]0.6094[/C][C]0.272102[/C][/ROW]
[ROW][C]46[/C][C]0.181566[/C][C]1.5299[/C][C]0.065242[/C][/ROW]
[ROW][C]47[/C][C]0.07199[/C][C]0.6066[/C][C]0.273025[/C][/ROW]
[ROW][C]48[/C][C]-0.049465[/C][C]-0.4168[/C][C]0.339042[/C][/ROW]
[/TABLE]
Source: https://freestatistics.org/blog/index.php?pk=&T=1

Globally Unique Identifier (entire table): ba.freestatistics.org/blog/index.php?pk=&T=1

As an alternative you can also use a QR Code:  

The GUIDs for individual cells are displayed in the table below:

Autocorrelation Function
Time lag kACF(k)T-STATP-value
10.4906284.13414.8e-05
20.0107230.09040.464131
3-0.121066-1.02010.155568
4-0.094805-0.79880.213523
5-0.08997-0.75810.225449
6-0.026397-0.22240.412312
7-0.049564-0.41760.338738
8-0.158694-1.33720.092716
9-0.176824-1.48990.070334
10-0.048279-0.40680.342686
110.1787411.50610.068239
120.3140442.64620.005009
130.1094790.92250.1797
14-0.070222-0.59170.277964
15-0.058018-0.48890.31322
16-0.009934-0.08370.466762
17-0.010181-0.08580.465937
180.0653360.55050.291841
19-0.02921-0.24610.403146
20-0.105137-0.88590.189332
210.0309150.26050.397619
220.1657241.39640.08347
230.0678920.57210.28454
240.0522970.44070.330398
25-0.058737-0.49490.311091
26-0.130172-1.09680.138207
27-0.144992-1.22170.112926
28-0.085477-0.72020.23687
29-0.070366-0.59290.277561
30-0.071588-0.60320.274146
31-0.094826-0.7990.213472
32-0.012795-0.10780.457223
330.1659431.39830.083194
340.2227441.87690.032322
350.0530740.44720.328042
36-0.061902-0.52160.301787
37-0.127227-1.0720.143667
38-0.153754-1.29560.099663
39-0.086537-0.72920.234147
40-0.052462-0.44210.329897
41-0.115675-0.97470.166511
42-0.113403-0.95550.171271
43-0.117255-0.9880.163252
44-0.048331-0.40720.342527
450.0723230.60940.272102
460.1815661.52990.065242
470.071990.60660.273025
48-0.049465-0.41680.339042


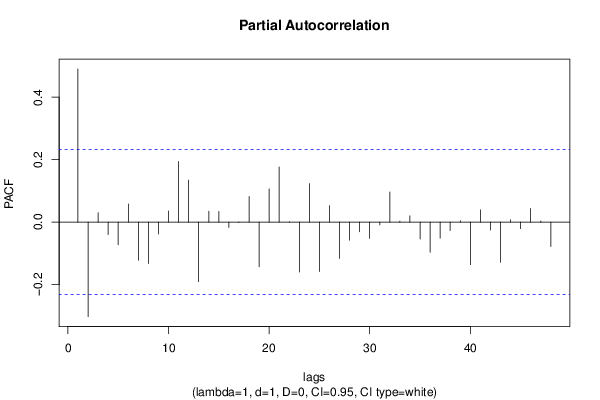
Partial Autocorrelation Function
Time lag kPACF(k)T-STATP-value
10.4906284.13414.8e-05
2-0.302907-2.55230.006426
30.0300090.25290.400555
4-0.040035-0.33730.368429
5-0.072547-0.61130.27148
60.0581030.48960.312969
7-0.122451-1.03180.152835
8-0.132514-1.11660.133969
9-0.038032-0.32050.37478
100.0358360.3020.381783
110.1941411.63590.053148
120.1345021.13330.130443
13-0.190766-1.60740.0562
140.034970.29470.384555
150.03420.28820.387027
16-0.017012-0.14330.443212
17-0.001203-0.01010.495971
180.0820010.6910.245923
19-0.143334-1.20780.115574
200.1063660.89630.186574
210.1763021.48550.070913
220.0009970.00840.49666
23-0.159684-1.34550.091369
240.1232291.03830.151316
25-0.15808-1.3320.093559
260.0527350.44440.329068
27-0.116621-0.98270.164555
28-0.057853-0.48750.313712
29-0.03068-0.25850.398379
30-0.052136-0.43930.330888
31-0.008888-0.07490.470257
320.0967240.8150.208896
330.0030870.0260.489661
340.0199930.16850.433347
35-0.054186-0.45660.324684
36-0.096745-0.81520.208845
37-0.051369-0.43280.333219
38-0.026782-0.22570.411054
390.0045160.03810.484876
40-0.136327-1.14870.127265
410.0391730.33010.371158
42-0.025361-0.21370.415697
43-0.129136-1.08810.140111
440.0075460.06360.474742
45-0.020955-0.17660.430174
460.0438110.36920.356555
470.0036770.0310.487685
48-0.078451-0.6610.255363

\begin{tabular}{lllllllll}
\hline
Partial Autocorrelation Function \tabularnewline
Time lag k & PACF(k) & T-STAT & P-value \tabularnewline
1 & 0.490628 & 4.1341 & 4.8e-05 \tabularnewline
2 & -0.302907 & -2.5523 & 0.006426 \tabularnewline
3 & 0.030009 & 0.2529 & 0.400555 \tabularnewline
4 & -0.040035 & -0.3373 & 0.368429 \tabularnewline
5 & -0.072547 & -0.6113 & 0.27148 \tabularnewline
6 & 0.058103 & 0.4896 & 0.312969 \tabularnewline
7 & -0.122451 & -1.0318 & 0.152835 \tabularnewline
8 & -0.132514 & -1.1166 & 0.133969 \tabularnewline
9 & -0.038032 & -0.3205 & 0.37478 \tabularnewline
10 & 0.035836 & 0.302 & 0.381783 \tabularnewline
11 & 0.194141 & 1.6359 & 0.053148 \tabularnewline
12 & 0.134502 & 1.1333 & 0.130443 \tabularnewline
13 & -0.190766 & -1.6074 & 0.0562 \tabularnewline
14 & 0.03497 & 0.2947 & 0.384555 \tabularnewline
15 & 0.0342 & 0.2882 & 0.387027 \tabularnewline
16 & -0.017012 & -0.1433 & 0.443212 \tabularnewline
17 & -0.001203 & -0.0101 & 0.495971 \tabularnewline
18 & 0.082001 & 0.691 & 0.245923 \tabularnewline
19 & -0.143334 & -1.2078 & 0.115574 \tabularnewline
20 & 0.106366 & 0.8963 & 0.186574 \tabularnewline
21 & 0.176302 & 1.4855 & 0.070913 \tabularnewline
22 & 0.000997 & 0.0084 & 0.49666 \tabularnewline
23 & -0.159684 & -1.3455 & 0.091369 \tabularnewline
24 & 0.123229 & 1.0383 & 0.151316 \tabularnewline
25 & -0.15808 & -1.332 & 0.093559 \tabularnewline
26 & 0.052735 & 0.4444 & 0.329068 \tabularnewline
27 & -0.116621 & -0.9827 & 0.164555 \tabularnewline
28 & -0.057853 & -0.4875 & 0.313712 \tabularnewline
29 & -0.03068 & -0.2585 & 0.398379 \tabularnewline
30 & -0.052136 & -0.4393 & 0.330888 \tabularnewline
31 & -0.008888 & -0.0749 & 0.470257 \tabularnewline
32 & 0.096724 & 0.815 & 0.208896 \tabularnewline
33 & 0.003087 & 0.026 & 0.489661 \tabularnewline
34 & 0.019993 & 0.1685 & 0.433347 \tabularnewline
35 & -0.054186 & -0.4566 & 0.324684 \tabularnewline
36 & -0.096745 & -0.8152 & 0.208845 \tabularnewline
37 & -0.051369 & -0.4328 & 0.333219 \tabularnewline
38 & -0.026782 & -0.2257 & 0.411054 \tabularnewline
39 & 0.004516 & 0.0381 & 0.484876 \tabularnewline
40 & -0.136327 & -1.1487 & 0.127265 \tabularnewline
41 & 0.039173 & 0.3301 & 0.371158 \tabularnewline
42 & -0.025361 & -0.2137 & 0.415697 \tabularnewline
43 & -0.129136 & -1.0881 & 0.140111 \tabularnewline
44 & 0.007546 & 0.0636 & 0.474742 \tabularnewline
45 & -0.020955 & -0.1766 & 0.430174 \tabularnewline
46 & 0.043811 & 0.3692 & 0.356555 \tabularnewline
47 & 0.003677 & 0.031 & 0.487685 \tabularnewline
48 & -0.078451 & -0.661 & 0.255363 \tabularnewline
\hline
\end{tabular}
%Source: https://freestatistics.org/blog/index.php?pk=&T=2

[TABLE]
[ROW][C]Partial Autocorrelation Function[/C][/ROW]
[ROW][C]Time lag k[/C][C]PACF(k)[/C][C]T-STAT[/C][C]P-value[/C][/ROW]
[ROW][C]1[/C][C]0.490628[/C][C]4.1341[/C][C]4.8e-05[/C][/ROW]
[ROW][C]2[/C][C]-0.302907[/C][C]-2.5523[/C][C]0.006426[/C][/ROW]
[ROW][C]3[/C][C]0.030009[/C][C]0.2529[/C][C]0.400555[/C][/ROW]
[ROW][C]4[/C][C]-0.040035[/C][C]-0.3373[/C][C]0.368429[/C][/ROW]
[ROW][C]5[/C][C]-0.072547[/C][C]-0.6113[/C][C]0.27148[/C][/ROW]
[ROW][C]6[/C][C]0.058103[/C][C]0.4896[/C][C]0.312969[/C][/ROW]
[ROW][C]7[/C][C]-0.122451[/C][C]-1.0318[/C][C]0.152835[/C][/ROW]
[ROW][C]8[/C][C]-0.132514[/C][C]-1.1166[/C][C]0.133969[/C][/ROW]
[ROW][C]9[/C][C]-0.038032[/C][C]-0.3205[/C][C]0.37478[/C][/ROW]
[ROW][C]10[/C][C]0.035836[/C][C]0.302[/C][C]0.381783[/C][/ROW]
[ROW][C]11[/C][C]0.194141[/C][C]1.6359[/C][C]0.053148[/C][/ROW]
[ROW][C]12[/C][C]0.134502[/C][C]1.1333[/C][C]0.130443[/C][/ROW]
[ROW][C]13[/C][C]-0.190766[/C][C]-1.6074[/C][C]0.0562[/C][/ROW]
[ROW][C]14[/C][C]0.03497[/C][C]0.2947[/C][C]0.384555[/C][/ROW]
[ROW][C]15[/C][C]0.0342[/C][C]0.2882[/C][C]0.387027[/C][/ROW]
[ROW][C]16[/C][C]-0.017012[/C][C]-0.1433[/C][C]0.443212[/C][/ROW]
[ROW][C]17[/C][C]-0.001203[/C][C]-0.0101[/C][C]0.495971[/C][/ROW]
[ROW][C]18[/C][C]0.082001[/C][C]0.691[/C][C]0.245923[/C][/ROW]
[ROW][C]19[/C][C]-0.143334[/C][C]-1.2078[/C][C]0.115574[/C][/ROW]
[ROW][C]20[/C][C]0.106366[/C][C]0.8963[/C][C]0.186574[/C][/ROW]
[ROW][C]21[/C][C]0.176302[/C][C]1.4855[/C][C]0.070913[/C][/ROW]
[ROW][C]22[/C][C]0.000997[/C][C]0.0084[/C][C]0.49666[/C][/ROW]
[ROW][C]23[/C][C]-0.159684[/C][C]-1.3455[/C][C]0.091369[/C][/ROW]
[ROW][C]24[/C][C]0.123229[/C][C]1.0383[/C][C]0.151316[/C][/ROW]
[ROW][C]25[/C][C]-0.15808[/C][C]-1.332[/C][C]0.093559[/C][/ROW]
[ROW][C]26[/C][C]0.052735[/C][C]0.4444[/C][C]0.329068[/C][/ROW]
[ROW][C]27[/C][C]-0.116621[/C][C]-0.9827[/C][C]0.164555[/C][/ROW]
[ROW][C]28[/C][C]-0.057853[/C][C]-0.4875[/C][C]0.313712[/C][/ROW]
[ROW][C]29[/C][C]-0.03068[/C][C]-0.2585[/C][C]0.398379[/C][/ROW]
[ROW][C]30[/C][C]-0.052136[/C][C]-0.4393[/C][C]0.330888[/C][/ROW]
[ROW][C]31[/C][C]-0.008888[/C][C]-0.0749[/C][C]0.470257[/C][/ROW]
[ROW][C]32[/C][C]0.096724[/C][C]0.815[/C][C]0.208896[/C][/ROW]
[ROW][C]33[/C][C]0.003087[/C][C]0.026[/C][C]0.489661[/C][/ROW]
[ROW][C]34[/C][C]0.019993[/C][C]0.1685[/C][C]0.433347[/C][/ROW]
[ROW][C]35[/C][C]-0.054186[/C][C]-0.4566[/C][C]0.324684[/C][/ROW]
[ROW][C]36[/C][C]-0.096745[/C][C]-0.8152[/C][C]0.208845[/C][/ROW]
[ROW][C]37[/C][C]-0.051369[/C][C]-0.4328[/C][C]0.333219[/C][/ROW]
[ROW][C]38[/C][C]-0.026782[/C][C]-0.2257[/C][C]0.411054[/C][/ROW]
[ROW][C]39[/C][C]0.004516[/C][C]0.0381[/C][C]0.484876[/C][/ROW]
[ROW][C]40[/C][C]-0.136327[/C][C]-1.1487[/C][C]0.127265[/C][/ROW]
[ROW][C]41[/C][C]0.039173[/C][C]0.3301[/C][C]0.371158[/C][/ROW]
[ROW][C]42[/C][C]-0.025361[/C][C]-0.2137[/C][C]0.415697[/C][/ROW]
[ROW][C]43[/C][C]-0.129136[/C][C]-1.0881[/C][C]0.140111[/C][/ROW]
[ROW][C]44[/C][C]0.007546[/C][C]0.0636[/C][C]0.474742[/C][/ROW]
[ROW][C]45[/C][C]-0.020955[/C][C]-0.1766[/C][C]0.430174[/C][/ROW]
[ROW][C]46[/C][C]0.043811[/C][C]0.3692[/C][C]0.356555[/C][/ROW]
[ROW][C]47[/C][C]0.003677[/C][C]0.031[/C][C]0.487685[/C][/ROW]
[ROW][C]48[/C][C]-0.078451[/C][C]-0.661[/C][C]0.255363[/C][/ROW]
[/TABLE]
Source: https://freestatistics.org/blog/index.php?pk=&T=2

Globally Unique Identifier (entire table): ba.freestatistics.org/blog/index.php?pk=&T=2

As an alternative you can also use a QR Code:  

The GUIDs for individual cells are displayed in the table below:

Partial Autocorrelation Function
Time lag kPACF(k)T-STATP-value
10.4906284.13414.8e-05
2-0.302907-2.55230.006426
30.0300090.25290.400555
4-0.040035-0.33730.368429
5-0.072547-0.61130.27148
60.0581030.48960.312969
7-0.122451-1.03180.152835
8-0.132514-1.11660.133969
9-0.038032-0.32050.37478
100.0358360.3020.381783
110.1941411.63590.053148
120.1345021.13330.130443
13-0.190766-1.60740.0562
140.034970.29470.384555
150.03420.28820.387027
16-0.017012-0.14330.443212
17-0.001203-0.01010.495971
180.0820010.6910.245923
19-0.143334-1.20780.115574
200.1063660.89630.186574
210.1763021.48550.070913
220.0009970.00840.49666
23-0.159684-1.34550.091369
240.1232291.03830.151316
25-0.15808-1.3320.093559
260.0527350.44440.329068
27-0.116621-0.98270.164555
28-0.057853-0.48750.313712
29-0.03068-0.25850.398379
30-0.052136-0.43930.330888
31-0.008888-0.07490.470257
320.0967240.8150.208896
330.0030870.0260.489661
340.0199930.16850.433347
35-0.054186-0.45660.324684
36-0.096745-0.81520.208845
37-0.051369-0.43280.333219
38-0.026782-0.22570.411054
390.0045160.03810.484876
40-0.136327-1.14870.127265
410.0391730.33010.371158
42-0.025361-0.21370.415697
43-0.129136-1.08810.140111
440.0075460.06360.474742
45-0.020955-0.17660.430174
460.0438110.36920.356555
470.0036770.0310.487685
48-0.078451-0.6610.255363


Parameters (Session):
par1 = 48 ; par2 = 1 ; par3 = 1 ; par4 = 0 ; par5 = 12 ; par6 = White Noise ; par7 = 0.95 ;
Parameters (R input):
par1 = 48 ; par2 = 1 ; par3 = 1 ; par4 = 0 ; par5 = 12 ; par6 = White Noise ; par7 = 0.95 ; par8 = ;
R code (references can be found in the software module):
par8 <- ''
par7 <- '0.95'
par6 <- 'White Noise'
par5 <- '12'
par4 <- '0'
par3 <- '1'
par2 <- '1'
par1 <- 'Default'
if (par1 == 'Default') {
par1 = 10*log10(length(x))
} else {
par1 <- as.numeric(par1)
}
par2 <- as.numeric(par2)
par3 <- as.numeric(par3)
par4 <- as.numeric(par4)
par5 <- as.numeric(par5)
if (par6 == 'White Noise') par6 <- 'white' else par6 <- 'ma'
par7 <- as.numeric(par7)
if (par8 != '') par8 <- as.numeric(par8)
x <- na.omit(x)
ox <- x
if (par8 == '') {
if (par2 == 0) {
x <- log(x)
} else {
x <- (x ^ par2 - 1) / par2
}
} else {
x <- log(x,base=par8)
}
if (par3 > 0) x <- diff(x,lag=1,difference=par3)
if (par4 > 0) x <- diff(x,lag=par5,difference=par4)
bitmap(file='picts.png')
op <- par(mfrow=c(2,1))
plot(ox,type='l',main='Original Time Series',xlab='time',ylab='value')
if (par8=='') {
mytitle <- paste('Working Time Series (lambda=',par2,', d=',par3,', D=',par4,')',sep='')
mysub <- paste('(lambda=',par2,', d=',par3,', D=',par4,', CI=', par7, ', CI type=',par6,')',sep='')
} else {
mytitle <- paste('Working Time Series (base=',par8,', d=',par3,', D=',par4,')',sep='')
mysub <- paste('(base=',par8,', d=',par3,', D=',par4,', CI=', par7, ', CI type=',par6,')',sep='')
}
plot(x,type='l', main=mytitle,xlab='time',ylab='value')
par(op)
dev.off()
bitmap(file='pic1.png')
racf <- acf(x, par1, main='Autocorrelation', xlab='time lag', ylab='ACF', ci.type=par6, ci=par7, sub=mysub)
dev.off()
bitmap(file='pic2.png')
rpacf <- pacf(x,par1,main='Partial Autocorrelation',xlab='lags',ylab='PACF',sub=mysub)
dev.off()
(myacf <- c(racf$acf))
(mypacf <- c(rpacf$acf))
lengthx <- length(x)
sqrtn <- sqrt(lengthx)
load(file='createtable')
a<-table.start()
a<-table.row.start(a)
a<-table.element(a,'Autocorrelation Function',4,TRUE)
a<-table.row.end(a)
a<-table.row.start(a)
a<-table.element(a,'Time lag k',header=TRUE)
a<-table.element(a,hyperlink('basics.htm','ACF(k)','click here for more information about the Autocorrelation Function'),header=TRUE)
a<-table.element(a,'T-STAT',header=TRUE)
a<-table.element(a,'P-value',header=TRUE)
a<-table.row.end(a)
for (i in 2:(par1+1)) {
a<-table.row.start(a)
a<-table.element(a,i-1,header=TRUE)
a<-table.element(a,round(myacf[i],6))
mytstat <- myacf[i]*sqrtn
a<-table.element(a,round(mytstat,4))
a<-table.element(a,round(1-pt(abs(mytstat),lengthx),6))
a<-table.row.end(a)
}
a<-table.end(a)
table.save(a,file='mytable.tab')
a<-table.start()
a<-table.row.start(a)
a<-table.element(a,'Partial Autocorrelation Function',4,TRUE)
a<-table.row.end(a)
a<-table.row.start(a)
a<-table.element(a,'Time lag k',header=TRUE)
a<-table.element(a,hyperlink('basics.htm','PACF(k)','click here for more information about the Partial Autocorrelation Function'),header=TRUE)
a<-table.element(a,'T-STAT',header=TRUE)
a<-table.element(a,'P-value',header=TRUE)
a<-table.row.end(a)
for (i in 1:par1) {
a<-table.row.start(a)
a<-table.element(a,i,header=TRUE)
a<-table.element(a,round(mypacf[i],6))
mytstat <- mypacf[i]*sqrtn
a<-table.element(a,round(mytstat,4))
a<-table.element(a,round(1-pt(abs(mytstat),lengthx),6))
a<-table.row.end(a)
}
a<-table.end(a)
table.save(a,file='mytable1.tab')