Free Statistics

of Irreproducible Research!

Author's title

Author*Unverified author*
R Software Modulerwasp_autocorrelation.wasp
Title produced by software(Partial) Autocorrelation Function
Date of computationWed, 19 Oct 2016 12:29:44 +0100
Cite this page as followsStatistical Computations at FreeStatistics.org, Office for Research Development and Education, URL https://freestatistics.org/blog/index.php?v=date/2016/Oct/19/t1476876606l4t1mev9wlg5q97.htm/, Retrieved Tue, 30 Apr 2024 02:20:17 +0200
Statistical Computations at FreeStatistics.org, Office for Research Development and Education, URL https://freestatistics.org/blog/index.php?pk=, Retrieved Tue, 30 Apr 2024 02:20:17 +0200
QR Codes:

Original text written by user:
IsPrivate?No (this computation is public)
User-defined keywords
Estimated Impact0
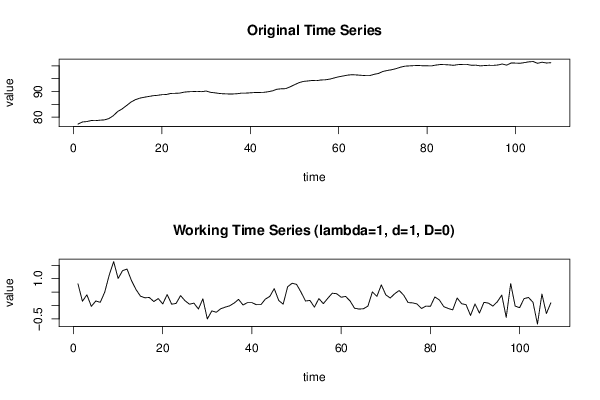
Dataseries X:
77.34
78.15
78.31
78.71
78.68
78.85
78.97
79.47
80.6
82.24
83.25
84.55
85.91
86.84
87.44
87.79
88.08
88.38
88.53
88.79
88.85
89.26
89.31
89.39
89.76
89.94
89.99
90.08
89.95
90.2
89.7
89.5
89.25
89.13
89.07
89.06
89.15
89.38
89.4
89.51
89.62
89.65
89.68
89.92
90.26
90.89
91.08
91.13
91.83
92.66
93.45
93.95
94.12
94.31
94.25
94.51
94.58
94.85
95.31
95.75
96.06
96.4
96.57
96.47
96.34
96.22
96.2
96.71
97.05
97.82
98.22
98.5
98.94
99.5
99.89
100
100.1
100.16
100.05
100.03
100
100.32
100.53
100.49
100.38
100.22
100.5
100.57
100.6
100.23
100.29
100.01
100.13
100.22
100.2
100.34
100.73
100.29
101.11
101.09
101.01
101.27
101.57
101.69
101
101.43
101.13
101.23


Summary of computational transaction
Raw Inputview raw input (R code)
Raw Outputview raw output of R engine
Computing time1 seconds
R Server'George Udny Yule' @ yule.wessa.net

\begin{tabular}{lllllllll}
\hline
Summary of computational transaction \tabularnewline
Raw Input & view raw input (R code)  \tabularnewline
Raw Output & view raw output of R engine  \tabularnewline
Computing time & 1 seconds \tabularnewline
R Server & 'George Udny Yule' @ yule.wessa.net \tabularnewline
\hline
\end{tabular}
%Source: https://freestatistics.org/blog/index.php?pk=&T=0

[TABLE]
[ROW][C]Summary of computational transaction[/C][/ROW]
[ROW][C]Raw Input[/C][C]view raw input (R code) [/C][/ROW]
[ROW][C]Raw Output[/C][C]view raw output of R engine [/C][/ROW]
[ROW][C]Computing time[/C][C]1 seconds[/C][/ROW]
[ROW][C]R Server[/C][C]'George Udny Yule' @ yule.wessa.net[/C][/ROW]
[/TABLE]
Source: https://freestatistics.org/blog/index.php?pk=&T=0

Globally Unique Identifier (entire table): ba.freestatistics.org/blog/index.php?pk=&T=0

As an alternative you can also use a QR Code:  

The GUIDs for individual cells are displayed in the table below:

Summary of computational transaction
Raw Inputview raw input (R code)
Raw Outputview raw output of R engine
Computing time1 seconds
R Server'George Udny Yule' @ yule.wessa.net


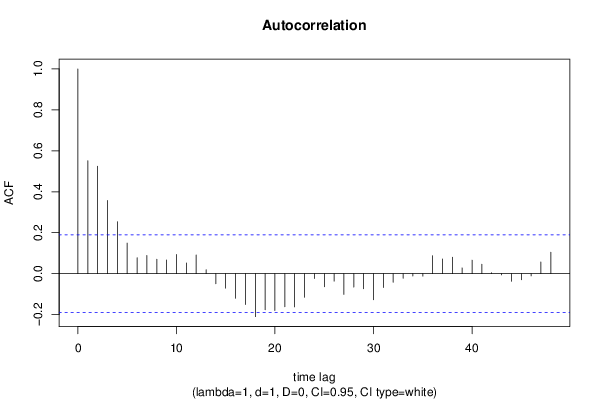
Autocorrelation Function
Time lag kACF(k)T-STATP-value
10.551615.70590
20.5248185.42880
30.3569883.69270.000176
40.2539642.6270.004939
50.149041.54170.063051
60.0773780.80040.212624
70.0884250.91470.18121
80.0702290.72650.234573
90.066380.68660.246898
100.0939780.97210.166592
110.0518750.53660.296328
120.0912910.94430.173567
130.0187590.1940.423254
14-0.04961-0.51320.304446
15-0.070934-0.73380.232353
16-0.119889-1.24010.108818
17-0.150958-1.56150.060677
18-0.210068-2.1730.015995
19-0.17616-1.82220.035608
20-0.180435-1.86640.032359
21-0.161806-1.67370.048552
22-0.162426-1.68010.047923
23-0.115467-1.19440.117481
24-0.023608-0.24420.40377
25-0.064147-0.66350.254206
26-0.036591-0.37850.352903
27-0.101186-1.04670.148805
28-0.065693-0.67950.249132
29-0.07379-0.76330.223484
30-0.127478-1.31860.095051
31-0.067968-0.70310.241771
32-0.041753-0.43190.333342
33-0.0228-0.23580.407
34-0.011227-0.11610.453881
35-0.012204-0.12620.449889
360.0873110.90320.184236
370.0716520.74120.230105
380.0805010.83270.203431
390.0281090.29080.385898
400.0659460.68220.248308
410.0463060.4790.31646
420.0041440.04290.482945
43-0.006215-0.06430.474432
44-0.037262-0.38540.350338
45-0.029612-0.30630.379982
46-0.010794-0.11170.455654
470.0572760.59250.277395
480.1048811.08490.140202

\begin{tabular}{lllllllll}
\hline
Autocorrelation Function \tabularnewline
Time lag k & ACF(k) & T-STAT & P-value \tabularnewline
1 & 0.55161 & 5.7059 & 0 \tabularnewline
2 & 0.524818 & 5.4288 & 0 \tabularnewline
3 & 0.356988 & 3.6927 & 0.000176 \tabularnewline
4 & 0.253964 & 2.627 & 0.004939 \tabularnewline
5 & 0.14904 & 1.5417 & 0.063051 \tabularnewline
6 & 0.077378 & 0.8004 & 0.212624 \tabularnewline
7 & 0.088425 & 0.9147 & 0.18121 \tabularnewline
8 & 0.070229 & 0.7265 & 0.234573 \tabularnewline
9 & 0.06638 & 0.6866 & 0.246898 \tabularnewline
10 & 0.093978 & 0.9721 & 0.166592 \tabularnewline
11 & 0.051875 & 0.5366 & 0.296328 \tabularnewline
12 & 0.091291 & 0.9443 & 0.173567 \tabularnewline
13 & 0.018759 & 0.194 & 0.423254 \tabularnewline
14 & -0.04961 & -0.5132 & 0.304446 \tabularnewline
15 & -0.070934 & -0.7338 & 0.232353 \tabularnewline
16 & -0.119889 & -1.2401 & 0.108818 \tabularnewline
17 & -0.150958 & -1.5615 & 0.060677 \tabularnewline
18 & -0.210068 & -2.173 & 0.015995 \tabularnewline
19 & -0.17616 & -1.8222 & 0.035608 \tabularnewline
20 & -0.180435 & -1.8664 & 0.032359 \tabularnewline
21 & -0.161806 & -1.6737 & 0.048552 \tabularnewline
22 & -0.162426 & -1.6801 & 0.047923 \tabularnewline
23 & -0.115467 & -1.1944 & 0.117481 \tabularnewline
24 & -0.023608 & -0.2442 & 0.40377 \tabularnewline
25 & -0.064147 & -0.6635 & 0.254206 \tabularnewline
26 & -0.036591 & -0.3785 & 0.352903 \tabularnewline
27 & -0.101186 & -1.0467 & 0.148805 \tabularnewline
28 & -0.065693 & -0.6795 & 0.249132 \tabularnewline
29 & -0.07379 & -0.7633 & 0.223484 \tabularnewline
30 & -0.127478 & -1.3186 & 0.095051 \tabularnewline
31 & -0.067968 & -0.7031 & 0.241771 \tabularnewline
32 & -0.041753 & -0.4319 & 0.333342 \tabularnewline
33 & -0.0228 & -0.2358 & 0.407 \tabularnewline
34 & -0.011227 & -0.1161 & 0.453881 \tabularnewline
35 & -0.012204 & -0.1262 & 0.449889 \tabularnewline
36 & 0.087311 & 0.9032 & 0.184236 \tabularnewline
37 & 0.071652 & 0.7412 & 0.230105 \tabularnewline
38 & 0.080501 & 0.8327 & 0.203431 \tabularnewline
39 & 0.028109 & 0.2908 & 0.385898 \tabularnewline
40 & 0.065946 & 0.6822 & 0.248308 \tabularnewline
41 & 0.046306 & 0.479 & 0.31646 \tabularnewline
42 & 0.004144 & 0.0429 & 0.482945 \tabularnewline
43 & -0.006215 & -0.0643 & 0.474432 \tabularnewline
44 & -0.037262 & -0.3854 & 0.350338 \tabularnewline
45 & -0.029612 & -0.3063 & 0.379982 \tabularnewline
46 & -0.010794 & -0.1117 & 0.455654 \tabularnewline
47 & 0.057276 & 0.5925 & 0.277395 \tabularnewline
48 & 0.104881 & 1.0849 & 0.140202 \tabularnewline
\hline
\end{tabular}
%Source: https://freestatistics.org/blog/index.php?pk=&T=1

[TABLE]
[ROW][C]Autocorrelation Function[/C][/ROW]
[ROW][C]Time lag k[/C][C]ACF(k)[/C][C]T-STAT[/C][C]P-value[/C][/ROW]
[ROW][C]1[/C][C]0.55161[/C][C]5.7059[/C][C]0[/C][/ROW]
[ROW][C]2[/C][C]0.524818[/C][C]5.4288[/C][C]0[/C][/ROW]
[ROW][C]3[/C][C]0.356988[/C][C]3.6927[/C][C]0.000176[/C][/ROW]
[ROW][C]4[/C][C]0.253964[/C][C]2.627[/C][C]0.004939[/C][/ROW]
[ROW][C]5[/C][C]0.14904[/C][C]1.5417[/C][C]0.063051[/C][/ROW]
[ROW][C]6[/C][C]0.077378[/C][C]0.8004[/C][C]0.212624[/C][/ROW]
[ROW][C]7[/C][C]0.088425[/C][C]0.9147[/C][C]0.18121[/C][/ROW]
[ROW][C]8[/C][C]0.070229[/C][C]0.7265[/C][C]0.234573[/C][/ROW]
[ROW][C]9[/C][C]0.06638[/C][C]0.6866[/C][C]0.246898[/C][/ROW]
[ROW][C]10[/C][C]0.093978[/C][C]0.9721[/C][C]0.166592[/C][/ROW]
[ROW][C]11[/C][C]0.051875[/C][C]0.5366[/C][C]0.296328[/C][/ROW]
[ROW][C]12[/C][C]0.091291[/C][C]0.9443[/C][C]0.173567[/C][/ROW]
[ROW][C]13[/C][C]0.018759[/C][C]0.194[/C][C]0.423254[/C][/ROW]
[ROW][C]14[/C][C]-0.04961[/C][C]-0.5132[/C][C]0.304446[/C][/ROW]
[ROW][C]15[/C][C]-0.070934[/C][C]-0.7338[/C][C]0.232353[/C][/ROW]
[ROW][C]16[/C][C]-0.119889[/C][C]-1.2401[/C][C]0.108818[/C][/ROW]
[ROW][C]17[/C][C]-0.150958[/C][C]-1.5615[/C][C]0.060677[/C][/ROW]
[ROW][C]18[/C][C]-0.210068[/C][C]-2.173[/C][C]0.015995[/C][/ROW]
[ROW][C]19[/C][C]-0.17616[/C][C]-1.8222[/C][C]0.035608[/C][/ROW]
[ROW][C]20[/C][C]-0.180435[/C][C]-1.8664[/C][C]0.032359[/C][/ROW]
[ROW][C]21[/C][C]-0.161806[/C][C]-1.6737[/C][C]0.048552[/C][/ROW]
[ROW][C]22[/C][C]-0.162426[/C][C]-1.6801[/C][C]0.047923[/C][/ROW]
[ROW][C]23[/C][C]-0.115467[/C][C]-1.1944[/C][C]0.117481[/C][/ROW]
[ROW][C]24[/C][C]-0.023608[/C][C]-0.2442[/C][C]0.40377[/C][/ROW]
[ROW][C]25[/C][C]-0.064147[/C][C]-0.6635[/C][C]0.254206[/C][/ROW]
[ROW][C]26[/C][C]-0.036591[/C][C]-0.3785[/C][C]0.352903[/C][/ROW]
[ROW][C]27[/C][C]-0.101186[/C][C]-1.0467[/C][C]0.148805[/C][/ROW]
[ROW][C]28[/C][C]-0.065693[/C][C]-0.6795[/C][C]0.249132[/C][/ROW]
[ROW][C]29[/C][C]-0.07379[/C][C]-0.7633[/C][C]0.223484[/C][/ROW]
[ROW][C]30[/C][C]-0.127478[/C][C]-1.3186[/C][C]0.095051[/C][/ROW]
[ROW][C]31[/C][C]-0.067968[/C][C]-0.7031[/C][C]0.241771[/C][/ROW]
[ROW][C]32[/C][C]-0.041753[/C][C]-0.4319[/C][C]0.333342[/C][/ROW]
[ROW][C]33[/C][C]-0.0228[/C][C]-0.2358[/C][C]0.407[/C][/ROW]
[ROW][C]34[/C][C]-0.011227[/C][C]-0.1161[/C][C]0.453881[/C][/ROW]
[ROW][C]35[/C][C]-0.012204[/C][C]-0.1262[/C][C]0.449889[/C][/ROW]
[ROW][C]36[/C][C]0.087311[/C][C]0.9032[/C][C]0.184236[/C][/ROW]
[ROW][C]37[/C][C]0.071652[/C][C]0.7412[/C][C]0.230105[/C][/ROW]
[ROW][C]38[/C][C]0.080501[/C][C]0.8327[/C][C]0.203431[/C][/ROW]
[ROW][C]39[/C][C]0.028109[/C][C]0.2908[/C][C]0.385898[/C][/ROW]
[ROW][C]40[/C][C]0.065946[/C][C]0.6822[/C][C]0.248308[/C][/ROW]
[ROW][C]41[/C][C]0.046306[/C][C]0.479[/C][C]0.31646[/C][/ROW]
[ROW][C]42[/C][C]0.004144[/C][C]0.0429[/C][C]0.482945[/C][/ROW]
[ROW][C]43[/C][C]-0.006215[/C][C]-0.0643[/C][C]0.474432[/C][/ROW]
[ROW][C]44[/C][C]-0.037262[/C][C]-0.3854[/C][C]0.350338[/C][/ROW]
[ROW][C]45[/C][C]-0.029612[/C][C]-0.3063[/C][C]0.379982[/C][/ROW]
[ROW][C]46[/C][C]-0.010794[/C][C]-0.1117[/C][C]0.455654[/C][/ROW]
[ROW][C]47[/C][C]0.057276[/C][C]0.5925[/C][C]0.277395[/C][/ROW]
[ROW][C]48[/C][C]0.104881[/C][C]1.0849[/C][C]0.140202[/C][/ROW]
[/TABLE]
Source: https://freestatistics.org/blog/index.php?pk=&T=1

Globally Unique Identifier (entire table): ba.freestatistics.org/blog/index.php?pk=&T=1

As an alternative you can also use a QR Code:  

The GUIDs for individual cells are displayed in the table below:

Autocorrelation Function
Time lag kACF(k)T-STATP-value
10.551615.70590
20.5248185.42880
30.3569883.69270.000176
40.2539642.6270.004939
50.149041.54170.063051
60.0773780.80040.212624
70.0884250.91470.18121
80.0702290.72650.234573
90.066380.68660.246898
100.0939780.97210.166592
110.0518750.53660.296328
120.0912910.94430.173567
130.0187590.1940.423254
14-0.04961-0.51320.304446
15-0.070934-0.73380.232353
16-0.119889-1.24010.108818
17-0.150958-1.56150.060677
18-0.210068-2.1730.015995
19-0.17616-1.82220.035608
20-0.180435-1.86640.032359
21-0.161806-1.67370.048552
22-0.162426-1.68010.047923
23-0.115467-1.19440.117481
24-0.023608-0.24420.40377
25-0.064147-0.66350.254206
26-0.036591-0.37850.352903
27-0.101186-1.04670.148805
28-0.065693-0.67950.249132
29-0.07379-0.76330.223484
30-0.127478-1.31860.095051
31-0.067968-0.70310.241771
32-0.041753-0.43190.333342
33-0.0228-0.23580.407
34-0.011227-0.11610.453881
35-0.012204-0.12620.449889
360.0873110.90320.184236
370.0716520.74120.230105
380.0805010.83270.203431
390.0281090.29080.385898
400.0659460.68220.248308
410.0463060.4790.31646
420.0041440.04290.482945
43-0.006215-0.06430.474432
44-0.037262-0.38540.350338
45-0.029612-0.30630.379982
46-0.010794-0.11170.455654
470.0572760.59250.277395
480.1048811.08490.140202


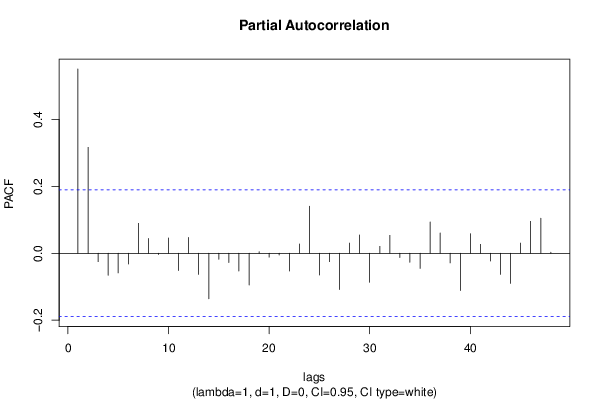
Partial Autocorrelation Function
Time lag kPACF(k)T-STATP-value
10.551615.70590
20.3169983.27910.000703
3-0.024923-0.25780.398527
4-0.065394-0.67640.250111
5-0.058481-0.60490.273254
6-0.032179-0.33290.369944
70.0896930.92780.177803
80.0443010.45820.323852
9-0.003691-0.03820.484807
100.0460050.47590.317564
11-0.051652-0.53430.297122
120.0474290.49060.312355
13-0.063094-0.65260.257692
14-0.135738-1.40410.081595
15-0.017886-0.1850.426784
16-0.027412-0.28360.38865
17-0.052958-0.54780.292484
18-0.094796-0.98060.164506
190.0045970.04760.481079
20-0.011406-0.1180.45315
21-0.004937-0.05110.479684
22-0.053052-0.54880.292152
230.0281160.29080.38587
240.1410571.45910.073733
25-0.064702-0.66930.252377
26-0.024955-0.25810.398398
27-0.108251-1.11980.132663
280.0305890.31640.376154
290.0549940.56890.285322
30-0.086639-0.89620.186079
310.0209160.21640.414559
320.0536930.55540.289888
33-0.012546-0.12980.448494
34-0.026692-0.27610.391502
35-0.045011-0.46560.321223
360.0939040.97140.166782
370.0609330.63030.264923
38-0.028543-0.29530.384186
39-0.111083-1.14910.126548
400.0586390.60660.272711
410.0267410.27660.391306
42-0.022823-0.23610.406911
43-0.063028-0.6520.257909
44-0.090002-0.9310.176978
450.0305050.31560.376479
460.0956530.98940.16234
470.1051291.08750.139637
480.0033250.03440.486315

\begin{tabular}{lllllllll}
\hline
Partial Autocorrelation Function \tabularnewline
Time lag k & PACF(k) & T-STAT & P-value \tabularnewline
1 & 0.55161 & 5.7059 & 0 \tabularnewline
2 & 0.316998 & 3.2791 & 0.000703 \tabularnewline
3 & -0.024923 & -0.2578 & 0.398527 \tabularnewline
4 & -0.065394 & -0.6764 & 0.250111 \tabularnewline
5 & -0.058481 & -0.6049 & 0.273254 \tabularnewline
6 & -0.032179 & -0.3329 & 0.369944 \tabularnewline
7 & 0.089693 & 0.9278 & 0.177803 \tabularnewline
8 & 0.044301 & 0.4582 & 0.323852 \tabularnewline
9 & -0.003691 & -0.0382 & 0.484807 \tabularnewline
10 & 0.046005 & 0.4759 & 0.317564 \tabularnewline
11 & -0.051652 & -0.5343 & 0.297122 \tabularnewline
12 & 0.047429 & 0.4906 & 0.312355 \tabularnewline
13 & -0.063094 & -0.6526 & 0.257692 \tabularnewline
14 & -0.135738 & -1.4041 & 0.081595 \tabularnewline
15 & -0.017886 & -0.185 & 0.426784 \tabularnewline
16 & -0.027412 & -0.2836 & 0.38865 \tabularnewline
17 & -0.052958 & -0.5478 & 0.292484 \tabularnewline
18 & -0.094796 & -0.9806 & 0.164506 \tabularnewline
19 & 0.004597 & 0.0476 & 0.481079 \tabularnewline
20 & -0.011406 & -0.118 & 0.45315 \tabularnewline
21 & -0.004937 & -0.0511 & 0.479684 \tabularnewline
22 & -0.053052 & -0.5488 & 0.292152 \tabularnewline
23 & 0.028116 & 0.2908 & 0.38587 \tabularnewline
24 & 0.141057 & 1.4591 & 0.073733 \tabularnewline
25 & -0.064702 & -0.6693 & 0.252377 \tabularnewline
26 & -0.024955 & -0.2581 & 0.398398 \tabularnewline
27 & -0.108251 & -1.1198 & 0.132663 \tabularnewline
28 & 0.030589 & 0.3164 & 0.376154 \tabularnewline
29 & 0.054994 & 0.5689 & 0.285322 \tabularnewline
30 & -0.086639 & -0.8962 & 0.186079 \tabularnewline
31 & 0.020916 & 0.2164 & 0.414559 \tabularnewline
32 & 0.053693 & 0.5554 & 0.289888 \tabularnewline
33 & -0.012546 & -0.1298 & 0.448494 \tabularnewline
34 & -0.026692 & -0.2761 & 0.391502 \tabularnewline
35 & -0.045011 & -0.4656 & 0.321223 \tabularnewline
36 & 0.093904 & 0.9714 & 0.166782 \tabularnewline
37 & 0.060933 & 0.6303 & 0.264923 \tabularnewline
38 & -0.028543 & -0.2953 & 0.384186 \tabularnewline
39 & -0.111083 & -1.1491 & 0.126548 \tabularnewline
40 & 0.058639 & 0.6066 & 0.272711 \tabularnewline
41 & 0.026741 & 0.2766 & 0.391306 \tabularnewline
42 & -0.022823 & -0.2361 & 0.406911 \tabularnewline
43 & -0.063028 & -0.652 & 0.257909 \tabularnewline
44 & -0.090002 & -0.931 & 0.176978 \tabularnewline
45 & 0.030505 & 0.3156 & 0.376479 \tabularnewline
46 & 0.095653 & 0.9894 & 0.16234 \tabularnewline
47 & 0.105129 & 1.0875 & 0.139637 \tabularnewline
48 & 0.003325 & 0.0344 & 0.486315 \tabularnewline
\hline
\end{tabular}
%Source: https://freestatistics.org/blog/index.php?pk=&T=2

[TABLE]
[ROW][C]Partial Autocorrelation Function[/C][/ROW]
[ROW][C]Time lag k[/C][C]PACF(k)[/C][C]T-STAT[/C][C]P-value[/C][/ROW]
[ROW][C]1[/C][C]0.55161[/C][C]5.7059[/C][C]0[/C][/ROW]
[ROW][C]2[/C][C]0.316998[/C][C]3.2791[/C][C]0.000703[/C][/ROW]
[ROW][C]3[/C][C]-0.024923[/C][C]-0.2578[/C][C]0.398527[/C][/ROW]
[ROW][C]4[/C][C]-0.065394[/C][C]-0.6764[/C][C]0.250111[/C][/ROW]
[ROW][C]5[/C][C]-0.058481[/C][C]-0.6049[/C][C]0.273254[/C][/ROW]
[ROW][C]6[/C][C]-0.032179[/C][C]-0.3329[/C][C]0.369944[/C][/ROW]
[ROW][C]7[/C][C]0.089693[/C][C]0.9278[/C][C]0.177803[/C][/ROW]
[ROW][C]8[/C][C]0.044301[/C][C]0.4582[/C][C]0.323852[/C][/ROW]
[ROW][C]9[/C][C]-0.003691[/C][C]-0.0382[/C][C]0.484807[/C][/ROW]
[ROW][C]10[/C][C]0.046005[/C][C]0.4759[/C][C]0.317564[/C][/ROW]
[ROW][C]11[/C][C]-0.051652[/C][C]-0.5343[/C][C]0.297122[/C][/ROW]
[ROW][C]12[/C][C]0.047429[/C][C]0.4906[/C][C]0.312355[/C][/ROW]
[ROW][C]13[/C][C]-0.063094[/C][C]-0.6526[/C][C]0.257692[/C][/ROW]
[ROW][C]14[/C][C]-0.135738[/C][C]-1.4041[/C][C]0.081595[/C][/ROW]
[ROW][C]15[/C][C]-0.017886[/C][C]-0.185[/C][C]0.426784[/C][/ROW]
[ROW][C]16[/C][C]-0.027412[/C][C]-0.2836[/C][C]0.38865[/C][/ROW]
[ROW][C]17[/C][C]-0.052958[/C][C]-0.5478[/C][C]0.292484[/C][/ROW]
[ROW][C]18[/C][C]-0.094796[/C][C]-0.9806[/C][C]0.164506[/C][/ROW]
[ROW][C]19[/C][C]0.004597[/C][C]0.0476[/C][C]0.481079[/C][/ROW]
[ROW][C]20[/C][C]-0.011406[/C][C]-0.118[/C][C]0.45315[/C][/ROW]
[ROW][C]21[/C][C]-0.004937[/C][C]-0.0511[/C][C]0.479684[/C][/ROW]
[ROW][C]22[/C][C]-0.053052[/C][C]-0.5488[/C][C]0.292152[/C][/ROW]
[ROW][C]23[/C][C]0.028116[/C][C]0.2908[/C][C]0.38587[/C][/ROW]
[ROW][C]24[/C][C]0.141057[/C][C]1.4591[/C][C]0.073733[/C][/ROW]
[ROW][C]25[/C][C]-0.064702[/C][C]-0.6693[/C][C]0.252377[/C][/ROW]
[ROW][C]26[/C][C]-0.024955[/C][C]-0.2581[/C][C]0.398398[/C][/ROW]
[ROW][C]27[/C][C]-0.108251[/C][C]-1.1198[/C][C]0.132663[/C][/ROW]
[ROW][C]28[/C][C]0.030589[/C][C]0.3164[/C][C]0.376154[/C][/ROW]
[ROW][C]29[/C][C]0.054994[/C][C]0.5689[/C][C]0.285322[/C][/ROW]
[ROW][C]30[/C][C]-0.086639[/C][C]-0.8962[/C][C]0.186079[/C][/ROW]
[ROW][C]31[/C][C]0.020916[/C][C]0.2164[/C][C]0.414559[/C][/ROW]
[ROW][C]32[/C][C]0.053693[/C][C]0.5554[/C][C]0.289888[/C][/ROW]
[ROW][C]33[/C][C]-0.012546[/C][C]-0.1298[/C][C]0.448494[/C][/ROW]
[ROW][C]34[/C][C]-0.026692[/C][C]-0.2761[/C][C]0.391502[/C][/ROW]
[ROW][C]35[/C][C]-0.045011[/C][C]-0.4656[/C][C]0.321223[/C][/ROW]
[ROW][C]36[/C][C]0.093904[/C][C]0.9714[/C][C]0.166782[/C][/ROW]
[ROW][C]37[/C][C]0.060933[/C][C]0.6303[/C][C]0.264923[/C][/ROW]
[ROW][C]38[/C][C]-0.028543[/C][C]-0.2953[/C][C]0.384186[/C][/ROW]
[ROW][C]39[/C][C]-0.111083[/C][C]-1.1491[/C][C]0.126548[/C][/ROW]
[ROW][C]40[/C][C]0.058639[/C][C]0.6066[/C][C]0.272711[/C][/ROW]
[ROW][C]41[/C][C]0.026741[/C][C]0.2766[/C][C]0.391306[/C][/ROW]
[ROW][C]42[/C][C]-0.022823[/C][C]-0.2361[/C][C]0.406911[/C][/ROW]
[ROW][C]43[/C][C]-0.063028[/C][C]-0.652[/C][C]0.257909[/C][/ROW]
[ROW][C]44[/C][C]-0.090002[/C][C]-0.931[/C][C]0.176978[/C][/ROW]
[ROW][C]45[/C][C]0.030505[/C][C]0.3156[/C][C]0.376479[/C][/ROW]
[ROW][C]46[/C][C]0.095653[/C][C]0.9894[/C][C]0.16234[/C][/ROW]
[ROW][C]47[/C][C]0.105129[/C][C]1.0875[/C][C]0.139637[/C][/ROW]
[ROW][C]48[/C][C]0.003325[/C][C]0.0344[/C][C]0.486315[/C][/ROW]
[/TABLE]
Source: https://freestatistics.org/blog/index.php?pk=&T=2

Globally Unique Identifier (entire table): ba.freestatistics.org/blog/index.php?pk=&T=2

As an alternative you can also use a QR Code:  

The GUIDs for individual cells are displayed in the table below:

Partial Autocorrelation Function
Time lag kPACF(k)T-STATP-value
10.551615.70590
20.3169983.27910.000703
3-0.024923-0.25780.398527
4-0.065394-0.67640.250111
5-0.058481-0.60490.273254
6-0.032179-0.33290.369944
70.0896930.92780.177803
80.0443010.45820.323852
9-0.003691-0.03820.484807
100.0460050.47590.317564
11-0.051652-0.53430.297122
120.0474290.49060.312355
13-0.063094-0.65260.257692
14-0.135738-1.40410.081595
15-0.017886-0.1850.426784
16-0.027412-0.28360.38865
17-0.052958-0.54780.292484
18-0.094796-0.98060.164506
190.0045970.04760.481079
20-0.011406-0.1180.45315
21-0.004937-0.05110.479684
22-0.053052-0.54880.292152
230.0281160.29080.38587
240.1410571.45910.073733
25-0.064702-0.66930.252377
26-0.024955-0.25810.398398
27-0.108251-1.11980.132663
280.0305890.31640.376154
290.0549940.56890.285322
30-0.086639-0.89620.186079
310.0209160.21640.414559
320.0536930.55540.289888
33-0.012546-0.12980.448494
34-0.026692-0.27610.391502
35-0.045011-0.46560.321223
360.0939040.97140.166782
370.0609330.63030.264923
38-0.028543-0.29530.384186
39-0.111083-1.14910.126548
400.0586390.60660.272711
410.0267410.27660.391306
42-0.022823-0.23610.406911
43-0.063028-0.6520.257909
44-0.090002-0.9310.176978
450.0305050.31560.376479
460.0956530.98940.16234
470.1051291.08750.139637
480.0033250.03440.486315


Parameters (Session):
par1 = 48 ; par2 = 1 ; par3 = 1 ; par4 = 0 ; par5 = 12 ; par6 = White Noise ; par7 = 0.95 ;
Parameters (R input):
par1 = 48 ; par2 = 1 ; par3 = 1 ; par4 = 0 ; par5 = 12 ; par6 = White Noise ; par7 = 0.95 ; par8 = ;
R code (references can be found in the software module):
par8 <- ''
par7 <- '0.95'
par6 <- 'White Noise'
par5 <- '12'
par4 <- '0'
par3 <- '0'
par2 <- '1'
par1 <- '48'
if (par1 == 'Default') {
par1 = 10*log10(length(x))
} else {
par1 <- as.numeric(par1)
}
par2 <- as.numeric(par2)
par3 <- as.numeric(par3)
par4 <- as.numeric(par4)
par5 <- as.numeric(par5)
if (par6 == 'White Noise') par6 <- 'white' else par6 <- 'ma'
par7 <- as.numeric(par7)
if (par8 != '') par8 <- as.numeric(par8)
x <- na.omit(x)
ox <- x
if (par8 == '') {
if (par2 == 0) {
x <- log(x)
} else {
x <- (x ^ par2 - 1) / par2
}
} else {
x <- log(x,base=par8)
}
if (par3 > 0) x <- diff(x,lag=1,difference=par3)
if (par4 > 0) x <- diff(x,lag=par5,difference=par4)
bitmap(file='picts.png')
op <- par(mfrow=c(2,1))
plot(ox,type='l',main='Original Time Series',xlab='time',ylab='value')
if (par8=='') {
mytitle <- paste('Working Time Series (lambda=',par2,', d=',par3,', D=',par4,')',sep='')
mysub <- paste('(lambda=',par2,', d=',par3,', D=',par4,', CI=', par7, ', CI type=',par6,')',sep='')
} else {
mytitle <- paste('Working Time Series (base=',par8,', d=',par3,', D=',par4,')',sep='')
mysub <- paste('(base=',par8,', d=',par3,', D=',par4,', CI=', par7, ', CI type=',par6,')',sep='')
}
plot(x,type='l', main=mytitle,xlab='time',ylab='value')
par(op)
dev.off()
bitmap(file='pic1.png')
racf <- acf(x, par1, main='Autocorrelation', xlab='time lag', ylab='ACF', ci.type=par6, ci=par7, sub=mysub)
dev.off()
bitmap(file='pic2.png')
rpacf <- pacf(x,par1,main='Partial Autocorrelation',xlab='lags',ylab='PACF',sub=mysub)
dev.off()
(myacf <- c(racf$acf))
(mypacf <- c(rpacf$acf))
lengthx <- length(x)
sqrtn <- sqrt(lengthx)
load(file='createtable')
a<-table.start()
a<-table.row.start(a)
a<-table.element(a,'Autocorrelation Function',4,TRUE)
a<-table.row.end(a)
a<-table.row.start(a)
a<-table.element(a,'Time lag k',header=TRUE)
a<-table.element(a,hyperlink('basics.htm','ACF(k)','click here for more information about the Autocorrelation Function'),header=TRUE)
a<-table.element(a,'T-STAT',header=TRUE)
a<-table.element(a,'P-value',header=TRUE)
a<-table.row.end(a)
for (i in 2:(par1+1)) {
a<-table.row.start(a)
a<-table.element(a,i-1,header=TRUE)
a<-table.element(a,round(myacf[i],6))
mytstat <- myacf[i]*sqrtn
a<-table.element(a,round(mytstat,4))
a<-table.element(a,round(1-pt(abs(mytstat),lengthx),6))
a<-table.row.end(a)
}
a<-table.end(a)
table.save(a,file='mytable.tab')
a<-table.start()
a<-table.row.start(a)
a<-table.element(a,'Partial Autocorrelation Function',4,TRUE)
a<-table.row.end(a)
a<-table.row.start(a)
a<-table.element(a,'Time lag k',header=TRUE)
a<-table.element(a,hyperlink('basics.htm','PACF(k)','click here for more information about the Partial Autocorrelation Function'),header=TRUE)
a<-table.element(a,'T-STAT',header=TRUE)
a<-table.element(a,'P-value',header=TRUE)
a<-table.row.end(a)
for (i in 1:par1) {
a<-table.row.start(a)
a<-table.element(a,i,header=TRUE)
a<-table.element(a,round(mypacf[i],6))
mytstat <- mypacf[i]*sqrtn
a<-table.element(a,round(mytstat,4))
a<-table.element(a,round(1-pt(abs(mytstat),lengthx),6))
a<-table.row.end(a)
}
a<-table.end(a)
table.save(a,file='mytable1.tab')