Free Statistics

of Irreproducible Research!

Author's title

Author*Unverified author*
R Software Modulerwasp_autocorrelation.wasp
Title produced by software(Partial) Autocorrelation Function
Date of computationWed, 19 Oct 2016 13:10:26 +0100
Cite this page as followsStatistical Computations at FreeStatistics.org, Office for Research Development and Education, URL https://freestatistics.org/blog/index.php?v=date/2016/Oct/19/t14768790672upmaqs0h5a9pae.htm/, Retrieved Tue, 30 Apr 2024 04:21:52 +0200
Statistical Computations at FreeStatistics.org, Office for Research Development and Education, URL https://freestatistics.org/blog/index.php?pk=, Retrieved Tue, 30 Apr 2024 04:21:52 +0200
QR Codes:

Original text written by user:
IsPrivate?No (this computation is public)
User-defined keywords
Estimated Impact0
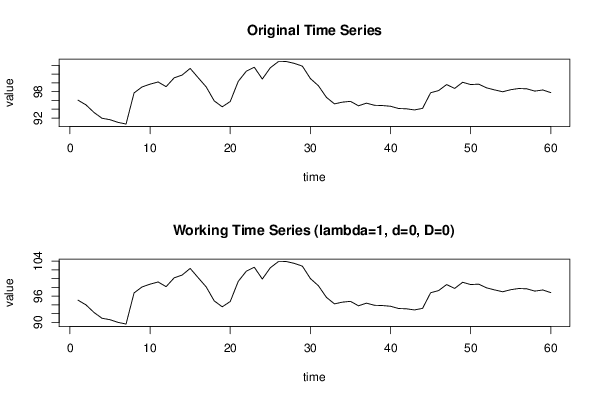
Dataseries X:
96,07
95
93,27
91,94
91,62
91,01
90,62
97,72
99,09
99,72
100,22
99,15
101,16
101,8
103,31
101,19
99,09
95,91
94,56
95,76
100,36
102,67
103,58
100,89
103,46
104,86
104,88
104,46
103,83
101
99,36
96,71
95,23
95,62
95,8
94,79
95,39
94,9
94,84
94,68
94,17
94,1
93,84
94,2
97,76
98,26
99,63
98,75
100,15
99,63
99,72
98,87
98,4
97,99
98,46
98,73
98,66
98,14
98,39
97,78


Summary of computational transaction
Raw Inputview raw input (R code)
Raw Outputview raw output of R engine
Computing time1 seconds
R Server'Sir Maurice George Kendall' @ kendall.wessa.net

\begin{tabular}{lllllllll}
\hline
Summary of computational transaction \tabularnewline
Raw Input & view raw input (R code)  \tabularnewline
Raw Output & view raw output of R engine  \tabularnewline
Computing time & 1 seconds \tabularnewline
R Server & 'Sir Maurice George Kendall' @ kendall.wessa.net \tabularnewline
\hline
\end{tabular}
%Source: https://freestatistics.org/blog/index.php?pk=&T=0

[TABLE]
[ROW][C]Summary of computational transaction[/C][/ROW]
[ROW][C]Raw Input[/C][C]view raw input (R code) [/C][/ROW]
[ROW][C]Raw Output[/C][C]view raw output of R engine [/C][/ROW]
[ROW][C]Computing time[/C][C]1 seconds[/C][/ROW]
[ROW][C]R Server[/C][C]'Sir Maurice George Kendall' @ kendall.wessa.net[/C][/ROW]
[/TABLE]
Source: https://freestatistics.org/blog/index.php?pk=&T=0

Globally Unique Identifier (entire table): ba.freestatistics.org/blog/index.php?pk=&T=0

As an alternative you can also use a QR Code:  

The GUIDs for individual cells are displayed in the table below:

Summary of computational transaction
Raw Inputview raw input (R code)
Raw Outputview raw output of R engine
Computing time1 seconds
R Server'Sir Maurice George Kendall' @ kendall.wessa.net


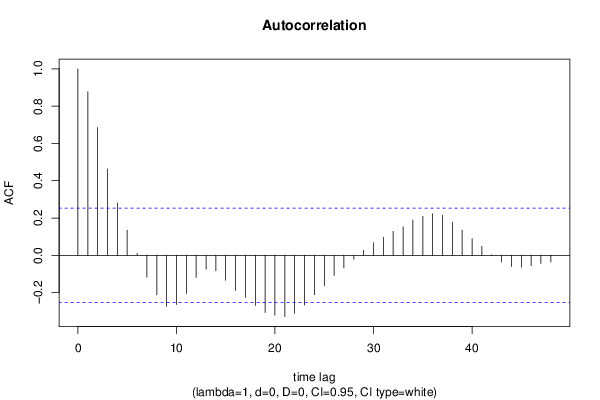
Autocorrelation Function
Time lag kACF(k)T-STATP-value
10.8778946.80010
20.6850675.30651e-06
30.463513.59030.000333
40.2806952.17430.01682
50.1345631.04230.150723
60.0098470.07630.469727
7-0.118075-0.91460.18203
8-0.212243-1.6440.0527
9-0.274286-2.12460.018874
10-0.264647-2.04990.022374
11-0.204444-1.58360.059269
12-0.118633-0.91890.180907
13-0.074789-0.57930.282273
14-0.083191-0.64440.260887
15-0.134396-1.0410.15102
16-0.18919-1.46550.074008
17-0.226541-1.75480.042201
18-0.269906-2.09070.0204
19-0.30769-2.38340.010169
20-0.322056-2.49460.00769
21-0.329466-2.5520.006637
22-0.31083-2.40770.009573
23-0.267207-2.06980.021393
24-0.211708-1.63990.053131
25-0.163598-1.26720.104986
26-0.107829-0.83520.203448
27-0.067792-0.52510.30072
28-0.021744-0.16840.433408
290.0268120.20770.41809
300.0670820.51960.302621
310.0963320.74620.229235
320.1284780.99520.161821
330.1524351.18080.121179
340.189671.46920.073505
350.2088511.61780.055481
360.2231741.72870.044503
370.2147341.66330.050731
380.1769711.37080.08777
390.1347841.0440.150329
400.0889630.68910.246707
410.0484260.37510.354452
420.0007970.00620.497546
43-0.036148-0.280.39022
44-0.060299-0.46710.321068
45-0.063837-0.49450.311387
46-0.05642-0.4370.33183
47-0.043708-0.33860.368062
48-0.036141-0.27990.390242

\begin{tabular}{lllllllll}
\hline
Autocorrelation Function \tabularnewline
Time lag k & ACF(k) & T-STAT & P-value \tabularnewline
1 & 0.877894 & 6.8001 & 0 \tabularnewline
2 & 0.685067 & 5.3065 & 1e-06 \tabularnewline
3 & 0.46351 & 3.5903 & 0.000333 \tabularnewline
4 & 0.280695 & 2.1743 & 0.01682 \tabularnewline
5 & 0.134563 & 1.0423 & 0.150723 \tabularnewline
6 & 0.009847 & 0.0763 & 0.469727 \tabularnewline
7 & -0.118075 & -0.9146 & 0.18203 \tabularnewline
8 & -0.212243 & -1.644 & 0.0527 \tabularnewline
9 & -0.274286 & -2.1246 & 0.018874 \tabularnewline
10 & -0.264647 & -2.0499 & 0.022374 \tabularnewline
11 & -0.204444 & -1.5836 & 0.059269 \tabularnewline
12 & -0.118633 & -0.9189 & 0.180907 \tabularnewline
13 & -0.074789 & -0.5793 & 0.282273 \tabularnewline
14 & -0.083191 & -0.6444 & 0.260887 \tabularnewline
15 & -0.134396 & -1.041 & 0.15102 \tabularnewline
16 & -0.18919 & -1.4655 & 0.074008 \tabularnewline
17 & -0.226541 & -1.7548 & 0.042201 \tabularnewline
18 & -0.269906 & -2.0907 & 0.0204 \tabularnewline
19 & -0.30769 & -2.3834 & 0.010169 \tabularnewline
20 & -0.322056 & -2.4946 & 0.00769 \tabularnewline
21 & -0.329466 & -2.552 & 0.006637 \tabularnewline
22 & -0.31083 & -2.4077 & 0.009573 \tabularnewline
23 & -0.267207 & -2.0698 & 0.021393 \tabularnewline
24 & -0.211708 & -1.6399 & 0.053131 \tabularnewline
25 & -0.163598 & -1.2672 & 0.104986 \tabularnewline
26 & -0.107829 & -0.8352 & 0.203448 \tabularnewline
27 & -0.067792 & -0.5251 & 0.30072 \tabularnewline
28 & -0.021744 & -0.1684 & 0.433408 \tabularnewline
29 & 0.026812 & 0.2077 & 0.41809 \tabularnewline
30 & 0.067082 & 0.5196 & 0.302621 \tabularnewline
31 & 0.096332 & 0.7462 & 0.229235 \tabularnewline
32 & 0.128478 & 0.9952 & 0.161821 \tabularnewline
33 & 0.152435 & 1.1808 & 0.121179 \tabularnewline
34 & 0.18967 & 1.4692 & 0.073505 \tabularnewline
35 & 0.208851 & 1.6178 & 0.055481 \tabularnewline
36 & 0.223174 & 1.7287 & 0.044503 \tabularnewline
37 & 0.214734 & 1.6633 & 0.050731 \tabularnewline
38 & 0.176971 & 1.3708 & 0.08777 \tabularnewline
39 & 0.134784 & 1.044 & 0.150329 \tabularnewline
40 & 0.088963 & 0.6891 & 0.246707 \tabularnewline
41 & 0.048426 & 0.3751 & 0.354452 \tabularnewline
42 & 0.000797 & 0.0062 & 0.497546 \tabularnewline
43 & -0.036148 & -0.28 & 0.39022 \tabularnewline
44 & -0.060299 & -0.4671 & 0.321068 \tabularnewline
45 & -0.063837 & -0.4945 & 0.311387 \tabularnewline
46 & -0.05642 & -0.437 & 0.33183 \tabularnewline
47 & -0.043708 & -0.3386 & 0.368062 \tabularnewline
48 & -0.036141 & -0.2799 & 0.390242 \tabularnewline
\hline
\end{tabular}
%Source: https://freestatistics.org/blog/index.php?pk=&T=1

[TABLE]
[ROW][C]Autocorrelation Function[/C][/ROW]
[ROW][C]Time lag k[/C][C]ACF(k)[/C][C]T-STAT[/C][C]P-value[/C][/ROW]
[ROW][C]1[/C][C]0.877894[/C][C]6.8001[/C][C]0[/C][/ROW]
[ROW][C]2[/C][C]0.685067[/C][C]5.3065[/C][C]1e-06[/C][/ROW]
[ROW][C]3[/C][C]0.46351[/C][C]3.5903[/C][C]0.000333[/C][/ROW]
[ROW][C]4[/C][C]0.280695[/C][C]2.1743[/C][C]0.01682[/C][/ROW]
[ROW][C]5[/C][C]0.134563[/C][C]1.0423[/C][C]0.150723[/C][/ROW]
[ROW][C]6[/C][C]0.009847[/C][C]0.0763[/C][C]0.469727[/C][/ROW]
[ROW][C]7[/C][C]-0.118075[/C][C]-0.9146[/C][C]0.18203[/C][/ROW]
[ROW][C]8[/C][C]-0.212243[/C][C]-1.644[/C][C]0.0527[/C][/ROW]
[ROW][C]9[/C][C]-0.274286[/C][C]-2.1246[/C][C]0.018874[/C][/ROW]
[ROW][C]10[/C][C]-0.264647[/C][C]-2.0499[/C][C]0.022374[/C][/ROW]
[ROW][C]11[/C][C]-0.204444[/C][C]-1.5836[/C][C]0.059269[/C][/ROW]
[ROW][C]12[/C][C]-0.118633[/C][C]-0.9189[/C][C]0.180907[/C][/ROW]
[ROW][C]13[/C][C]-0.074789[/C][C]-0.5793[/C][C]0.282273[/C][/ROW]
[ROW][C]14[/C][C]-0.083191[/C][C]-0.6444[/C][C]0.260887[/C][/ROW]
[ROW][C]15[/C][C]-0.134396[/C][C]-1.041[/C][C]0.15102[/C][/ROW]
[ROW][C]16[/C][C]-0.18919[/C][C]-1.4655[/C][C]0.074008[/C][/ROW]
[ROW][C]17[/C][C]-0.226541[/C][C]-1.7548[/C][C]0.042201[/C][/ROW]
[ROW][C]18[/C][C]-0.269906[/C][C]-2.0907[/C][C]0.0204[/C][/ROW]
[ROW][C]19[/C][C]-0.30769[/C][C]-2.3834[/C][C]0.010169[/C][/ROW]
[ROW][C]20[/C][C]-0.322056[/C][C]-2.4946[/C][C]0.00769[/C][/ROW]
[ROW][C]21[/C][C]-0.329466[/C][C]-2.552[/C][C]0.006637[/C][/ROW]
[ROW][C]22[/C][C]-0.31083[/C][C]-2.4077[/C][C]0.009573[/C][/ROW]
[ROW][C]23[/C][C]-0.267207[/C][C]-2.0698[/C][C]0.021393[/C][/ROW]
[ROW][C]24[/C][C]-0.211708[/C][C]-1.6399[/C][C]0.053131[/C][/ROW]
[ROW][C]25[/C][C]-0.163598[/C][C]-1.2672[/C][C]0.104986[/C][/ROW]
[ROW][C]26[/C][C]-0.107829[/C][C]-0.8352[/C][C]0.203448[/C][/ROW]
[ROW][C]27[/C][C]-0.067792[/C][C]-0.5251[/C][C]0.30072[/C][/ROW]
[ROW][C]28[/C][C]-0.021744[/C][C]-0.1684[/C][C]0.433408[/C][/ROW]
[ROW][C]29[/C][C]0.026812[/C][C]0.2077[/C][C]0.41809[/C][/ROW]
[ROW][C]30[/C][C]0.067082[/C][C]0.5196[/C][C]0.302621[/C][/ROW]
[ROW][C]31[/C][C]0.096332[/C][C]0.7462[/C][C]0.229235[/C][/ROW]
[ROW][C]32[/C][C]0.128478[/C][C]0.9952[/C][C]0.161821[/C][/ROW]
[ROW][C]33[/C][C]0.152435[/C][C]1.1808[/C][C]0.121179[/C][/ROW]
[ROW][C]34[/C][C]0.18967[/C][C]1.4692[/C][C]0.073505[/C][/ROW]
[ROW][C]35[/C][C]0.208851[/C][C]1.6178[/C][C]0.055481[/C][/ROW]
[ROW][C]36[/C][C]0.223174[/C][C]1.7287[/C][C]0.044503[/C][/ROW]
[ROW][C]37[/C][C]0.214734[/C][C]1.6633[/C][C]0.050731[/C][/ROW]
[ROW][C]38[/C][C]0.176971[/C][C]1.3708[/C][C]0.08777[/C][/ROW]
[ROW][C]39[/C][C]0.134784[/C][C]1.044[/C][C]0.150329[/C][/ROW]
[ROW][C]40[/C][C]0.088963[/C][C]0.6891[/C][C]0.246707[/C][/ROW]
[ROW][C]41[/C][C]0.048426[/C][C]0.3751[/C][C]0.354452[/C][/ROW]
[ROW][C]42[/C][C]0.000797[/C][C]0.0062[/C][C]0.497546[/C][/ROW]
[ROW][C]43[/C][C]-0.036148[/C][C]-0.28[/C][C]0.39022[/C][/ROW]
[ROW][C]44[/C][C]-0.060299[/C][C]-0.4671[/C][C]0.321068[/C][/ROW]
[ROW][C]45[/C][C]-0.063837[/C][C]-0.4945[/C][C]0.311387[/C][/ROW]
[ROW][C]46[/C][C]-0.05642[/C][C]-0.437[/C][C]0.33183[/C][/ROW]
[ROW][C]47[/C][C]-0.043708[/C][C]-0.3386[/C][C]0.368062[/C][/ROW]
[ROW][C]48[/C][C]-0.036141[/C][C]-0.2799[/C][C]0.390242[/C][/ROW]
[/TABLE]
Source: https://freestatistics.org/blog/index.php?pk=&T=1

Globally Unique Identifier (entire table): ba.freestatistics.org/blog/index.php?pk=&T=1

As an alternative you can also use a QR Code:  

The GUIDs for individual cells are displayed in the table below:

Autocorrelation Function
Time lag kACF(k)T-STATP-value
10.8778946.80010
20.6850675.30651e-06
30.463513.59030.000333
40.2806952.17430.01682
50.1345631.04230.150723
60.0098470.07630.469727
7-0.118075-0.91460.18203
8-0.212243-1.6440.0527
9-0.274286-2.12460.018874
10-0.264647-2.04990.022374
11-0.204444-1.58360.059269
12-0.118633-0.91890.180907
13-0.074789-0.57930.282273
14-0.083191-0.64440.260887
15-0.134396-1.0410.15102
16-0.18919-1.46550.074008
17-0.226541-1.75480.042201
18-0.269906-2.09070.0204
19-0.30769-2.38340.010169
20-0.322056-2.49460.00769
21-0.329466-2.5520.006637
22-0.31083-2.40770.009573
23-0.267207-2.06980.021393
24-0.211708-1.63990.053131
25-0.163598-1.26720.104986
26-0.107829-0.83520.203448
27-0.067792-0.52510.30072
28-0.021744-0.16840.433408
290.0268120.20770.41809
300.0670820.51960.302621
310.0963320.74620.229235
320.1284780.99520.161821
330.1524351.18080.121179
340.189671.46920.073505
350.2088511.61780.055481
360.2231741.72870.044503
370.2147341.66330.050731
380.1769711.37080.08777
390.1347841.0440.150329
400.0889630.68910.246707
410.0484260.37510.354452
420.0007970.00620.497546
43-0.036148-0.280.39022
44-0.060299-0.46710.321068
45-0.063837-0.49450.311387
46-0.05642-0.4370.33183
47-0.043708-0.33860.368062
48-0.036141-0.27990.390242


Partial Autocorrelation Function
Time lag kPACF(k)T-STATP-value
10.8778946.80010
2-0.373447-2.89270.002657
3-0.175633-1.36040.089388
40.0897920.69550.244705
5-0.053038-0.41080.341332
6-0.134093-1.03870.15156
7-0.171904-1.33160.094021
80.0724710.56140.288323
9-0.026861-0.20810.417941
100.1342781.04010.15123
110.0587770.45530.325273
120.0020980.01630.493543
13-0.208837-1.61760.055493
14-0.156348-1.21110.11531
15-0.084262-0.65270.258225
16-0.061545-0.47670.317643
17-0.014885-0.11530.454298
18-0.190333-1.47430.072812
190.0280120.2170.414479
200.1043290.80810.211104
21-0.114593-0.88760.189142
22-0.070907-0.54920.292438
23-0.036329-0.28140.389685
24-0.105334-0.81590.208887
25-0.180926-1.40140.083117
260.1004180.77780.219861
27-0.056603-0.43840.331319
280.0004550.00350.498598
290.0382090.2960.38414
30-0.013069-0.10120.459851
31-0.001192-0.00920.496333
320.0191890.14860.441169
33-0.045991-0.35620.361455
34-0.001887-0.01460.494192
35-0.055129-0.4270.335444
360.0177440.13740.445571
37-0.062199-0.48180.315854
38-0.101015-0.78250.218512
390.076210.59030.278596
40-0.11403-0.88330.190307
41-0.025006-0.19370.423535
42-0.093192-0.72190.236593
430.0148750.11520.454327
44-0.013492-0.10450.458557
450.0097910.07580.469898
46-0.098987-0.76670.223119
47-0.042968-0.33280.370212
48-0.003848-0.02980.48816

\begin{tabular}{lllllllll}
\hline
Partial Autocorrelation Function \tabularnewline
Time lag k & PACF(k) & T-STAT & P-value \tabularnewline
1 & 0.877894 & 6.8001 & 0 \tabularnewline
2 & -0.373447 & -2.8927 & 0.002657 \tabularnewline
3 & -0.175633 & -1.3604 & 0.089388 \tabularnewline
4 & 0.089792 & 0.6955 & 0.244705 \tabularnewline
5 & -0.053038 & -0.4108 & 0.341332 \tabularnewline
6 & -0.134093 & -1.0387 & 0.15156 \tabularnewline
7 & -0.171904 & -1.3316 & 0.094021 \tabularnewline
8 & 0.072471 & 0.5614 & 0.288323 \tabularnewline
9 & -0.026861 & -0.2081 & 0.417941 \tabularnewline
10 & 0.134278 & 1.0401 & 0.15123 \tabularnewline
11 & 0.058777 & 0.4553 & 0.325273 \tabularnewline
12 & 0.002098 & 0.0163 & 0.493543 \tabularnewline
13 & -0.208837 & -1.6176 & 0.055493 \tabularnewline
14 & -0.156348 & -1.2111 & 0.11531 \tabularnewline
15 & -0.084262 & -0.6527 & 0.258225 \tabularnewline
16 & -0.061545 & -0.4767 & 0.317643 \tabularnewline
17 & -0.014885 & -0.1153 & 0.454298 \tabularnewline
18 & -0.190333 & -1.4743 & 0.072812 \tabularnewline
19 & 0.028012 & 0.217 & 0.414479 \tabularnewline
20 & 0.104329 & 0.8081 & 0.211104 \tabularnewline
21 & -0.114593 & -0.8876 & 0.189142 \tabularnewline
22 & -0.070907 & -0.5492 & 0.292438 \tabularnewline
23 & -0.036329 & -0.2814 & 0.389685 \tabularnewline
24 & -0.105334 & -0.8159 & 0.208887 \tabularnewline
25 & -0.180926 & -1.4014 & 0.083117 \tabularnewline
26 & 0.100418 & 0.7778 & 0.219861 \tabularnewline
27 & -0.056603 & -0.4384 & 0.331319 \tabularnewline
28 & 0.000455 & 0.0035 & 0.498598 \tabularnewline
29 & 0.038209 & 0.296 & 0.38414 \tabularnewline
30 & -0.013069 & -0.1012 & 0.459851 \tabularnewline
31 & -0.001192 & -0.0092 & 0.496333 \tabularnewline
32 & 0.019189 & 0.1486 & 0.441169 \tabularnewline
33 & -0.045991 & -0.3562 & 0.361455 \tabularnewline
34 & -0.001887 & -0.0146 & 0.494192 \tabularnewline
35 & -0.055129 & -0.427 & 0.335444 \tabularnewline
36 & 0.017744 & 0.1374 & 0.445571 \tabularnewline
37 & -0.062199 & -0.4818 & 0.315854 \tabularnewline
38 & -0.101015 & -0.7825 & 0.218512 \tabularnewline
39 & 0.07621 & 0.5903 & 0.278596 \tabularnewline
40 & -0.11403 & -0.8833 & 0.190307 \tabularnewline
41 & -0.025006 & -0.1937 & 0.423535 \tabularnewline
42 & -0.093192 & -0.7219 & 0.236593 \tabularnewline
43 & 0.014875 & 0.1152 & 0.454327 \tabularnewline
44 & -0.013492 & -0.1045 & 0.458557 \tabularnewline
45 & 0.009791 & 0.0758 & 0.469898 \tabularnewline
46 & -0.098987 & -0.7667 & 0.223119 \tabularnewline
47 & -0.042968 & -0.3328 & 0.370212 \tabularnewline
48 & -0.003848 & -0.0298 & 0.48816 \tabularnewline
\hline
\end{tabular}
%Source: https://freestatistics.org/blog/index.php?pk=&T=2

[TABLE]
[ROW][C]Partial Autocorrelation Function[/C][/ROW]
[ROW][C]Time lag k[/C][C]PACF(k)[/C][C]T-STAT[/C][C]P-value[/C][/ROW]
[ROW][C]1[/C][C]0.877894[/C][C]6.8001[/C][C]0[/C][/ROW]
[ROW][C]2[/C][C]-0.373447[/C][C]-2.8927[/C][C]0.002657[/C][/ROW]
[ROW][C]3[/C][C]-0.175633[/C][C]-1.3604[/C][C]0.089388[/C][/ROW]
[ROW][C]4[/C][C]0.089792[/C][C]0.6955[/C][C]0.244705[/C][/ROW]
[ROW][C]5[/C][C]-0.053038[/C][C]-0.4108[/C][C]0.341332[/C][/ROW]
[ROW][C]6[/C][C]-0.134093[/C][C]-1.0387[/C][C]0.15156[/C][/ROW]
[ROW][C]7[/C][C]-0.171904[/C][C]-1.3316[/C][C]0.094021[/C][/ROW]
[ROW][C]8[/C][C]0.072471[/C][C]0.5614[/C][C]0.288323[/C][/ROW]
[ROW][C]9[/C][C]-0.026861[/C][C]-0.2081[/C][C]0.417941[/C][/ROW]
[ROW][C]10[/C][C]0.134278[/C][C]1.0401[/C][C]0.15123[/C][/ROW]
[ROW][C]11[/C][C]0.058777[/C][C]0.4553[/C][C]0.325273[/C][/ROW]
[ROW][C]12[/C][C]0.002098[/C][C]0.0163[/C][C]0.493543[/C][/ROW]
[ROW][C]13[/C][C]-0.208837[/C][C]-1.6176[/C][C]0.055493[/C][/ROW]
[ROW][C]14[/C][C]-0.156348[/C][C]-1.2111[/C][C]0.11531[/C][/ROW]
[ROW][C]15[/C][C]-0.084262[/C][C]-0.6527[/C][C]0.258225[/C][/ROW]
[ROW][C]16[/C][C]-0.061545[/C][C]-0.4767[/C][C]0.317643[/C][/ROW]
[ROW][C]17[/C][C]-0.014885[/C][C]-0.1153[/C][C]0.454298[/C][/ROW]
[ROW][C]18[/C][C]-0.190333[/C][C]-1.4743[/C][C]0.072812[/C][/ROW]
[ROW][C]19[/C][C]0.028012[/C][C]0.217[/C][C]0.414479[/C][/ROW]
[ROW][C]20[/C][C]0.104329[/C][C]0.8081[/C][C]0.211104[/C][/ROW]
[ROW][C]21[/C][C]-0.114593[/C][C]-0.8876[/C][C]0.189142[/C][/ROW]
[ROW][C]22[/C][C]-0.070907[/C][C]-0.5492[/C][C]0.292438[/C][/ROW]
[ROW][C]23[/C][C]-0.036329[/C][C]-0.2814[/C][C]0.389685[/C][/ROW]
[ROW][C]24[/C][C]-0.105334[/C][C]-0.8159[/C][C]0.208887[/C][/ROW]
[ROW][C]25[/C][C]-0.180926[/C][C]-1.4014[/C][C]0.083117[/C][/ROW]
[ROW][C]26[/C][C]0.100418[/C][C]0.7778[/C][C]0.219861[/C][/ROW]
[ROW][C]27[/C][C]-0.056603[/C][C]-0.4384[/C][C]0.331319[/C][/ROW]
[ROW][C]28[/C][C]0.000455[/C][C]0.0035[/C][C]0.498598[/C][/ROW]
[ROW][C]29[/C][C]0.038209[/C][C]0.296[/C][C]0.38414[/C][/ROW]
[ROW][C]30[/C][C]-0.013069[/C][C]-0.1012[/C][C]0.459851[/C][/ROW]
[ROW][C]31[/C][C]-0.001192[/C][C]-0.0092[/C][C]0.496333[/C][/ROW]
[ROW][C]32[/C][C]0.019189[/C][C]0.1486[/C][C]0.441169[/C][/ROW]
[ROW][C]33[/C][C]-0.045991[/C][C]-0.3562[/C][C]0.361455[/C][/ROW]
[ROW][C]34[/C][C]-0.001887[/C][C]-0.0146[/C][C]0.494192[/C][/ROW]
[ROW][C]35[/C][C]-0.055129[/C][C]-0.427[/C][C]0.335444[/C][/ROW]
[ROW][C]36[/C][C]0.017744[/C][C]0.1374[/C][C]0.445571[/C][/ROW]
[ROW][C]37[/C][C]-0.062199[/C][C]-0.4818[/C][C]0.315854[/C][/ROW]
[ROW][C]38[/C][C]-0.101015[/C][C]-0.7825[/C][C]0.218512[/C][/ROW]
[ROW][C]39[/C][C]0.07621[/C][C]0.5903[/C][C]0.278596[/C][/ROW]
[ROW][C]40[/C][C]-0.11403[/C][C]-0.8833[/C][C]0.190307[/C][/ROW]
[ROW][C]41[/C][C]-0.025006[/C][C]-0.1937[/C][C]0.423535[/C][/ROW]
[ROW][C]42[/C][C]-0.093192[/C][C]-0.7219[/C][C]0.236593[/C][/ROW]
[ROW][C]43[/C][C]0.014875[/C][C]0.1152[/C][C]0.454327[/C][/ROW]
[ROW][C]44[/C][C]-0.013492[/C][C]-0.1045[/C][C]0.458557[/C][/ROW]
[ROW][C]45[/C][C]0.009791[/C][C]0.0758[/C][C]0.469898[/C][/ROW]
[ROW][C]46[/C][C]-0.098987[/C][C]-0.7667[/C][C]0.223119[/C][/ROW]
[ROW][C]47[/C][C]-0.042968[/C][C]-0.3328[/C][C]0.370212[/C][/ROW]
[ROW][C]48[/C][C]-0.003848[/C][C]-0.0298[/C][C]0.48816[/C][/ROW]
[/TABLE]
Source: https://freestatistics.org/blog/index.php?pk=&T=2

Globally Unique Identifier (entire table): ba.freestatistics.org/blog/index.php?pk=&T=2

As an alternative you can also use a QR Code:  

The GUIDs for individual cells are displayed in the table below:

Partial Autocorrelation Function
Time lag kPACF(k)T-STATP-value
10.8778946.80010
2-0.373447-2.89270.002657
3-0.175633-1.36040.089388
40.0897920.69550.244705
5-0.053038-0.41080.341332
6-0.134093-1.03870.15156
7-0.171904-1.33160.094021
80.0724710.56140.288323
9-0.026861-0.20810.417941
100.1342781.04010.15123
110.0587770.45530.325273
120.0020980.01630.493543
13-0.208837-1.61760.055493
14-0.156348-1.21110.11531
15-0.084262-0.65270.258225
16-0.061545-0.47670.317643
17-0.014885-0.11530.454298
18-0.190333-1.47430.072812
190.0280120.2170.414479
200.1043290.80810.211104
21-0.114593-0.88760.189142
22-0.070907-0.54920.292438
23-0.036329-0.28140.389685
24-0.105334-0.81590.208887
25-0.180926-1.40140.083117
260.1004180.77780.219861
27-0.056603-0.43840.331319
280.0004550.00350.498598
290.0382090.2960.38414
30-0.013069-0.10120.459851
31-0.001192-0.00920.496333
320.0191890.14860.441169
33-0.045991-0.35620.361455
34-0.001887-0.01460.494192
35-0.055129-0.4270.335444
360.0177440.13740.445571
37-0.062199-0.48180.315854
38-0.101015-0.78250.218512
390.076210.59030.278596
40-0.11403-0.88330.190307
41-0.025006-0.19370.423535
42-0.093192-0.72190.236593
430.0148750.11520.454327
44-0.013492-0.10450.458557
450.0097910.07580.469898
46-0.098987-0.76670.223119
47-0.042968-0.33280.370212
48-0.003848-0.02980.48816


Parameters (Session):
par1 = 48 ; par2 = 1 ; par3 = 0 ; par4 = 0 ; par5 = 12 ; par6 = White Noise ; par7 = 0.95 ;
Parameters (R input):
par1 = 48 ; par2 = 1 ; par3 = 0 ; par4 = 0 ; par5 = 12 ; par6 = White Noise ; par7 = 0.95 ; par8 = ;
R code (references can be found in the software module):
if (par1 == 'Default') {
par1 = 10*log10(length(x))
} else {
par1 <- as.numeric(par1)
}
par2 <- as.numeric(par2)
par3 <- as.numeric(par3)
par4 <- as.numeric(par4)
par5 <- as.numeric(par5)
if (par6 == 'White Noise') par6 <- 'white' else par6 <- 'ma'
par7 <- as.numeric(par7)
if (par8 != '') par8 <- as.numeric(par8)
x <- na.omit(x)
ox <- x
if (par8 == '') {
if (par2 == 0) {
x <- log(x)
} else {
x <- (x ^ par2 - 1) / par2
}
} else {
x <- log(x,base=par8)
}
if (par3 > 0) x <- diff(x,lag=1,difference=par3)
if (par4 > 0) x <- diff(x,lag=par5,difference=par4)
bitmap(file='picts.png')
op <- par(mfrow=c(2,1))
plot(ox,type='l',main='Original Time Series',xlab='time',ylab='value')
if (par8=='') {
mytitle <- paste('Working Time Series (lambda=',par2,', d=',par3,', D=',par4,')',sep='')
mysub <- paste('(lambda=',par2,', d=',par3,', D=',par4,', CI=', par7, ', CI type=',par6,')',sep='')
} else {
mytitle <- paste('Working Time Series (base=',par8,', d=',par3,', D=',par4,')',sep='')
mysub <- paste('(base=',par8,', d=',par3,', D=',par4,', CI=', par7, ', CI type=',par6,')',sep='')
}
plot(x,type='l', main=mytitle,xlab='time',ylab='value')
par(op)
dev.off()
bitmap(file='pic1.png')
racf <- acf(x, par1, main='Autocorrelation', xlab='time lag', ylab='ACF', ci.type=par6, ci=par7, sub=mysub)
dev.off()
bitmap(file='pic2.png')
rpacf <- pacf(x,par1,main='Partial Autocorrelation',xlab='lags',ylab='PACF',sub=mysub)
dev.off()
(myacf <- c(racf$acf))
(mypacf <- c(rpacf$acf))
lengthx <- length(x)
sqrtn <- sqrt(lengthx)
load(file='createtable')
a<-table.start()
a<-table.row.start(a)
a<-table.element(a,'Autocorrelation Function',4,TRUE)
a<-table.row.end(a)
a<-table.row.start(a)
a<-table.element(a,'Time lag k',header=TRUE)
a<-table.element(a,hyperlink('basics.htm','ACF(k)','click here for more information about the Autocorrelation Function'),header=TRUE)
a<-table.element(a,'T-STAT',header=TRUE)
a<-table.element(a,'P-value',header=TRUE)
a<-table.row.end(a)
for (i in 2:(par1+1)) {
a<-table.row.start(a)
a<-table.element(a,i-1,header=TRUE)
a<-table.element(a,round(myacf[i],6))
mytstat <- myacf[i]*sqrtn
a<-table.element(a,round(mytstat,4))
a<-table.element(a,round(1-pt(abs(mytstat),lengthx),6))
a<-table.row.end(a)
}
a<-table.end(a)
table.save(a,file='mytable.tab')
a<-table.start()
a<-table.row.start(a)
a<-table.element(a,'Partial Autocorrelation Function',4,TRUE)
a<-table.row.end(a)
a<-table.row.start(a)
a<-table.element(a,'Time lag k',header=TRUE)
a<-table.element(a,hyperlink('basics.htm','PACF(k)','click here for more information about the Partial Autocorrelation Function'),header=TRUE)
a<-table.element(a,'T-STAT',header=TRUE)
a<-table.element(a,'P-value',header=TRUE)
a<-table.row.end(a)
for (i in 1:par1) {
a<-table.row.start(a)
a<-table.element(a,i,header=TRUE)
a<-table.element(a,round(mypacf[i],6))
mytstat <- mypacf[i]*sqrtn
a<-table.element(a,round(mytstat,4))
a<-table.element(a,round(1-pt(abs(mytstat),lengthx),6))
a<-table.row.end(a)
}
a<-table.end(a)
table.save(a,file='mytable1.tab')