Free Statistics

of Irreproducible Research!

Author's title

Author*Unverified author*
R Software Modulerwasp_autocorrelation.wasp
Title produced by software(Partial) Autocorrelation Function
Date of computationWed, 19 Oct 2016 14:10:19 +0100
Cite this page as followsStatistical Computations at FreeStatistics.org, Office for Research Development and Education, URL https://freestatistics.org/blog/index.php?v=date/2016/Oct/19/t14768829341rb0i5s4mm7p3ui.htm/, Retrieved Tue, 30 Apr 2024 07:34:44 +0200
Statistical Computations at FreeStatistics.org, Office for Research Development and Education, URL https://freestatistics.org/blog/index.php?pk=, Retrieved Tue, 30 Apr 2024 07:34:44 +0200
QR Codes:

Original text written by user:
IsPrivate?No (this computation is public)
User-defined keywords
Estimated Impact0
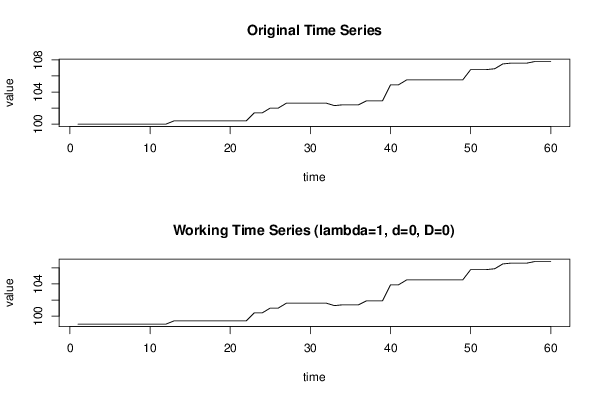
Dataseries X:
100
100
100
100
100
100
100
100
100
100
100
100
100,4
100,4
100,4
100,4
100,4
100,4
100,4
100,4
100,4
100,4
101,4
101,4
102
102
102,6
102,6
102,6
102,6
102,6
102,6
102,3
102,4
102,4
102,4
102,9
102,9
102,9
104,9
104,9
105,5
105,5
105,5
105,5
105,5
105,5
105,5
105,5
106,8
106,8
106,8
106,9
107,5
107,6
107,6
107,6
107,8
107,8
107,8


Summary of computational transaction
Raw Inputview raw input (R code)
Raw Outputview raw output of R engine
Computing time1 seconds
R Server'George Udny Yule' @ yule.wessa.net

\begin{tabular}{lllllllll}
\hline
Summary of computational transaction \tabularnewline
Raw Input & view raw input (R code)  \tabularnewline
Raw Output & view raw output of R engine  \tabularnewline
Computing time & 1 seconds \tabularnewline
R Server & 'George Udny Yule' @ yule.wessa.net \tabularnewline
\hline
\end{tabular}
%Source: https://freestatistics.org/blog/index.php?pk=&T=0

[TABLE]
[ROW][C]Summary of computational transaction[/C][/ROW]
[ROW][C]Raw Input[/C][C]view raw input (R code) [/C][/ROW]
[ROW][C]Raw Output[/C][C]view raw output of R engine [/C][/ROW]
[ROW][C]Computing time[/C][C]1 seconds[/C][/ROW]
[ROW][C]R Server[/C][C]'George Udny Yule' @ yule.wessa.net[/C][/ROW]
[/TABLE]
Source: https://freestatistics.org/blog/index.php?pk=&T=0

Globally Unique Identifier (entire table): ba.freestatistics.org/blog/index.php?pk=&T=0

As an alternative you can also use a QR Code:  

The GUIDs for individual cells are displayed in the table below:

Summary of computational transaction
Raw Inputview raw input (R code)
Raw Outputview raw output of R engine
Computing time1 seconds
R Server'George Udny Yule' @ yule.wessa.net


Autocorrelation Function
Time lag kACF(k)T-STATP-value
10.955087.3980
20.9099617.04850
30.8600626.6620
40.8096386.27140
50.756245.85780
60.701855.43651e-06
70.6484765.02312e-06
80.602654.66819e-06
90.5558574.30573.1e-05
100.5093293.94520.000106
110.456193.53360.000398
120.4164763.2260.001017
130.3774152.92340.002438
140.3337042.58490.006095
150.2857192.21320.01535
160.2338571.81140.037539
170.1813331.40460.082648
180.1238080.9590.170701
190.0652910.50570.307444
200.011790.09130.46377
21-0.041514-0.32160.37445
22-0.073556-0.56980.285483
23-0.098944-0.76640.223216
24-0.126051-0.97640.166396
25-0.144391-1.11850.133916
26-0.164318-1.27280.103999
27-0.180424-1.39760.083696
28-0.20089-1.55610.062473
29-0.2248-1.74130.043379
30-0.250032-1.93670.028745
31-0.275616-2.13490.018431
32-0.302787-2.34540.011166
33-0.332155-2.57290.006289
34-0.361128-2.79730.003458
35-0.383742-2.97250.002124
36-0.406797-3.1510.001269
37-0.4202-3.25490.000933
38-0.434748-3.36750.000664
39-0.438699-3.39810.000605
40-0.429474-3.32670.000752
41-0.420337-3.25590.00093
42-0.407777-3.15860.001241
43-0.395304-3.0620.001644
44-0.382832-2.96540.002167
45-0.370359-2.86880.00284
46-0.358063-2.77350.003689
47-0.345767-2.67830.004766
48-0.333471-2.58310.006124

\begin{tabular}{lllllllll}
\hline
Autocorrelation Function \tabularnewline
Time lag k & ACF(k) & T-STAT & P-value \tabularnewline
1 & 0.95508 & 7.398 & 0 \tabularnewline
2 & 0.909961 & 7.0485 & 0 \tabularnewline
3 & 0.860062 & 6.662 & 0 \tabularnewline
4 & 0.809638 & 6.2714 & 0 \tabularnewline
5 & 0.75624 & 5.8578 & 0 \tabularnewline
6 & 0.70185 & 5.4365 & 1e-06 \tabularnewline
7 & 0.648476 & 5.0231 & 2e-06 \tabularnewline
8 & 0.60265 & 4.6681 & 9e-06 \tabularnewline
9 & 0.555857 & 4.3057 & 3.1e-05 \tabularnewline
10 & 0.509329 & 3.9452 & 0.000106 \tabularnewline
11 & 0.45619 & 3.5336 & 0.000398 \tabularnewline
12 & 0.416476 & 3.226 & 0.001017 \tabularnewline
13 & 0.377415 & 2.9234 & 0.002438 \tabularnewline
14 & 0.333704 & 2.5849 & 0.006095 \tabularnewline
15 & 0.285719 & 2.2132 & 0.01535 \tabularnewline
16 & 0.233857 & 1.8114 & 0.037539 \tabularnewline
17 & 0.181333 & 1.4046 & 0.082648 \tabularnewline
18 & 0.123808 & 0.959 & 0.170701 \tabularnewline
19 & 0.065291 & 0.5057 & 0.307444 \tabularnewline
20 & 0.01179 & 0.0913 & 0.46377 \tabularnewline
21 & -0.041514 & -0.3216 & 0.37445 \tabularnewline
22 & -0.073556 & -0.5698 & 0.285483 \tabularnewline
23 & -0.098944 & -0.7664 & 0.223216 \tabularnewline
24 & -0.126051 & -0.9764 & 0.166396 \tabularnewline
25 & -0.144391 & -1.1185 & 0.133916 \tabularnewline
26 & -0.164318 & -1.2728 & 0.103999 \tabularnewline
27 & -0.180424 & -1.3976 & 0.083696 \tabularnewline
28 & -0.20089 & -1.5561 & 0.062473 \tabularnewline
29 & -0.2248 & -1.7413 & 0.043379 \tabularnewline
30 & -0.250032 & -1.9367 & 0.028745 \tabularnewline
31 & -0.275616 & -2.1349 & 0.018431 \tabularnewline
32 & -0.302787 & -2.3454 & 0.011166 \tabularnewline
33 & -0.332155 & -2.5729 & 0.006289 \tabularnewline
34 & -0.361128 & -2.7973 & 0.003458 \tabularnewline
35 & -0.383742 & -2.9725 & 0.002124 \tabularnewline
36 & -0.406797 & -3.151 & 0.001269 \tabularnewline
37 & -0.4202 & -3.2549 & 0.000933 \tabularnewline
38 & -0.434748 & -3.3675 & 0.000664 \tabularnewline
39 & -0.438699 & -3.3981 & 0.000605 \tabularnewline
40 & -0.429474 & -3.3267 & 0.000752 \tabularnewline
41 & -0.420337 & -3.2559 & 0.00093 \tabularnewline
42 & -0.407777 & -3.1586 & 0.001241 \tabularnewline
43 & -0.395304 & -3.062 & 0.001644 \tabularnewline
44 & -0.382832 & -2.9654 & 0.002167 \tabularnewline
45 & -0.370359 & -2.8688 & 0.00284 \tabularnewline
46 & -0.358063 & -2.7735 & 0.003689 \tabularnewline
47 & -0.345767 & -2.6783 & 0.004766 \tabularnewline
48 & -0.333471 & -2.5831 & 0.006124 \tabularnewline
\hline
\end{tabular}
%Source: https://freestatistics.org/blog/index.php?pk=&T=1

[TABLE]
[ROW][C]Autocorrelation Function[/C][/ROW]
[ROW][C]Time lag k[/C][C]ACF(k)[/C][C]T-STAT[/C][C]P-value[/C][/ROW]
[ROW][C]1[/C][C]0.95508[/C][C]7.398[/C][C]0[/C][/ROW]
[ROW][C]2[/C][C]0.909961[/C][C]7.0485[/C][C]0[/C][/ROW]
[ROW][C]3[/C][C]0.860062[/C][C]6.662[/C][C]0[/C][/ROW]
[ROW][C]4[/C][C]0.809638[/C][C]6.2714[/C][C]0[/C][/ROW]
[ROW][C]5[/C][C]0.75624[/C][C]5.8578[/C][C]0[/C][/ROW]
[ROW][C]6[/C][C]0.70185[/C][C]5.4365[/C][C]1e-06[/C][/ROW]
[ROW][C]7[/C][C]0.648476[/C][C]5.0231[/C][C]2e-06[/C][/ROW]
[ROW][C]8[/C][C]0.60265[/C][C]4.6681[/C][C]9e-06[/C][/ROW]
[ROW][C]9[/C][C]0.555857[/C][C]4.3057[/C][C]3.1e-05[/C][/ROW]
[ROW][C]10[/C][C]0.509329[/C][C]3.9452[/C][C]0.000106[/C][/ROW]
[ROW][C]11[/C][C]0.45619[/C][C]3.5336[/C][C]0.000398[/C][/ROW]
[ROW][C]12[/C][C]0.416476[/C][C]3.226[/C][C]0.001017[/C][/ROW]
[ROW][C]13[/C][C]0.377415[/C][C]2.9234[/C][C]0.002438[/C][/ROW]
[ROW][C]14[/C][C]0.333704[/C][C]2.5849[/C][C]0.006095[/C][/ROW]
[ROW][C]15[/C][C]0.285719[/C][C]2.2132[/C][C]0.01535[/C][/ROW]
[ROW][C]16[/C][C]0.233857[/C][C]1.8114[/C][C]0.037539[/C][/ROW]
[ROW][C]17[/C][C]0.181333[/C][C]1.4046[/C][C]0.082648[/C][/ROW]
[ROW][C]18[/C][C]0.123808[/C][C]0.959[/C][C]0.170701[/C][/ROW]
[ROW][C]19[/C][C]0.065291[/C][C]0.5057[/C][C]0.307444[/C][/ROW]
[ROW][C]20[/C][C]0.01179[/C][C]0.0913[/C][C]0.46377[/C][/ROW]
[ROW][C]21[/C][C]-0.041514[/C][C]-0.3216[/C][C]0.37445[/C][/ROW]
[ROW][C]22[/C][C]-0.073556[/C][C]-0.5698[/C][C]0.285483[/C][/ROW]
[ROW][C]23[/C][C]-0.098944[/C][C]-0.7664[/C][C]0.223216[/C][/ROW]
[ROW][C]24[/C][C]-0.126051[/C][C]-0.9764[/C][C]0.166396[/C][/ROW]
[ROW][C]25[/C][C]-0.144391[/C][C]-1.1185[/C][C]0.133916[/C][/ROW]
[ROW][C]26[/C][C]-0.164318[/C][C]-1.2728[/C][C]0.103999[/C][/ROW]
[ROW][C]27[/C][C]-0.180424[/C][C]-1.3976[/C][C]0.083696[/C][/ROW]
[ROW][C]28[/C][C]-0.20089[/C][C]-1.5561[/C][C]0.062473[/C][/ROW]
[ROW][C]29[/C][C]-0.2248[/C][C]-1.7413[/C][C]0.043379[/C][/ROW]
[ROW][C]30[/C][C]-0.250032[/C][C]-1.9367[/C][C]0.028745[/C][/ROW]
[ROW][C]31[/C][C]-0.275616[/C][C]-2.1349[/C][C]0.018431[/C][/ROW]
[ROW][C]32[/C][C]-0.302787[/C][C]-2.3454[/C][C]0.011166[/C][/ROW]
[ROW][C]33[/C][C]-0.332155[/C][C]-2.5729[/C][C]0.006289[/C][/ROW]
[ROW][C]34[/C][C]-0.361128[/C][C]-2.7973[/C][C]0.003458[/C][/ROW]
[ROW][C]35[/C][C]-0.383742[/C][C]-2.9725[/C][C]0.002124[/C][/ROW]
[ROW][C]36[/C][C]-0.406797[/C][C]-3.151[/C][C]0.001269[/C][/ROW]
[ROW][C]37[/C][C]-0.4202[/C][C]-3.2549[/C][C]0.000933[/C][/ROW]
[ROW][C]38[/C][C]-0.434748[/C][C]-3.3675[/C][C]0.000664[/C][/ROW]
[ROW][C]39[/C][C]-0.438699[/C][C]-3.3981[/C][C]0.000605[/C][/ROW]
[ROW][C]40[/C][C]-0.429474[/C][C]-3.3267[/C][C]0.000752[/C][/ROW]
[ROW][C]41[/C][C]-0.420337[/C][C]-3.2559[/C][C]0.00093[/C][/ROW]
[ROW][C]42[/C][C]-0.407777[/C][C]-3.1586[/C][C]0.001241[/C][/ROW]
[ROW][C]43[/C][C]-0.395304[/C][C]-3.062[/C][C]0.001644[/C][/ROW]
[ROW][C]44[/C][C]-0.382832[/C][C]-2.9654[/C][C]0.002167[/C][/ROW]
[ROW][C]45[/C][C]-0.370359[/C][C]-2.8688[/C][C]0.00284[/C][/ROW]
[ROW][C]46[/C][C]-0.358063[/C][C]-2.7735[/C][C]0.003689[/C][/ROW]
[ROW][C]47[/C][C]-0.345767[/C][C]-2.6783[/C][C]0.004766[/C][/ROW]
[ROW][C]48[/C][C]-0.333471[/C][C]-2.5831[/C][C]0.006124[/C][/ROW]
[/TABLE]
Source: https://freestatistics.org/blog/index.php?pk=&T=1

Globally Unique Identifier (entire table): ba.freestatistics.org/blog/index.php?pk=&T=1

As an alternative you can also use a QR Code:  

The GUIDs for individual cells are displayed in the table below:

Autocorrelation Function
Time lag kACF(k)T-STATP-value
10.955087.3980
20.9099617.04850
30.8600626.6620
40.8096386.27140
50.756245.85780
60.701855.43651e-06
70.6484765.02312e-06
80.602654.66819e-06
90.5558574.30573.1e-05
100.5093293.94520.000106
110.456193.53360.000398
120.4164763.2260.001017
130.3774152.92340.002438
140.3337042.58490.006095
150.2857192.21320.01535
160.2338571.81140.037539
170.1813331.40460.082648
180.1238080.9590.170701
190.0652910.50570.307444
200.011790.09130.46377
21-0.041514-0.32160.37445
22-0.073556-0.56980.285483
23-0.098944-0.76640.223216
24-0.126051-0.97640.166396
25-0.144391-1.11850.133916
26-0.164318-1.27280.103999
27-0.180424-1.39760.083696
28-0.20089-1.55610.062473
29-0.2248-1.74130.043379
30-0.250032-1.93670.028745
31-0.275616-2.13490.018431
32-0.302787-2.34540.011166
33-0.332155-2.57290.006289
34-0.361128-2.79730.003458
35-0.383742-2.97250.002124
36-0.406797-3.1510.001269
37-0.4202-3.25490.000933
38-0.434748-3.36750.000664
39-0.438699-3.39810.000605
40-0.429474-3.32670.000752
41-0.420337-3.25590.00093
42-0.407777-3.15860.001241
43-0.395304-3.0620.001644
44-0.382832-2.96540.002167
45-0.370359-2.86880.00284
46-0.358063-2.77350.003689
47-0.345767-2.67830.004766
48-0.333471-2.58310.006124


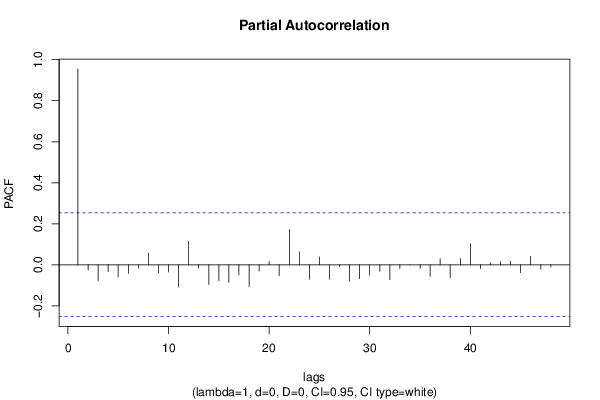
Partial Autocorrelation Function
Time lag kPACF(k)T-STATP-value
10.955087.3980
2-0.025234-0.19550.422846
3-0.078093-0.60490.273762
4-0.032763-0.25380.400265
5-0.05925-0.4590.323964
6-0.041406-0.32070.374765
7-0.017163-0.13290.447341
80.0561160.43470.33268
9-0.039683-0.30740.379807
10-0.035206-0.27270.393008
11-0.108265-0.83860.202505
120.1148220.88940.188668
13-0.015606-0.12090.452095
14-0.096312-0.7460.229282
15-0.076798-0.59490.277082
16-0.085423-0.66170.255354
17-0.050128-0.38830.349587
18-0.106196-0.82260.206999
19-0.031031-0.24040.405433
200.0156650.12130.451914
21-0.053445-0.4140.340182
220.1724961.33610.093274
230.0621630.48150.315953
24-0.069946-0.54180.294982
250.0383390.2970.383758
26-0.070071-0.54280.29465
27-0.007706-0.05970.476301
28-0.080083-0.62030.268697
29-0.068482-0.53050.298876
30-0.050736-0.3930.347856
31-0.031931-0.24730.402747
32-0.072487-0.56150.288279
33-0.018186-0.14090.444222
340.0001340.0010.499586
35-0.017079-0.13230.447596
36-0.05635-0.43650.332027
370.0300360.23270.408409
38-0.062019-0.48040.316346
390.0302480.23430.407774
400.1029420.79740.214185
41-0.01837-0.14230.443664
420.0100350.07770.469149
430.0141420.10950.456569
440.0169540.13130.447978
45-0.038331-0.29690.383779
460.040.30980.37888
47-0.022308-0.17280.431696
48-0.01113-0.08620.465793

\begin{tabular}{lllllllll}
\hline
Partial Autocorrelation Function \tabularnewline
Time lag k & PACF(k) & T-STAT & P-value \tabularnewline
1 & 0.95508 & 7.398 & 0 \tabularnewline
2 & -0.025234 & -0.1955 & 0.422846 \tabularnewline
3 & -0.078093 & -0.6049 & 0.273762 \tabularnewline
4 & -0.032763 & -0.2538 & 0.400265 \tabularnewline
5 & -0.05925 & -0.459 & 0.323964 \tabularnewline
6 & -0.041406 & -0.3207 & 0.374765 \tabularnewline
7 & -0.017163 & -0.1329 & 0.447341 \tabularnewline
8 & 0.056116 & 0.4347 & 0.33268 \tabularnewline
9 & -0.039683 & -0.3074 & 0.379807 \tabularnewline
10 & -0.035206 & -0.2727 & 0.393008 \tabularnewline
11 & -0.108265 & -0.8386 & 0.202505 \tabularnewline
12 & 0.114822 & 0.8894 & 0.188668 \tabularnewline
13 & -0.015606 & -0.1209 & 0.452095 \tabularnewline
14 & -0.096312 & -0.746 & 0.229282 \tabularnewline
15 & -0.076798 & -0.5949 & 0.277082 \tabularnewline
16 & -0.085423 & -0.6617 & 0.255354 \tabularnewline
17 & -0.050128 & -0.3883 & 0.349587 \tabularnewline
18 & -0.106196 & -0.8226 & 0.206999 \tabularnewline
19 & -0.031031 & -0.2404 & 0.405433 \tabularnewline
20 & 0.015665 & 0.1213 & 0.451914 \tabularnewline
21 & -0.053445 & -0.414 & 0.340182 \tabularnewline
22 & 0.172496 & 1.3361 & 0.093274 \tabularnewline
23 & 0.062163 & 0.4815 & 0.315953 \tabularnewline
24 & -0.069946 & -0.5418 & 0.294982 \tabularnewline
25 & 0.038339 & 0.297 & 0.383758 \tabularnewline
26 & -0.070071 & -0.5428 & 0.29465 \tabularnewline
27 & -0.007706 & -0.0597 & 0.476301 \tabularnewline
28 & -0.080083 & -0.6203 & 0.268697 \tabularnewline
29 & -0.068482 & -0.5305 & 0.298876 \tabularnewline
30 & -0.050736 & -0.393 & 0.347856 \tabularnewline
31 & -0.031931 & -0.2473 & 0.402747 \tabularnewline
32 & -0.072487 & -0.5615 & 0.288279 \tabularnewline
33 & -0.018186 & -0.1409 & 0.444222 \tabularnewline
34 & 0.000134 & 0.001 & 0.499586 \tabularnewline
35 & -0.017079 & -0.1323 & 0.447596 \tabularnewline
36 & -0.05635 & -0.4365 & 0.332027 \tabularnewline
37 & 0.030036 & 0.2327 & 0.408409 \tabularnewline
38 & -0.062019 & -0.4804 & 0.316346 \tabularnewline
39 & 0.030248 & 0.2343 & 0.407774 \tabularnewline
40 & 0.102942 & 0.7974 & 0.214185 \tabularnewline
41 & -0.01837 & -0.1423 & 0.443664 \tabularnewline
42 & 0.010035 & 0.0777 & 0.469149 \tabularnewline
43 & 0.014142 & 0.1095 & 0.456569 \tabularnewline
44 & 0.016954 & 0.1313 & 0.447978 \tabularnewline
45 & -0.038331 & -0.2969 & 0.383779 \tabularnewline
46 & 0.04 & 0.3098 & 0.37888 \tabularnewline
47 & -0.022308 & -0.1728 & 0.431696 \tabularnewline
48 & -0.01113 & -0.0862 & 0.465793 \tabularnewline
\hline
\end{tabular}
%Source: https://freestatistics.org/blog/index.php?pk=&T=2

[TABLE]
[ROW][C]Partial Autocorrelation Function[/C][/ROW]
[ROW][C]Time lag k[/C][C]PACF(k)[/C][C]T-STAT[/C][C]P-value[/C][/ROW]
[ROW][C]1[/C][C]0.95508[/C][C]7.398[/C][C]0[/C][/ROW]
[ROW][C]2[/C][C]-0.025234[/C][C]-0.1955[/C][C]0.422846[/C][/ROW]
[ROW][C]3[/C][C]-0.078093[/C][C]-0.6049[/C][C]0.273762[/C][/ROW]
[ROW][C]4[/C][C]-0.032763[/C][C]-0.2538[/C][C]0.400265[/C][/ROW]
[ROW][C]5[/C][C]-0.05925[/C][C]-0.459[/C][C]0.323964[/C][/ROW]
[ROW][C]6[/C][C]-0.041406[/C][C]-0.3207[/C][C]0.374765[/C][/ROW]
[ROW][C]7[/C][C]-0.017163[/C][C]-0.1329[/C][C]0.447341[/C][/ROW]
[ROW][C]8[/C][C]0.056116[/C][C]0.4347[/C][C]0.33268[/C][/ROW]
[ROW][C]9[/C][C]-0.039683[/C][C]-0.3074[/C][C]0.379807[/C][/ROW]
[ROW][C]10[/C][C]-0.035206[/C][C]-0.2727[/C][C]0.393008[/C][/ROW]
[ROW][C]11[/C][C]-0.108265[/C][C]-0.8386[/C][C]0.202505[/C][/ROW]
[ROW][C]12[/C][C]0.114822[/C][C]0.8894[/C][C]0.188668[/C][/ROW]
[ROW][C]13[/C][C]-0.015606[/C][C]-0.1209[/C][C]0.452095[/C][/ROW]
[ROW][C]14[/C][C]-0.096312[/C][C]-0.746[/C][C]0.229282[/C][/ROW]
[ROW][C]15[/C][C]-0.076798[/C][C]-0.5949[/C][C]0.277082[/C][/ROW]
[ROW][C]16[/C][C]-0.085423[/C][C]-0.6617[/C][C]0.255354[/C][/ROW]
[ROW][C]17[/C][C]-0.050128[/C][C]-0.3883[/C][C]0.349587[/C][/ROW]
[ROW][C]18[/C][C]-0.106196[/C][C]-0.8226[/C][C]0.206999[/C][/ROW]
[ROW][C]19[/C][C]-0.031031[/C][C]-0.2404[/C][C]0.405433[/C][/ROW]
[ROW][C]20[/C][C]0.015665[/C][C]0.1213[/C][C]0.451914[/C][/ROW]
[ROW][C]21[/C][C]-0.053445[/C][C]-0.414[/C][C]0.340182[/C][/ROW]
[ROW][C]22[/C][C]0.172496[/C][C]1.3361[/C][C]0.093274[/C][/ROW]
[ROW][C]23[/C][C]0.062163[/C][C]0.4815[/C][C]0.315953[/C][/ROW]
[ROW][C]24[/C][C]-0.069946[/C][C]-0.5418[/C][C]0.294982[/C][/ROW]
[ROW][C]25[/C][C]0.038339[/C][C]0.297[/C][C]0.383758[/C][/ROW]
[ROW][C]26[/C][C]-0.070071[/C][C]-0.5428[/C][C]0.29465[/C][/ROW]
[ROW][C]27[/C][C]-0.007706[/C][C]-0.0597[/C][C]0.476301[/C][/ROW]
[ROW][C]28[/C][C]-0.080083[/C][C]-0.6203[/C][C]0.268697[/C][/ROW]
[ROW][C]29[/C][C]-0.068482[/C][C]-0.5305[/C][C]0.298876[/C][/ROW]
[ROW][C]30[/C][C]-0.050736[/C][C]-0.393[/C][C]0.347856[/C][/ROW]
[ROW][C]31[/C][C]-0.031931[/C][C]-0.2473[/C][C]0.402747[/C][/ROW]
[ROW][C]32[/C][C]-0.072487[/C][C]-0.5615[/C][C]0.288279[/C][/ROW]
[ROW][C]33[/C][C]-0.018186[/C][C]-0.1409[/C][C]0.444222[/C][/ROW]
[ROW][C]34[/C][C]0.000134[/C][C]0.001[/C][C]0.499586[/C][/ROW]
[ROW][C]35[/C][C]-0.017079[/C][C]-0.1323[/C][C]0.447596[/C][/ROW]
[ROW][C]36[/C][C]-0.05635[/C][C]-0.4365[/C][C]0.332027[/C][/ROW]
[ROW][C]37[/C][C]0.030036[/C][C]0.2327[/C][C]0.408409[/C][/ROW]
[ROW][C]38[/C][C]-0.062019[/C][C]-0.4804[/C][C]0.316346[/C][/ROW]
[ROW][C]39[/C][C]0.030248[/C][C]0.2343[/C][C]0.407774[/C][/ROW]
[ROW][C]40[/C][C]0.102942[/C][C]0.7974[/C][C]0.214185[/C][/ROW]
[ROW][C]41[/C][C]-0.01837[/C][C]-0.1423[/C][C]0.443664[/C][/ROW]
[ROW][C]42[/C][C]0.010035[/C][C]0.0777[/C][C]0.469149[/C][/ROW]
[ROW][C]43[/C][C]0.014142[/C][C]0.1095[/C][C]0.456569[/C][/ROW]
[ROW][C]44[/C][C]0.016954[/C][C]0.1313[/C][C]0.447978[/C][/ROW]
[ROW][C]45[/C][C]-0.038331[/C][C]-0.2969[/C][C]0.383779[/C][/ROW]
[ROW][C]46[/C][C]0.04[/C][C]0.3098[/C][C]0.37888[/C][/ROW]
[ROW][C]47[/C][C]-0.022308[/C][C]-0.1728[/C][C]0.431696[/C][/ROW]
[ROW][C]48[/C][C]-0.01113[/C][C]-0.0862[/C][C]0.465793[/C][/ROW]
[/TABLE]
Source: https://freestatistics.org/blog/index.php?pk=&T=2

Globally Unique Identifier (entire table): ba.freestatistics.org/blog/index.php?pk=&T=2

As an alternative you can also use a QR Code:  

The GUIDs for individual cells are displayed in the table below:

Partial Autocorrelation Function
Time lag kPACF(k)T-STATP-value
10.955087.3980
2-0.025234-0.19550.422846
3-0.078093-0.60490.273762
4-0.032763-0.25380.400265
5-0.05925-0.4590.323964
6-0.041406-0.32070.374765
7-0.017163-0.13290.447341
80.0561160.43470.33268
9-0.039683-0.30740.379807
10-0.035206-0.27270.393008
11-0.108265-0.83860.202505
120.1148220.88940.188668
13-0.015606-0.12090.452095
14-0.096312-0.7460.229282
15-0.076798-0.59490.277082
16-0.085423-0.66170.255354
17-0.050128-0.38830.349587
18-0.106196-0.82260.206999
19-0.031031-0.24040.405433
200.0156650.12130.451914
21-0.053445-0.4140.340182
220.1724961.33610.093274
230.0621630.48150.315953
24-0.069946-0.54180.294982
250.0383390.2970.383758
26-0.070071-0.54280.29465
27-0.007706-0.05970.476301
28-0.080083-0.62030.268697
29-0.068482-0.53050.298876
30-0.050736-0.3930.347856
31-0.031931-0.24730.402747
32-0.072487-0.56150.288279
33-0.018186-0.14090.444222
340.0001340.0010.499586
35-0.017079-0.13230.447596
36-0.05635-0.43650.332027
370.0300360.23270.408409
38-0.062019-0.48040.316346
390.0302480.23430.407774
400.1029420.79740.214185
41-0.01837-0.14230.443664
420.0100350.07770.469149
430.0141420.10950.456569
440.0169540.13130.447978
45-0.038331-0.29690.383779
460.040.30980.37888
47-0.022308-0.17280.431696
48-0.01113-0.08620.465793


Parameters (Session):
par1 = 48 ; par2 = 1 ; par3 = 0 ; par4 = 0 ; par5 = 12 ; par6 = White Noise ; par7 = 0.95 ;
Parameters (R input):
par1 = 48 ; par2 = 1 ; par3 = 0 ; par4 = 0 ; par5 = 12 ; par6 = White Noise ; par7 = 0.95 ; par8 = ;
R code (references can be found in the software module):
if (par1 == 'Default') {
par1 = 10*log10(length(x))
} else {
par1 <- as.numeric(par1)
}
par2 <- as.numeric(par2)
par3 <- as.numeric(par3)
par4 <- as.numeric(par4)
par5 <- as.numeric(par5)
if (par6 == 'White Noise') par6 <- 'white' else par6 <- 'ma'
par7 <- as.numeric(par7)
if (par8 != '') par8 <- as.numeric(par8)
x <- na.omit(x)
ox <- x
if (par8 == '') {
if (par2 == 0) {
x <- log(x)
} else {
x <- (x ^ par2 - 1) / par2
}
} else {
x <- log(x,base=par8)
}
if (par3 > 0) x <- diff(x,lag=1,difference=par3)
if (par4 > 0) x <- diff(x,lag=par5,difference=par4)
bitmap(file='picts.png')
op <- par(mfrow=c(2,1))
plot(ox,type='l',main='Original Time Series',xlab='time',ylab='value')
if (par8=='') {
mytitle <- paste('Working Time Series (lambda=',par2,', d=',par3,', D=',par4,')',sep='')
mysub <- paste('(lambda=',par2,', d=',par3,', D=',par4,', CI=', par7, ', CI type=',par6,')',sep='')
} else {
mytitle <- paste('Working Time Series (base=',par8,', d=',par3,', D=',par4,')',sep='')
mysub <- paste('(base=',par8,', d=',par3,', D=',par4,', CI=', par7, ', CI type=',par6,')',sep='')
}
plot(x,type='l', main=mytitle,xlab='time',ylab='value')
par(op)
dev.off()
bitmap(file='pic1.png')
racf <- acf(x, par1, main='Autocorrelation', xlab='time lag', ylab='ACF', ci.type=par6, ci=par7, sub=mysub)
dev.off()
bitmap(file='pic2.png')
rpacf <- pacf(x,par1,main='Partial Autocorrelation',xlab='lags',ylab='PACF',sub=mysub)
dev.off()
(myacf <- c(racf$acf))
(mypacf <- c(rpacf$acf))
lengthx <- length(x)
sqrtn <- sqrt(lengthx)
load(file='createtable')
a<-table.start()
a<-table.row.start(a)
a<-table.element(a,'Autocorrelation Function',4,TRUE)
a<-table.row.end(a)
a<-table.row.start(a)
a<-table.element(a,'Time lag k',header=TRUE)
a<-table.element(a,hyperlink('basics.htm','ACF(k)','click here for more information about the Autocorrelation Function'),header=TRUE)
a<-table.element(a,'T-STAT',header=TRUE)
a<-table.element(a,'P-value',header=TRUE)
a<-table.row.end(a)
for (i in 2:(par1+1)) {
a<-table.row.start(a)
a<-table.element(a,i-1,header=TRUE)
a<-table.element(a,round(myacf[i],6))
mytstat <- myacf[i]*sqrtn
a<-table.element(a,round(mytstat,4))
a<-table.element(a,round(1-pt(abs(mytstat),lengthx),6))
a<-table.row.end(a)
}
a<-table.end(a)
table.save(a,file='mytable.tab')
a<-table.start()
a<-table.row.start(a)
a<-table.element(a,'Partial Autocorrelation Function',4,TRUE)
a<-table.row.end(a)
a<-table.row.start(a)
a<-table.element(a,'Time lag k',header=TRUE)
a<-table.element(a,hyperlink('basics.htm','PACF(k)','click here for more information about the Partial Autocorrelation Function'),header=TRUE)
a<-table.element(a,'T-STAT',header=TRUE)
a<-table.element(a,'P-value',header=TRUE)
a<-table.row.end(a)
for (i in 1:par1) {
a<-table.row.start(a)
a<-table.element(a,i,header=TRUE)
a<-table.element(a,round(mypacf[i],6))
mytstat <- mypacf[i]*sqrtn
a<-table.element(a,round(mytstat,4))
a<-table.element(a,round(1-pt(abs(mytstat),lengthx),6))
a<-table.row.end(a)
}
a<-table.end(a)
table.save(a,file='mytable1.tab')