Free Statistics

of Irreproducible Research!

Author's title

Author*Unverified author*
R Software Modulerwasp_autocorrelation.wasp
Title produced by software(Partial) Autocorrelation Function
Date of computationWed, 19 Oct 2016 14:23:11 +0100
Cite this page as followsStatistical Computations at FreeStatistics.org, Office for Research Development and Education, URL https://freestatistics.org/blog/index.php?v=date/2016/Oct/19/t1476883641tmjtd8s3z8lu9ds.htm/, Retrieved Tue, 30 Apr 2024 08:10:36 +0200
Statistical Computations at FreeStatistics.org, Office for Research Development and Education, URL https://freestatistics.org/blog/index.php?pk=, Retrieved Tue, 30 Apr 2024 08:10:36 +0200
QR Codes:

Original text written by user:
IsPrivate?No (this computation is public)
User-defined keywords
Estimated Impact0
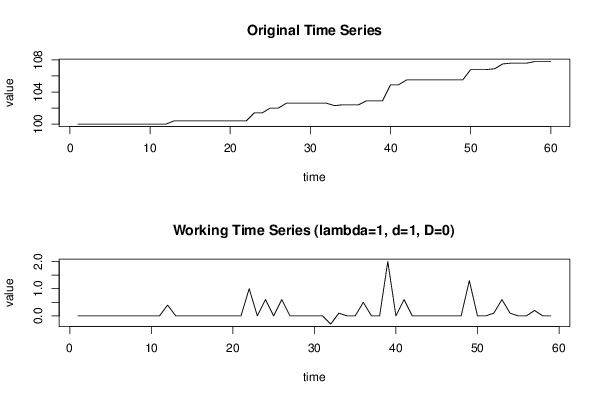
Dataseries X:
100
100
100
100
100
100
100
100
100
100
100
100
100.4
100.4
100.4
100.4
100.4
100.4
100.4
100.4
100.4
100.4
101.4
101.4
102
102
102.6
102.6
102.6
102.6
102.6
102.6
102.3
102.4
102.4
102.4
102.9
102.9
102.9
104.9
104.9
105.5
105.5
105.5
105.5
105.5
105.5
105.5
105.5
106.8
106.8
106.8
106.9
107.5
107.6
107.6
107.6
107.8
107.8
107.8


Summary of computational transaction
Raw Inputview raw input (R code)
Raw Outputview raw output of R engine
Computing time2 seconds
R Server'Gwilym Jenkins' @ jenkins.wessa.net

\begin{tabular}{lllllllll}
\hline
Summary of computational transaction \tabularnewline
Raw Input & view raw input (R code)  \tabularnewline
Raw Output & view raw output of R engine  \tabularnewline
Computing time & 2 seconds \tabularnewline
R Server & 'Gwilym Jenkins' @ jenkins.wessa.net \tabularnewline
\hline
\end{tabular}
%Source: https://freestatistics.org/blog/index.php?pk=&T=0

[TABLE]
[ROW][C]Summary of computational transaction[/C][/ROW]
[ROW][C]Raw Input[/C][C]view raw input (R code) [/C][/ROW]
[ROW][C]Raw Output[/C][C]view raw output of R engine [/C][/ROW]
[ROW][C]Computing time[/C][C]2 seconds[/C][/ROW]
[ROW][C]R Server[/C][C]'Gwilym Jenkins' @ jenkins.wessa.net[/C][/ROW]
[/TABLE]
Source: https://freestatistics.org/blog/index.php?pk=&T=0

Globally Unique Identifier (entire table): ba.freestatistics.org/blog/index.php?pk=&T=0

As an alternative you can also use a QR Code:  

The GUIDs for individual cells are displayed in the table below:

Summary of computational transaction
Raw Inputview raw input (R code)
Raw Outputview raw output of R engine
Computing time2 seconds
R Server'Gwilym Jenkins' @ jenkins.wessa.net


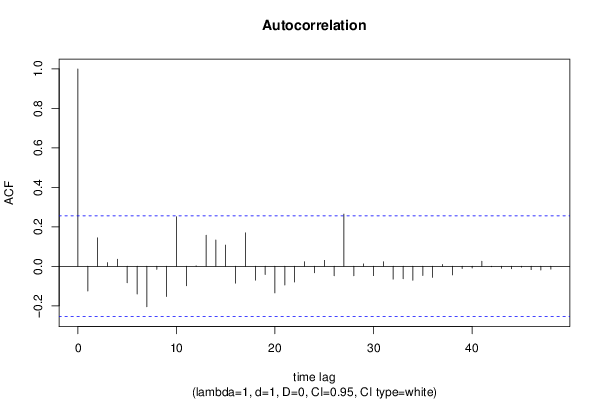
Autocorrelation Function
Time lag kACF(k)T-STATP-value
1-0.125008-0.96020.170435
20.1439411.10560.136687
30.0186240.14310.443369
40.0359040.27580.391838
5-0.083733-0.64320.261304
6-0.14036-1.07810.142684
7-0.205318-1.57710.060062
8-0.015492-0.1190.452841
9-0.153385-1.17820.121729
100.2511781.92930.029251
11-0.099021-0.76060.224964
120.002090.01610.493622
130.1575931.21050.115458
140.1331461.02270.155309
150.1073960.82490.20637
16-0.085265-0.65490.257528
170.1693411.30070.099204
18-0.070263-0.53970.295717
19-0.041335-0.31750.375992
20-0.134893-1.03610.152184
21-0.09487-0.72870.234531
22-0.07991-0.61380.270853
230.0234330.180.428886
24-0.032906-0.25280.400669
250.0300140.23050.409233
26-0.047984-0.36860.356883
270.2644172.0310.023383
28-0.048166-0.370.356365
290.0121460.09330.462992
30-0.047508-0.36490.358239
310.0232360.17850.42948
32-0.065062-0.49980.309555
33-0.063009-0.4840.315095
34-0.070593-0.54220.29485
35-0.046792-0.35940.360283
36-0.056188-0.43160.333808
370.009340.07170.471524
38-0.043507-0.33420.369714
39-0.011308-0.08690.46554
40-0.008371-0.06430.474475
410.0257730.1980.421875
42-0.002585-0.01990.492111
43-0.01008-0.07740.469272
44-0.01236-0.09490.462344
45-0.004207-0.03230.487166
46-0.016918-0.12990.448525
47-0.019197-0.14750.441639
48-0.01458-0.1120.455605

\begin{tabular}{lllllllll}
\hline
Autocorrelation Function \tabularnewline
Time lag k & ACF(k) & T-STAT & P-value \tabularnewline
1 & -0.125008 & -0.9602 & 0.170435 \tabularnewline
2 & 0.143941 & 1.1056 & 0.136687 \tabularnewline
3 & 0.018624 & 0.1431 & 0.443369 \tabularnewline
4 & 0.035904 & 0.2758 & 0.391838 \tabularnewline
5 & -0.083733 & -0.6432 & 0.261304 \tabularnewline
6 & -0.14036 & -1.0781 & 0.142684 \tabularnewline
7 & -0.205318 & -1.5771 & 0.060062 \tabularnewline
8 & -0.015492 & -0.119 & 0.452841 \tabularnewline
9 & -0.153385 & -1.1782 & 0.121729 \tabularnewline
10 & 0.251178 & 1.9293 & 0.029251 \tabularnewline
11 & -0.099021 & -0.7606 & 0.224964 \tabularnewline
12 & 0.00209 & 0.0161 & 0.493622 \tabularnewline
13 & 0.157593 & 1.2105 & 0.115458 \tabularnewline
14 & 0.133146 & 1.0227 & 0.155309 \tabularnewline
15 & 0.107396 & 0.8249 & 0.20637 \tabularnewline
16 & -0.085265 & -0.6549 & 0.257528 \tabularnewline
17 & 0.169341 & 1.3007 & 0.099204 \tabularnewline
18 & -0.070263 & -0.5397 & 0.295717 \tabularnewline
19 & -0.041335 & -0.3175 & 0.375992 \tabularnewline
20 & -0.134893 & -1.0361 & 0.152184 \tabularnewline
21 & -0.09487 & -0.7287 & 0.234531 \tabularnewline
22 & -0.07991 & -0.6138 & 0.270853 \tabularnewline
23 & 0.023433 & 0.18 & 0.428886 \tabularnewline
24 & -0.032906 & -0.2528 & 0.400669 \tabularnewline
25 & 0.030014 & 0.2305 & 0.409233 \tabularnewline
26 & -0.047984 & -0.3686 & 0.356883 \tabularnewline
27 & 0.264417 & 2.031 & 0.023383 \tabularnewline
28 & -0.048166 & -0.37 & 0.356365 \tabularnewline
29 & 0.012146 & 0.0933 & 0.462992 \tabularnewline
30 & -0.047508 & -0.3649 & 0.358239 \tabularnewline
31 & 0.023236 & 0.1785 & 0.42948 \tabularnewline
32 & -0.065062 & -0.4998 & 0.309555 \tabularnewline
33 & -0.063009 & -0.484 & 0.315095 \tabularnewline
34 & -0.070593 & -0.5422 & 0.29485 \tabularnewline
35 & -0.046792 & -0.3594 & 0.360283 \tabularnewline
36 & -0.056188 & -0.4316 & 0.333808 \tabularnewline
37 & 0.00934 & 0.0717 & 0.471524 \tabularnewline
38 & -0.043507 & -0.3342 & 0.369714 \tabularnewline
39 & -0.011308 & -0.0869 & 0.46554 \tabularnewline
40 & -0.008371 & -0.0643 & 0.474475 \tabularnewline
41 & 0.025773 & 0.198 & 0.421875 \tabularnewline
42 & -0.002585 & -0.0199 & 0.492111 \tabularnewline
43 & -0.01008 & -0.0774 & 0.469272 \tabularnewline
44 & -0.01236 & -0.0949 & 0.462344 \tabularnewline
45 & -0.004207 & -0.0323 & 0.487166 \tabularnewline
46 & -0.016918 & -0.1299 & 0.448525 \tabularnewline
47 & -0.019197 & -0.1475 & 0.441639 \tabularnewline
48 & -0.01458 & -0.112 & 0.455605 \tabularnewline
\hline
\end{tabular}
%Source: https://freestatistics.org/blog/index.php?pk=&T=1

[TABLE]
[ROW][C]Autocorrelation Function[/C][/ROW]
[ROW][C]Time lag k[/C][C]ACF(k)[/C][C]T-STAT[/C][C]P-value[/C][/ROW]
[ROW][C]1[/C][C]-0.125008[/C][C]-0.9602[/C][C]0.170435[/C][/ROW]
[ROW][C]2[/C][C]0.143941[/C][C]1.1056[/C][C]0.136687[/C][/ROW]
[ROW][C]3[/C][C]0.018624[/C][C]0.1431[/C][C]0.443369[/C][/ROW]
[ROW][C]4[/C][C]0.035904[/C][C]0.2758[/C][C]0.391838[/C][/ROW]
[ROW][C]5[/C][C]-0.083733[/C][C]-0.6432[/C][C]0.261304[/C][/ROW]
[ROW][C]6[/C][C]-0.14036[/C][C]-1.0781[/C][C]0.142684[/C][/ROW]
[ROW][C]7[/C][C]-0.205318[/C][C]-1.5771[/C][C]0.060062[/C][/ROW]
[ROW][C]8[/C][C]-0.015492[/C][C]-0.119[/C][C]0.452841[/C][/ROW]
[ROW][C]9[/C][C]-0.153385[/C][C]-1.1782[/C][C]0.121729[/C][/ROW]
[ROW][C]10[/C][C]0.251178[/C][C]1.9293[/C][C]0.029251[/C][/ROW]
[ROW][C]11[/C][C]-0.099021[/C][C]-0.7606[/C][C]0.224964[/C][/ROW]
[ROW][C]12[/C][C]0.00209[/C][C]0.0161[/C][C]0.493622[/C][/ROW]
[ROW][C]13[/C][C]0.157593[/C][C]1.2105[/C][C]0.115458[/C][/ROW]
[ROW][C]14[/C][C]0.133146[/C][C]1.0227[/C][C]0.155309[/C][/ROW]
[ROW][C]15[/C][C]0.107396[/C][C]0.8249[/C][C]0.20637[/C][/ROW]
[ROW][C]16[/C][C]-0.085265[/C][C]-0.6549[/C][C]0.257528[/C][/ROW]
[ROW][C]17[/C][C]0.169341[/C][C]1.3007[/C][C]0.099204[/C][/ROW]
[ROW][C]18[/C][C]-0.070263[/C][C]-0.5397[/C][C]0.295717[/C][/ROW]
[ROW][C]19[/C][C]-0.041335[/C][C]-0.3175[/C][C]0.375992[/C][/ROW]
[ROW][C]20[/C][C]-0.134893[/C][C]-1.0361[/C][C]0.152184[/C][/ROW]
[ROW][C]21[/C][C]-0.09487[/C][C]-0.7287[/C][C]0.234531[/C][/ROW]
[ROW][C]22[/C][C]-0.07991[/C][C]-0.6138[/C][C]0.270853[/C][/ROW]
[ROW][C]23[/C][C]0.023433[/C][C]0.18[/C][C]0.428886[/C][/ROW]
[ROW][C]24[/C][C]-0.032906[/C][C]-0.2528[/C][C]0.400669[/C][/ROW]
[ROW][C]25[/C][C]0.030014[/C][C]0.2305[/C][C]0.409233[/C][/ROW]
[ROW][C]26[/C][C]-0.047984[/C][C]-0.3686[/C][C]0.356883[/C][/ROW]
[ROW][C]27[/C][C]0.264417[/C][C]2.031[/C][C]0.023383[/C][/ROW]
[ROW][C]28[/C][C]-0.048166[/C][C]-0.37[/C][C]0.356365[/C][/ROW]
[ROW][C]29[/C][C]0.012146[/C][C]0.0933[/C][C]0.462992[/C][/ROW]
[ROW][C]30[/C][C]-0.047508[/C][C]-0.3649[/C][C]0.358239[/C][/ROW]
[ROW][C]31[/C][C]0.023236[/C][C]0.1785[/C][C]0.42948[/C][/ROW]
[ROW][C]32[/C][C]-0.065062[/C][C]-0.4998[/C][C]0.309555[/C][/ROW]
[ROW][C]33[/C][C]-0.063009[/C][C]-0.484[/C][C]0.315095[/C][/ROW]
[ROW][C]34[/C][C]-0.070593[/C][C]-0.5422[/C][C]0.29485[/C][/ROW]
[ROW][C]35[/C][C]-0.046792[/C][C]-0.3594[/C][C]0.360283[/C][/ROW]
[ROW][C]36[/C][C]-0.056188[/C][C]-0.4316[/C][C]0.333808[/C][/ROW]
[ROW][C]37[/C][C]0.00934[/C][C]0.0717[/C][C]0.471524[/C][/ROW]
[ROW][C]38[/C][C]-0.043507[/C][C]-0.3342[/C][C]0.369714[/C][/ROW]
[ROW][C]39[/C][C]-0.011308[/C][C]-0.0869[/C][C]0.46554[/C][/ROW]
[ROW][C]40[/C][C]-0.008371[/C][C]-0.0643[/C][C]0.474475[/C][/ROW]
[ROW][C]41[/C][C]0.025773[/C][C]0.198[/C][C]0.421875[/C][/ROW]
[ROW][C]42[/C][C]-0.002585[/C][C]-0.0199[/C][C]0.492111[/C][/ROW]
[ROW][C]43[/C][C]-0.01008[/C][C]-0.0774[/C][C]0.469272[/C][/ROW]
[ROW][C]44[/C][C]-0.01236[/C][C]-0.0949[/C][C]0.462344[/C][/ROW]
[ROW][C]45[/C][C]-0.004207[/C][C]-0.0323[/C][C]0.487166[/C][/ROW]
[ROW][C]46[/C][C]-0.016918[/C][C]-0.1299[/C][C]0.448525[/C][/ROW]
[ROW][C]47[/C][C]-0.019197[/C][C]-0.1475[/C][C]0.441639[/C][/ROW]
[ROW][C]48[/C][C]-0.01458[/C][C]-0.112[/C][C]0.455605[/C][/ROW]
[/TABLE]
Source: https://freestatistics.org/blog/index.php?pk=&T=1

Globally Unique Identifier (entire table): ba.freestatistics.org/blog/index.php?pk=&T=1

As an alternative you can also use a QR Code:  

The GUIDs for individual cells are displayed in the table below:

Autocorrelation Function
Time lag kACF(k)T-STATP-value
1-0.125008-0.96020.170435
20.1439411.10560.136687
30.0186240.14310.443369
40.0359040.27580.391838
5-0.083733-0.64320.261304
6-0.14036-1.07810.142684
7-0.205318-1.57710.060062
8-0.015492-0.1190.452841
9-0.153385-1.17820.121729
100.2511781.92930.029251
11-0.099021-0.76060.224964
120.002090.01610.493622
130.1575931.21050.115458
140.1331461.02270.155309
150.1073960.82490.20637
16-0.085265-0.65490.257528
170.1693411.30070.099204
18-0.070263-0.53970.295717
19-0.041335-0.31750.375992
20-0.134893-1.03610.152184
21-0.09487-0.72870.234531
22-0.07991-0.61380.270853
230.0234330.180.428886
24-0.032906-0.25280.400669
250.0300140.23050.409233
26-0.047984-0.36860.356883
270.2644172.0310.023383
28-0.048166-0.370.356365
290.0121460.09330.462992
30-0.047508-0.36490.358239
310.0232360.17850.42948
32-0.065062-0.49980.309555
33-0.063009-0.4840.315095
34-0.070593-0.54220.29485
35-0.046792-0.35940.360283
36-0.056188-0.43160.333808
370.009340.07170.471524
38-0.043507-0.33420.369714
39-0.011308-0.08690.46554
40-0.008371-0.06430.474475
410.0257730.1980.421875
42-0.002585-0.01990.492111
43-0.01008-0.07740.469272
44-0.01236-0.09490.462344
45-0.004207-0.03230.487166
46-0.016918-0.12990.448525
47-0.019197-0.14750.441639
48-0.01458-0.1120.455605


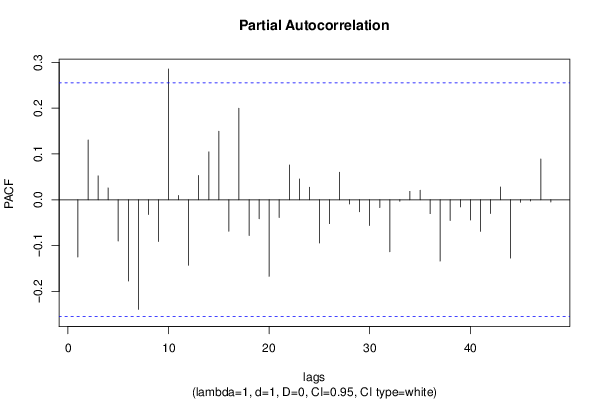
Partial Autocorrelation Function
Time lag kPACF(k)T-STATP-value
1-0.125008-0.96020.170435
20.1303511.00120.160398
30.0522580.40140.344789
40.0259150.19910.421452
5-0.089923-0.69070.246227
6-0.177299-1.36190.08921
7-0.239367-1.83860.035503
8-0.032276-0.24790.402531
9-0.09094-0.69850.243796
100.2856082.19380.016101
110.0094660.07270.47114
12-0.14304-1.09870.138179
130.0530880.40780.342456
140.1046280.80370.21241
150.1497931.15060.127273
16-0.068608-0.5270.300089
170.1999321.53570.064978
18-0.078045-0.59950.275575
19-0.041268-0.3170.376188
20-0.167189-1.28420.102045
21-0.038881-0.29870.383127
220.0757990.58220.281318
230.0452440.34750.364717
240.0274540.21090.416855
25-0.094309-0.72440.235842
26-0.052067-0.39990.345324
270.0599370.46040.323466
28-0.009288-0.07130.471684
29-0.02621-0.20130.42057
30-0.056321-0.43260.333439
31-0.017081-0.13120.448031
32-0.113436-0.87130.193556
33-0.003148-0.02420.490394
340.0183670.14110.444143
350.0206350.15850.437302
36-0.030285-0.23260.40843
37-0.133888-1.02840.153976
38-0.045297-0.34790.364563
39-0.015529-0.11930.452729
40-0.044032-0.33820.3682
41-0.069057-0.53040.298899
42-0.030115-0.23130.408935
430.0278890.21420.415556
44-0.127345-0.97820.165996
45-0.005396-0.04140.483541
46-0.002614-0.02010.492025
470.089090.68430.248228
48-0.00503-0.03860.484655

\begin{tabular}{lllllllll}
\hline
Partial Autocorrelation Function \tabularnewline
Time lag k & PACF(k) & T-STAT & P-value \tabularnewline
1 & -0.125008 & -0.9602 & 0.170435 \tabularnewline
2 & 0.130351 & 1.0012 & 0.160398 \tabularnewline
3 & 0.052258 & 0.4014 & 0.344789 \tabularnewline
4 & 0.025915 & 0.1991 & 0.421452 \tabularnewline
5 & -0.089923 & -0.6907 & 0.246227 \tabularnewline
6 & -0.177299 & -1.3619 & 0.08921 \tabularnewline
7 & -0.239367 & -1.8386 & 0.035503 \tabularnewline
8 & -0.032276 & -0.2479 & 0.402531 \tabularnewline
9 & -0.09094 & -0.6985 & 0.243796 \tabularnewline
10 & 0.285608 & 2.1938 & 0.016101 \tabularnewline
11 & 0.009466 & 0.0727 & 0.47114 \tabularnewline
12 & -0.14304 & -1.0987 & 0.138179 \tabularnewline
13 & 0.053088 & 0.4078 & 0.342456 \tabularnewline
14 & 0.104628 & 0.8037 & 0.21241 \tabularnewline
15 & 0.149793 & 1.1506 & 0.127273 \tabularnewline
16 & -0.068608 & -0.527 & 0.300089 \tabularnewline
17 & 0.199932 & 1.5357 & 0.064978 \tabularnewline
18 & -0.078045 & -0.5995 & 0.275575 \tabularnewline
19 & -0.041268 & -0.317 & 0.376188 \tabularnewline
20 & -0.167189 & -1.2842 & 0.102045 \tabularnewline
21 & -0.038881 & -0.2987 & 0.383127 \tabularnewline
22 & 0.075799 & 0.5822 & 0.281318 \tabularnewline
23 & 0.045244 & 0.3475 & 0.364717 \tabularnewline
24 & 0.027454 & 0.2109 & 0.416855 \tabularnewline
25 & -0.094309 & -0.7244 & 0.235842 \tabularnewline
26 & -0.052067 & -0.3999 & 0.345324 \tabularnewline
27 & 0.059937 & 0.4604 & 0.323466 \tabularnewline
28 & -0.009288 & -0.0713 & 0.471684 \tabularnewline
29 & -0.02621 & -0.2013 & 0.42057 \tabularnewline
30 & -0.056321 & -0.4326 & 0.333439 \tabularnewline
31 & -0.017081 & -0.1312 & 0.448031 \tabularnewline
32 & -0.113436 & -0.8713 & 0.193556 \tabularnewline
33 & -0.003148 & -0.0242 & 0.490394 \tabularnewline
34 & 0.018367 & 0.1411 & 0.444143 \tabularnewline
35 & 0.020635 & 0.1585 & 0.437302 \tabularnewline
36 & -0.030285 & -0.2326 & 0.40843 \tabularnewline
37 & -0.133888 & -1.0284 & 0.153976 \tabularnewline
38 & -0.045297 & -0.3479 & 0.364563 \tabularnewline
39 & -0.015529 & -0.1193 & 0.452729 \tabularnewline
40 & -0.044032 & -0.3382 & 0.3682 \tabularnewline
41 & -0.069057 & -0.5304 & 0.298899 \tabularnewline
42 & -0.030115 & -0.2313 & 0.408935 \tabularnewline
43 & 0.027889 & 0.2142 & 0.415556 \tabularnewline
44 & -0.127345 & -0.9782 & 0.165996 \tabularnewline
45 & -0.005396 & -0.0414 & 0.483541 \tabularnewline
46 & -0.002614 & -0.0201 & 0.492025 \tabularnewline
47 & 0.08909 & 0.6843 & 0.248228 \tabularnewline
48 & -0.00503 & -0.0386 & 0.484655 \tabularnewline
\hline
\end{tabular}
%Source: https://freestatistics.org/blog/index.php?pk=&T=2

[TABLE]
[ROW][C]Partial Autocorrelation Function[/C][/ROW]
[ROW][C]Time lag k[/C][C]PACF(k)[/C][C]T-STAT[/C][C]P-value[/C][/ROW]
[ROW][C]1[/C][C]-0.125008[/C][C]-0.9602[/C][C]0.170435[/C][/ROW]
[ROW][C]2[/C][C]0.130351[/C][C]1.0012[/C][C]0.160398[/C][/ROW]
[ROW][C]3[/C][C]0.052258[/C][C]0.4014[/C][C]0.344789[/C][/ROW]
[ROW][C]4[/C][C]0.025915[/C][C]0.1991[/C][C]0.421452[/C][/ROW]
[ROW][C]5[/C][C]-0.089923[/C][C]-0.6907[/C][C]0.246227[/C][/ROW]
[ROW][C]6[/C][C]-0.177299[/C][C]-1.3619[/C][C]0.08921[/C][/ROW]
[ROW][C]7[/C][C]-0.239367[/C][C]-1.8386[/C][C]0.035503[/C][/ROW]
[ROW][C]8[/C][C]-0.032276[/C][C]-0.2479[/C][C]0.402531[/C][/ROW]
[ROW][C]9[/C][C]-0.09094[/C][C]-0.6985[/C][C]0.243796[/C][/ROW]
[ROW][C]10[/C][C]0.285608[/C][C]2.1938[/C][C]0.016101[/C][/ROW]
[ROW][C]11[/C][C]0.009466[/C][C]0.0727[/C][C]0.47114[/C][/ROW]
[ROW][C]12[/C][C]-0.14304[/C][C]-1.0987[/C][C]0.138179[/C][/ROW]
[ROW][C]13[/C][C]0.053088[/C][C]0.4078[/C][C]0.342456[/C][/ROW]
[ROW][C]14[/C][C]0.104628[/C][C]0.8037[/C][C]0.21241[/C][/ROW]
[ROW][C]15[/C][C]0.149793[/C][C]1.1506[/C][C]0.127273[/C][/ROW]
[ROW][C]16[/C][C]-0.068608[/C][C]-0.527[/C][C]0.300089[/C][/ROW]
[ROW][C]17[/C][C]0.199932[/C][C]1.5357[/C][C]0.064978[/C][/ROW]
[ROW][C]18[/C][C]-0.078045[/C][C]-0.5995[/C][C]0.275575[/C][/ROW]
[ROW][C]19[/C][C]-0.041268[/C][C]-0.317[/C][C]0.376188[/C][/ROW]
[ROW][C]20[/C][C]-0.167189[/C][C]-1.2842[/C][C]0.102045[/C][/ROW]
[ROW][C]21[/C][C]-0.038881[/C][C]-0.2987[/C][C]0.383127[/C][/ROW]
[ROW][C]22[/C][C]0.075799[/C][C]0.5822[/C][C]0.281318[/C][/ROW]
[ROW][C]23[/C][C]0.045244[/C][C]0.3475[/C][C]0.364717[/C][/ROW]
[ROW][C]24[/C][C]0.027454[/C][C]0.2109[/C][C]0.416855[/C][/ROW]
[ROW][C]25[/C][C]-0.094309[/C][C]-0.7244[/C][C]0.235842[/C][/ROW]
[ROW][C]26[/C][C]-0.052067[/C][C]-0.3999[/C][C]0.345324[/C][/ROW]
[ROW][C]27[/C][C]0.059937[/C][C]0.4604[/C][C]0.323466[/C][/ROW]
[ROW][C]28[/C][C]-0.009288[/C][C]-0.0713[/C][C]0.471684[/C][/ROW]
[ROW][C]29[/C][C]-0.02621[/C][C]-0.2013[/C][C]0.42057[/C][/ROW]
[ROW][C]30[/C][C]-0.056321[/C][C]-0.4326[/C][C]0.333439[/C][/ROW]
[ROW][C]31[/C][C]-0.017081[/C][C]-0.1312[/C][C]0.448031[/C][/ROW]
[ROW][C]32[/C][C]-0.113436[/C][C]-0.8713[/C][C]0.193556[/C][/ROW]
[ROW][C]33[/C][C]-0.003148[/C][C]-0.0242[/C][C]0.490394[/C][/ROW]
[ROW][C]34[/C][C]0.018367[/C][C]0.1411[/C][C]0.444143[/C][/ROW]
[ROW][C]35[/C][C]0.020635[/C][C]0.1585[/C][C]0.437302[/C][/ROW]
[ROW][C]36[/C][C]-0.030285[/C][C]-0.2326[/C][C]0.40843[/C][/ROW]
[ROW][C]37[/C][C]-0.133888[/C][C]-1.0284[/C][C]0.153976[/C][/ROW]
[ROW][C]38[/C][C]-0.045297[/C][C]-0.3479[/C][C]0.364563[/C][/ROW]
[ROW][C]39[/C][C]-0.015529[/C][C]-0.1193[/C][C]0.452729[/C][/ROW]
[ROW][C]40[/C][C]-0.044032[/C][C]-0.3382[/C][C]0.3682[/C][/ROW]
[ROW][C]41[/C][C]-0.069057[/C][C]-0.5304[/C][C]0.298899[/C][/ROW]
[ROW][C]42[/C][C]-0.030115[/C][C]-0.2313[/C][C]0.408935[/C][/ROW]
[ROW][C]43[/C][C]0.027889[/C][C]0.2142[/C][C]0.415556[/C][/ROW]
[ROW][C]44[/C][C]-0.127345[/C][C]-0.9782[/C][C]0.165996[/C][/ROW]
[ROW][C]45[/C][C]-0.005396[/C][C]-0.0414[/C][C]0.483541[/C][/ROW]
[ROW][C]46[/C][C]-0.002614[/C][C]-0.0201[/C][C]0.492025[/C][/ROW]
[ROW][C]47[/C][C]0.08909[/C][C]0.6843[/C][C]0.248228[/C][/ROW]
[ROW][C]48[/C][C]-0.00503[/C][C]-0.0386[/C][C]0.484655[/C][/ROW]
[/TABLE]
Source: https://freestatistics.org/blog/index.php?pk=&T=2

Globally Unique Identifier (entire table): ba.freestatistics.org/blog/index.php?pk=&T=2

As an alternative you can also use a QR Code:  

The GUIDs for individual cells are displayed in the table below:

Partial Autocorrelation Function
Time lag kPACF(k)T-STATP-value
1-0.125008-0.96020.170435
20.1303511.00120.160398
30.0522580.40140.344789
40.0259150.19910.421452
5-0.089923-0.69070.246227
6-0.177299-1.36190.08921
7-0.239367-1.83860.035503
8-0.032276-0.24790.402531
9-0.09094-0.69850.243796
100.2856082.19380.016101
110.0094660.07270.47114
12-0.14304-1.09870.138179
130.0530880.40780.342456
140.1046280.80370.21241
150.1497931.15060.127273
16-0.068608-0.5270.300089
170.1999321.53570.064978
18-0.078045-0.59950.275575
19-0.041268-0.3170.376188
20-0.167189-1.28420.102045
21-0.038881-0.29870.383127
220.0757990.58220.281318
230.0452440.34750.364717
240.0274540.21090.416855
25-0.094309-0.72440.235842
26-0.052067-0.39990.345324
270.0599370.46040.323466
28-0.009288-0.07130.471684
29-0.02621-0.20130.42057
30-0.056321-0.43260.333439
31-0.017081-0.13120.448031
32-0.113436-0.87130.193556
33-0.003148-0.02420.490394
340.0183670.14110.444143
350.0206350.15850.437302
36-0.030285-0.23260.40843
37-0.133888-1.02840.153976
38-0.045297-0.34790.364563
39-0.015529-0.11930.452729
40-0.044032-0.33820.3682
41-0.069057-0.53040.298899
42-0.030115-0.23130.408935
430.0278890.21420.415556
44-0.127345-0.97820.165996
45-0.005396-0.04140.483541
46-0.002614-0.02010.492025
470.089090.68430.248228
48-0.00503-0.03860.484655


Parameters (Session):
par1 = 48 ; par2 = 1 ; par3 = 1 ; par4 = 0 ; par5 = 12 ; par6 = White Noise ; par7 = 0.95 ;
Parameters (R input):
par1 = 48 ; par2 = 1 ; par3 = 1 ; par4 = 0 ; par5 = 12 ; par6 = White Noise ; par7 = 0.95 ; par8 = ;
R code (references can be found in the software module):
par8 <- ''
par7 <- '0.95'
par6 <- 'White Noise'
par5 <- '12'
par4 <- '0'
par3 <- '1'
par2 <- '1'
par1 <- '48'
if (par1 == 'Default') {
par1 = 10*log10(length(x))
} else {
par1 <- as.numeric(par1)
}
par2 <- as.numeric(par2)
par3 <- as.numeric(par3)
par4 <- as.numeric(par4)
par5 <- as.numeric(par5)
if (par6 == 'White Noise') par6 <- 'white' else par6 <- 'ma'
par7 <- as.numeric(par7)
if (par8 != '') par8 <- as.numeric(par8)
x <- na.omit(x)
ox <- x
if (par8 == '') {
if (par2 == 0) {
x <- log(x)
} else {
x <- (x ^ par2 - 1) / par2
}
} else {
x <- log(x,base=par8)
}
if (par3 > 0) x <- diff(x,lag=1,difference=par3)
if (par4 > 0) x <- diff(x,lag=par5,difference=par4)
bitmap(file='picts.png')
op <- par(mfrow=c(2,1))
plot(ox,type='l',main='Original Time Series',xlab='time',ylab='value')
if (par8=='') {
mytitle <- paste('Working Time Series (lambda=',par2,', d=',par3,', D=',par4,')',sep='')
mysub <- paste('(lambda=',par2,', d=',par3,', D=',par4,', CI=', par7, ', CI type=',par6,')',sep='')
} else {
mytitle <- paste('Working Time Series (base=',par8,', d=',par3,', D=',par4,')',sep='')
mysub <- paste('(base=',par8,', d=',par3,', D=',par4,', CI=', par7, ', CI type=',par6,')',sep='')
}
plot(x,type='l', main=mytitle,xlab='time',ylab='value')
par(op)
dev.off()
bitmap(file='pic1.png')
racf <- acf(x, par1, main='Autocorrelation', xlab='time lag', ylab='ACF', ci.type=par6, ci=par7, sub=mysub)
dev.off()
bitmap(file='pic2.png')
rpacf <- pacf(x,par1,main='Partial Autocorrelation',xlab='lags',ylab='PACF',sub=mysub)
dev.off()
(myacf <- c(racf$acf))
(mypacf <- c(rpacf$acf))
lengthx <- length(x)
sqrtn <- sqrt(lengthx)
load(file='createtable')
a<-table.start()
a<-table.row.start(a)
a<-table.element(a,'Autocorrelation Function',4,TRUE)
a<-table.row.end(a)
a<-table.row.start(a)
a<-table.element(a,'Time lag k',header=TRUE)
a<-table.element(a,hyperlink('basics.htm','ACF(k)','click here for more information about the Autocorrelation Function'),header=TRUE)
a<-table.element(a,'T-STAT',header=TRUE)
a<-table.element(a,'P-value',header=TRUE)
a<-table.row.end(a)
for (i in 2:(par1+1)) {
a<-table.row.start(a)
a<-table.element(a,i-1,header=TRUE)
a<-table.element(a,round(myacf[i],6))
mytstat <- myacf[i]*sqrtn
a<-table.element(a,round(mytstat,4))
a<-table.element(a,round(1-pt(abs(mytstat),lengthx),6))
a<-table.row.end(a)
}
a<-table.end(a)
table.save(a,file='mytable.tab')
a<-table.start()
a<-table.row.start(a)
a<-table.element(a,'Partial Autocorrelation Function',4,TRUE)
a<-table.row.end(a)
a<-table.row.start(a)
a<-table.element(a,'Time lag k',header=TRUE)
a<-table.element(a,hyperlink('basics.htm','PACF(k)','click here for more information about the Partial Autocorrelation Function'),header=TRUE)
a<-table.element(a,'T-STAT',header=TRUE)
a<-table.element(a,'P-value',header=TRUE)
a<-table.row.end(a)
for (i in 1:par1) {
a<-table.row.start(a)
a<-table.element(a,i,header=TRUE)
a<-table.element(a,round(mypacf[i],6))
mytstat <- mypacf[i]*sqrtn
a<-table.element(a,round(mytstat,4))
a<-table.element(a,round(1-pt(abs(mytstat),lengthx),6))
a<-table.row.end(a)
}
a<-table.end(a)
table.save(a,file='mytable1.tab')