Free Statistics

of Irreproducible Research!

Author's title

Author*Unverified author*
R Software Modulerwasp_autocorrelation.wasp
Title produced by software(Partial) Autocorrelation Function
Date of computationWed, 19 Oct 2016 14:49:53 +0100
Cite this page as followsStatistical Computations at FreeStatistics.org, Office for Research Development and Education, URL https://freestatistics.org/blog/index.php?v=date/2016/Oct/19/t14768850157bzkgj3sjcyj74c.htm/, Retrieved Tue, 30 Apr 2024 07:01:58 +0200
Statistical Computations at FreeStatistics.org, Office for Research Development and Education, URL https://freestatistics.org/blog/index.php?pk=, Retrieved Tue, 30 Apr 2024 07:01:58 +0200
QR Codes:

Original text written by user:
IsPrivate?No (this computation is public)
User-defined keywords
Estimated Impact0
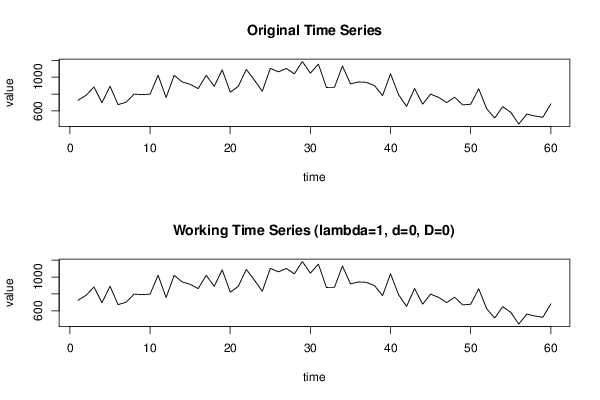
Dataseries X:
726
784
884
696
893
674
703
799
793
799
1022
758
1021
944
915
864
1022
891
1087
822
890
1092
967
833
1104
1063
1103
1039
1185
1047
1155
878
879
1133
920
943
938
900
781
1040
792
653
866
679
799
760
699
762
671
679
862
624
516
650
583
444
562
540
524
683


Summary of computational transaction
Raw Inputview raw input (R code)
Raw Outputview raw output of R engine
Computing time1 seconds
R Server'Sir Maurice George Kendall' @ kendall.wessa.net

\begin{tabular}{lllllllll}
\hline
Summary of computational transaction \tabularnewline
Raw Input & view raw input (R code)  \tabularnewline
Raw Output & view raw output of R engine  \tabularnewline
Computing time & 1 seconds \tabularnewline
R Server & 'Sir Maurice George Kendall' @ kendall.wessa.net \tabularnewline
\hline
\end{tabular}
%Source: https://freestatistics.org/blog/index.php?pk=&T=0

[TABLE]
[ROW][C]Summary of computational transaction[/C][/ROW]
[ROW][C]Raw Input[/C][C]view raw input (R code) [/C][/ROW]
[ROW][C]Raw Output[/C][C]view raw output of R engine [/C][/ROW]
[ROW][C]Computing time[/C][C]1 seconds[/C][/ROW]
[ROW][C]R Server[/C][C]'Sir Maurice George Kendall' @ kendall.wessa.net[/C][/ROW]
[/TABLE]
Source: https://freestatistics.org/blog/index.php?pk=&T=0

Globally Unique Identifier (entire table): ba.freestatistics.org/blog/index.php?pk=&T=0

As an alternative you can also use a QR Code:  

The GUIDs for individual cells are displayed in the table below:

Summary of computational transaction
Raw Inputview raw input (R code)
Raw Outputview raw output of R engine
Computing time1 seconds
R Server'Sir Maurice George Kendall' @ kendall.wessa.net


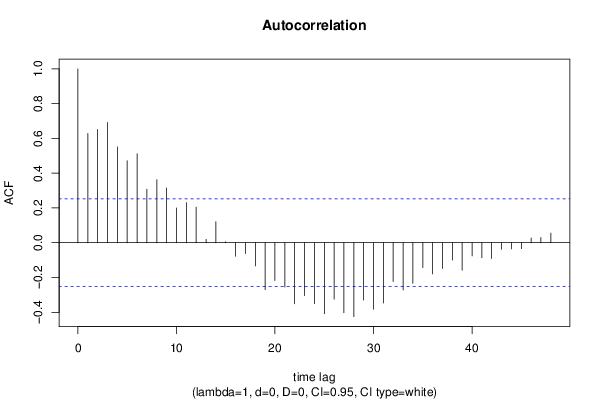
Autocorrelation Function
Time lag kACF(k)T-STATP-value
10.628294.86674e-06
20.6518555.04922e-06
30.6916375.35741e-06
40.5514584.27163.5e-05
50.4721273.65710.00027
60.5121693.96729.8e-05
70.3077582.38390.010156
80.3628992.8110.003331
90.3154082.44310.00876
100.1995071.54540.063757
110.2309591.7890.039331
120.2047441.58590.059005
130.0192260.14890.441056
140.1206880.93480.176807
150.0050460.03910.484475
16-0.078113-0.60510.27371
17-0.061731-0.47820.317135
18-0.13338-1.03320.152839
19-0.269848-2.09020.020421
20-0.217077-1.68150.048935
21-0.255064-1.97570.026395
22-0.350881-2.71790.004288
23-0.30419-2.35620.010872
24-0.350302-2.71340.004339
25-0.409015-3.16820.001207
26-0.324423-2.5130.007338
27-0.402871-3.12060.001387
28-0.425325-3.29460.000829
29-0.329389-2.55140.006647
30-0.38263-2.96380.002176
31-0.347168-2.68920.004631
32-0.222874-1.72640.044713
33-0.271606-2.10380.019796
34-0.23365-1.80980.037665
35-0.143099-1.10840.136047
36-0.179454-1.390.084825
37-0.14856-1.15070.127203
38-0.099628-0.77170.221656
39-0.158569-1.22830.112071
40-0.075718-0.58650.279867
41-0.086085-0.66680.253724
42-0.090527-0.70120.242938
43-0.037596-0.29120.385943
44-0.035293-0.27340.392751
45-0.034032-0.26360.396492
460.0271250.21010.417146
470.030210.2340.407889
480.0552830.42820.335013

\begin{tabular}{lllllllll}
\hline
Autocorrelation Function \tabularnewline
Time lag k & ACF(k) & T-STAT & P-value \tabularnewline
1 & 0.62829 & 4.8667 & 4e-06 \tabularnewline
2 & 0.651855 & 5.0492 & 2e-06 \tabularnewline
3 & 0.691637 & 5.3574 & 1e-06 \tabularnewline
4 & 0.551458 & 4.2716 & 3.5e-05 \tabularnewline
5 & 0.472127 & 3.6571 & 0.00027 \tabularnewline
6 & 0.512169 & 3.9672 & 9.8e-05 \tabularnewline
7 & 0.307758 & 2.3839 & 0.010156 \tabularnewline
8 & 0.362899 & 2.811 & 0.003331 \tabularnewline
9 & 0.315408 & 2.4431 & 0.00876 \tabularnewline
10 & 0.199507 & 1.5454 & 0.063757 \tabularnewline
11 & 0.230959 & 1.789 & 0.039331 \tabularnewline
12 & 0.204744 & 1.5859 & 0.059005 \tabularnewline
13 & 0.019226 & 0.1489 & 0.441056 \tabularnewline
14 & 0.120688 & 0.9348 & 0.176807 \tabularnewline
15 & 0.005046 & 0.0391 & 0.484475 \tabularnewline
16 & -0.078113 & -0.6051 & 0.27371 \tabularnewline
17 & -0.061731 & -0.4782 & 0.317135 \tabularnewline
18 & -0.13338 & -1.0332 & 0.152839 \tabularnewline
19 & -0.269848 & -2.0902 & 0.020421 \tabularnewline
20 & -0.217077 & -1.6815 & 0.048935 \tabularnewline
21 & -0.255064 & -1.9757 & 0.026395 \tabularnewline
22 & -0.350881 & -2.7179 & 0.004288 \tabularnewline
23 & -0.30419 & -2.3562 & 0.010872 \tabularnewline
24 & -0.350302 & -2.7134 & 0.004339 \tabularnewline
25 & -0.409015 & -3.1682 & 0.001207 \tabularnewline
26 & -0.324423 & -2.513 & 0.007338 \tabularnewline
27 & -0.402871 & -3.1206 & 0.001387 \tabularnewline
28 & -0.425325 & -3.2946 & 0.000829 \tabularnewline
29 & -0.329389 & -2.5514 & 0.006647 \tabularnewline
30 & -0.38263 & -2.9638 & 0.002176 \tabularnewline
31 & -0.347168 & -2.6892 & 0.004631 \tabularnewline
32 & -0.222874 & -1.7264 & 0.044713 \tabularnewline
33 & -0.271606 & -2.1038 & 0.019796 \tabularnewline
34 & -0.23365 & -1.8098 & 0.037665 \tabularnewline
35 & -0.143099 & -1.1084 & 0.136047 \tabularnewline
36 & -0.179454 & -1.39 & 0.084825 \tabularnewline
37 & -0.14856 & -1.1507 & 0.127203 \tabularnewline
38 & -0.099628 & -0.7717 & 0.221656 \tabularnewline
39 & -0.158569 & -1.2283 & 0.112071 \tabularnewline
40 & -0.075718 & -0.5865 & 0.279867 \tabularnewline
41 & -0.086085 & -0.6668 & 0.253724 \tabularnewline
42 & -0.090527 & -0.7012 & 0.242938 \tabularnewline
43 & -0.037596 & -0.2912 & 0.385943 \tabularnewline
44 & -0.035293 & -0.2734 & 0.392751 \tabularnewline
45 & -0.034032 & -0.2636 & 0.396492 \tabularnewline
46 & 0.027125 & 0.2101 & 0.417146 \tabularnewline
47 & 0.03021 & 0.234 & 0.407889 \tabularnewline
48 & 0.055283 & 0.4282 & 0.335013 \tabularnewline
\hline
\end{tabular}
%Source: https://freestatistics.org/blog/index.php?pk=&T=1

[TABLE]
[ROW][C]Autocorrelation Function[/C][/ROW]
[ROW][C]Time lag k[/C][C]ACF(k)[/C][C]T-STAT[/C][C]P-value[/C][/ROW]
[ROW][C]1[/C][C]0.62829[/C][C]4.8667[/C][C]4e-06[/C][/ROW]
[ROW][C]2[/C][C]0.651855[/C][C]5.0492[/C][C]2e-06[/C][/ROW]
[ROW][C]3[/C][C]0.691637[/C][C]5.3574[/C][C]1e-06[/C][/ROW]
[ROW][C]4[/C][C]0.551458[/C][C]4.2716[/C][C]3.5e-05[/C][/ROW]
[ROW][C]5[/C][C]0.472127[/C][C]3.6571[/C][C]0.00027[/C][/ROW]
[ROW][C]6[/C][C]0.512169[/C][C]3.9672[/C][C]9.8e-05[/C][/ROW]
[ROW][C]7[/C][C]0.307758[/C][C]2.3839[/C][C]0.010156[/C][/ROW]
[ROW][C]8[/C][C]0.362899[/C][C]2.811[/C][C]0.003331[/C][/ROW]
[ROW][C]9[/C][C]0.315408[/C][C]2.4431[/C][C]0.00876[/C][/ROW]
[ROW][C]10[/C][C]0.199507[/C][C]1.5454[/C][C]0.063757[/C][/ROW]
[ROW][C]11[/C][C]0.230959[/C][C]1.789[/C][C]0.039331[/C][/ROW]
[ROW][C]12[/C][C]0.204744[/C][C]1.5859[/C][C]0.059005[/C][/ROW]
[ROW][C]13[/C][C]0.019226[/C][C]0.1489[/C][C]0.441056[/C][/ROW]
[ROW][C]14[/C][C]0.120688[/C][C]0.9348[/C][C]0.176807[/C][/ROW]
[ROW][C]15[/C][C]0.005046[/C][C]0.0391[/C][C]0.484475[/C][/ROW]
[ROW][C]16[/C][C]-0.078113[/C][C]-0.6051[/C][C]0.27371[/C][/ROW]
[ROW][C]17[/C][C]-0.061731[/C][C]-0.4782[/C][C]0.317135[/C][/ROW]
[ROW][C]18[/C][C]-0.13338[/C][C]-1.0332[/C][C]0.152839[/C][/ROW]
[ROW][C]19[/C][C]-0.269848[/C][C]-2.0902[/C][C]0.020421[/C][/ROW]
[ROW][C]20[/C][C]-0.217077[/C][C]-1.6815[/C][C]0.048935[/C][/ROW]
[ROW][C]21[/C][C]-0.255064[/C][C]-1.9757[/C][C]0.026395[/C][/ROW]
[ROW][C]22[/C][C]-0.350881[/C][C]-2.7179[/C][C]0.004288[/C][/ROW]
[ROW][C]23[/C][C]-0.30419[/C][C]-2.3562[/C][C]0.010872[/C][/ROW]
[ROW][C]24[/C][C]-0.350302[/C][C]-2.7134[/C][C]0.004339[/C][/ROW]
[ROW][C]25[/C][C]-0.409015[/C][C]-3.1682[/C][C]0.001207[/C][/ROW]
[ROW][C]26[/C][C]-0.324423[/C][C]-2.513[/C][C]0.007338[/C][/ROW]
[ROW][C]27[/C][C]-0.402871[/C][C]-3.1206[/C][C]0.001387[/C][/ROW]
[ROW][C]28[/C][C]-0.425325[/C][C]-3.2946[/C][C]0.000829[/C][/ROW]
[ROW][C]29[/C][C]-0.329389[/C][C]-2.5514[/C][C]0.006647[/C][/ROW]
[ROW][C]30[/C][C]-0.38263[/C][C]-2.9638[/C][C]0.002176[/C][/ROW]
[ROW][C]31[/C][C]-0.347168[/C][C]-2.6892[/C][C]0.004631[/C][/ROW]
[ROW][C]32[/C][C]-0.222874[/C][C]-1.7264[/C][C]0.044713[/C][/ROW]
[ROW][C]33[/C][C]-0.271606[/C][C]-2.1038[/C][C]0.019796[/C][/ROW]
[ROW][C]34[/C][C]-0.23365[/C][C]-1.8098[/C][C]0.037665[/C][/ROW]
[ROW][C]35[/C][C]-0.143099[/C][C]-1.1084[/C][C]0.136047[/C][/ROW]
[ROW][C]36[/C][C]-0.179454[/C][C]-1.39[/C][C]0.084825[/C][/ROW]
[ROW][C]37[/C][C]-0.14856[/C][C]-1.1507[/C][C]0.127203[/C][/ROW]
[ROW][C]38[/C][C]-0.099628[/C][C]-0.7717[/C][C]0.221656[/C][/ROW]
[ROW][C]39[/C][C]-0.158569[/C][C]-1.2283[/C][C]0.112071[/C][/ROW]
[ROW][C]40[/C][C]-0.075718[/C][C]-0.5865[/C][C]0.279867[/C][/ROW]
[ROW][C]41[/C][C]-0.086085[/C][C]-0.6668[/C][C]0.253724[/C][/ROW]
[ROW][C]42[/C][C]-0.090527[/C][C]-0.7012[/C][C]0.242938[/C][/ROW]
[ROW][C]43[/C][C]-0.037596[/C][C]-0.2912[/C][C]0.385943[/C][/ROW]
[ROW][C]44[/C][C]-0.035293[/C][C]-0.2734[/C][C]0.392751[/C][/ROW]
[ROW][C]45[/C][C]-0.034032[/C][C]-0.2636[/C][C]0.396492[/C][/ROW]
[ROW][C]46[/C][C]0.027125[/C][C]0.2101[/C][C]0.417146[/C][/ROW]
[ROW][C]47[/C][C]0.03021[/C][C]0.234[/C][C]0.407889[/C][/ROW]
[ROW][C]48[/C][C]0.055283[/C][C]0.4282[/C][C]0.335013[/C][/ROW]
[/TABLE]
Source: https://freestatistics.org/blog/index.php?pk=&T=1

Globally Unique Identifier (entire table): ba.freestatistics.org/blog/index.php?pk=&T=1

As an alternative you can also use a QR Code:  

The GUIDs for individual cells are displayed in the table below:

Autocorrelation Function
Time lag kACF(k)T-STATP-value
10.628294.86674e-06
20.6518555.04922e-06
30.6916375.35741e-06
40.5514584.27163.5e-05
50.4721273.65710.00027
60.5121693.96729.8e-05
70.3077582.38390.010156
80.3628992.8110.003331
90.3154082.44310.00876
100.1995071.54540.063757
110.2309591.7890.039331
120.2047441.58590.059005
130.0192260.14890.441056
140.1206880.93480.176807
150.0050460.03910.484475
16-0.078113-0.60510.27371
17-0.061731-0.47820.317135
18-0.13338-1.03320.152839
19-0.269848-2.09020.020421
20-0.217077-1.68150.048935
21-0.255064-1.97570.026395
22-0.350881-2.71790.004288
23-0.30419-2.35620.010872
24-0.350302-2.71340.004339
25-0.409015-3.16820.001207
26-0.324423-2.5130.007338
27-0.402871-3.12060.001387
28-0.425325-3.29460.000829
29-0.329389-2.55140.006647
30-0.38263-2.96380.002176
31-0.347168-2.68920.004631
32-0.222874-1.72640.044713
33-0.271606-2.10380.019796
34-0.23365-1.80980.037665
35-0.143099-1.10840.136047
36-0.179454-1.390.084825
37-0.14856-1.15070.127203
38-0.099628-0.77170.221656
39-0.158569-1.22830.112071
40-0.075718-0.58650.279867
41-0.086085-0.66680.253724
42-0.090527-0.70120.242938
43-0.037596-0.29120.385943
44-0.035293-0.27340.392751
45-0.034032-0.26360.396492
460.0271250.21010.417146
470.030210.2340.407889
480.0552830.42820.335013


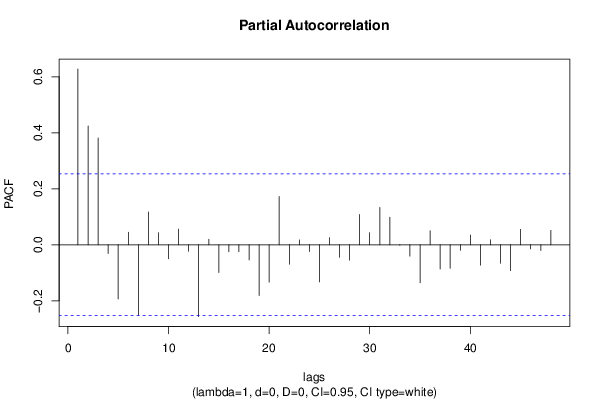
Partial Autocorrelation Function
Time lag kPACF(k)T-STATP-value
10.628294.86674e-06
20.4247943.29040.000839
30.3813562.9540.002238
4-0.030953-0.23980.405666
5-0.193942-1.50230.069136
60.0449120.34790.364572
7-0.251432-1.94760.028074
80.1170330.90650.184139
90.0431520.33430.369677
10-0.050068-0.38780.349759
110.0560650.43430.332824
12-0.022859-0.17710.430026
13-0.256667-1.98810.025682
140.0197830.15320.439363
15-0.098726-0.76470.223716
16-0.024685-0.19120.424503
17-0.02465-0.19090.424609
18-0.054608-0.4230.336905
19-0.18106-1.40250.082962
20-0.133282-1.03240.153014
210.1728561.33890.092821
22-0.069338-0.53710.296595
230.017540.13590.446191
24-0.024152-0.18710.426115
25-0.132515-1.02650.154399
260.0258260.20.42106
27-0.044696-0.34620.365197
28-0.054709-0.42380.336622
290.1081340.83760.202789
300.0433120.33550.369212
310.1332251.0320.153117
320.0987270.76470.223714
33-0.001644-0.01270.494942
34-0.040604-0.31450.377109
35-0.135355-1.04850.149316
360.0503370.38990.348992
37-0.086238-0.6680.253348
38-0.084053-0.65110.258744
39-0.019447-0.15060.440385
400.0352540.27310.392866
41-0.072702-0.56320.287716
420.0179930.13940.444811
43-0.066064-0.51170.305359
44-0.092297-0.71490.238712
450.0552030.42760.335236
46-0.014517-0.11250.45542
47-0.020249-0.15680.437946
480.0516230.39990.345337

\begin{tabular}{lllllllll}
\hline
Partial Autocorrelation Function \tabularnewline
Time lag k & PACF(k) & T-STAT & P-value \tabularnewline
1 & 0.62829 & 4.8667 & 4e-06 \tabularnewline
2 & 0.424794 & 3.2904 & 0.000839 \tabularnewline
3 & 0.381356 & 2.954 & 0.002238 \tabularnewline
4 & -0.030953 & -0.2398 & 0.405666 \tabularnewline
5 & -0.193942 & -1.5023 & 0.069136 \tabularnewline
6 & 0.044912 & 0.3479 & 0.364572 \tabularnewline
7 & -0.251432 & -1.9476 & 0.028074 \tabularnewline
8 & 0.117033 & 0.9065 & 0.184139 \tabularnewline
9 & 0.043152 & 0.3343 & 0.369677 \tabularnewline
10 & -0.050068 & -0.3878 & 0.349759 \tabularnewline
11 & 0.056065 & 0.4343 & 0.332824 \tabularnewline
12 & -0.022859 & -0.1771 & 0.430026 \tabularnewline
13 & -0.256667 & -1.9881 & 0.025682 \tabularnewline
14 & 0.019783 & 0.1532 & 0.439363 \tabularnewline
15 & -0.098726 & -0.7647 & 0.223716 \tabularnewline
16 & -0.024685 & -0.1912 & 0.424503 \tabularnewline
17 & -0.02465 & -0.1909 & 0.424609 \tabularnewline
18 & -0.054608 & -0.423 & 0.336905 \tabularnewline
19 & -0.18106 & -1.4025 & 0.082962 \tabularnewline
20 & -0.133282 & -1.0324 & 0.153014 \tabularnewline
21 & 0.172856 & 1.3389 & 0.092821 \tabularnewline
22 & -0.069338 & -0.5371 & 0.296595 \tabularnewline
23 & 0.01754 & 0.1359 & 0.446191 \tabularnewline
24 & -0.024152 & -0.1871 & 0.426115 \tabularnewline
25 & -0.132515 & -1.0265 & 0.154399 \tabularnewline
26 & 0.025826 & 0.2 & 0.42106 \tabularnewline
27 & -0.044696 & -0.3462 & 0.365197 \tabularnewline
28 & -0.054709 & -0.4238 & 0.336622 \tabularnewline
29 & 0.108134 & 0.8376 & 0.202789 \tabularnewline
30 & 0.043312 & 0.3355 & 0.369212 \tabularnewline
31 & 0.133225 & 1.032 & 0.153117 \tabularnewline
32 & 0.098727 & 0.7647 & 0.223714 \tabularnewline
33 & -0.001644 & -0.0127 & 0.494942 \tabularnewline
34 & -0.040604 & -0.3145 & 0.377109 \tabularnewline
35 & -0.135355 & -1.0485 & 0.149316 \tabularnewline
36 & 0.050337 & 0.3899 & 0.348992 \tabularnewline
37 & -0.086238 & -0.668 & 0.253348 \tabularnewline
38 & -0.084053 & -0.6511 & 0.258744 \tabularnewline
39 & -0.019447 & -0.1506 & 0.440385 \tabularnewline
40 & 0.035254 & 0.2731 & 0.392866 \tabularnewline
41 & -0.072702 & -0.5632 & 0.287716 \tabularnewline
42 & 0.017993 & 0.1394 & 0.444811 \tabularnewline
43 & -0.066064 & -0.5117 & 0.305359 \tabularnewline
44 & -0.092297 & -0.7149 & 0.238712 \tabularnewline
45 & 0.055203 & 0.4276 & 0.335236 \tabularnewline
46 & -0.014517 & -0.1125 & 0.45542 \tabularnewline
47 & -0.020249 & -0.1568 & 0.437946 \tabularnewline
48 & 0.051623 & 0.3999 & 0.345337 \tabularnewline
\hline
\end{tabular}
%Source: https://freestatistics.org/blog/index.php?pk=&T=2

[TABLE]
[ROW][C]Partial Autocorrelation Function[/C][/ROW]
[ROW][C]Time lag k[/C][C]PACF(k)[/C][C]T-STAT[/C][C]P-value[/C][/ROW]
[ROW][C]1[/C][C]0.62829[/C][C]4.8667[/C][C]4e-06[/C][/ROW]
[ROW][C]2[/C][C]0.424794[/C][C]3.2904[/C][C]0.000839[/C][/ROW]
[ROW][C]3[/C][C]0.381356[/C][C]2.954[/C][C]0.002238[/C][/ROW]
[ROW][C]4[/C][C]-0.030953[/C][C]-0.2398[/C][C]0.405666[/C][/ROW]
[ROW][C]5[/C][C]-0.193942[/C][C]-1.5023[/C][C]0.069136[/C][/ROW]
[ROW][C]6[/C][C]0.044912[/C][C]0.3479[/C][C]0.364572[/C][/ROW]
[ROW][C]7[/C][C]-0.251432[/C][C]-1.9476[/C][C]0.028074[/C][/ROW]
[ROW][C]8[/C][C]0.117033[/C][C]0.9065[/C][C]0.184139[/C][/ROW]
[ROW][C]9[/C][C]0.043152[/C][C]0.3343[/C][C]0.369677[/C][/ROW]
[ROW][C]10[/C][C]-0.050068[/C][C]-0.3878[/C][C]0.349759[/C][/ROW]
[ROW][C]11[/C][C]0.056065[/C][C]0.4343[/C][C]0.332824[/C][/ROW]
[ROW][C]12[/C][C]-0.022859[/C][C]-0.1771[/C][C]0.430026[/C][/ROW]
[ROW][C]13[/C][C]-0.256667[/C][C]-1.9881[/C][C]0.025682[/C][/ROW]
[ROW][C]14[/C][C]0.019783[/C][C]0.1532[/C][C]0.439363[/C][/ROW]
[ROW][C]15[/C][C]-0.098726[/C][C]-0.7647[/C][C]0.223716[/C][/ROW]
[ROW][C]16[/C][C]-0.024685[/C][C]-0.1912[/C][C]0.424503[/C][/ROW]
[ROW][C]17[/C][C]-0.02465[/C][C]-0.1909[/C][C]0.424609[/C][/ROW]
[ROW][C]18[/C][C]-0.054608[/C][C]-0.423[/C][C]0.336905[/C][/ROW]
[ROW][C]19[/C][C]-0.18106[/C][C]-1.4025[/C][C]0.082962[/C][/ROW]
[ROW][C]20[/C][C]-0.133282[/C][C]-1.0324[/C][C]0.153014[/C][/ROW]
[ROW][C]21[/C][C]0.172856[/C][C]1.3389[/C][C]0.092821[/C][/ROW]
[ROW][C]22[/C][C]-0.069338[/C][C]-0.5371[/C][C]0.296595[/C][/ROW]
[ROW][C]23[/C][C]0.01754[/C][C]0.1359[/C][C]0.446191[/C][/ROW]
[ROW][C]24[/C][C]-0.024152[/C][C]-0.1871[/C][C]0.426115[/C][/ROW]
[ROW][C]25[/C][C]-0.132515[/C][C]-1.0265[/C][C]0.154399[/C][/ROW]
[ROW][C]26[/C][C]0.025826[/C][C]0.2[/C][C]0.42106[/C][/ROW]
[ROW][C]27[/C][C]-0.044696[/C][C]-0.3462[/C][C]0.365197[/C][/ROW]
[ROW][C]28[/C][C]-0.054709[/C][C]-0.4238[/C][C]0.336622[/C][/ROW]
[ROW][C]29[/C][C]0.108134[/C][C]0.8376[/C][C]0.202789[/C][/ROW]
[ROW][C]30[/C][C]0.043312[/C][C]0.3355[/C][C]0.369212[/C][/ROW]
[ROW][C]31[/C][C]0.133225[/C][C]1.032[/C][C]0.153117[/C][/ROW]
[ROW][C]32[/C][C]0.098727[/C][C]0.7647[/C][C]0.223714[/C][/ROW]
[ROW][C]33[/C][C]-0.001644[/C][C]-0.0127[/C][C]0.494942[/C][/ROW]
[ROW][C]34[/C][C]-0.040604[/C][C]-0.3145[/C][C]0.377109[/C][/ROW]
[ROW][C]35[/C][C]-0.135355[/C][C]-1.0485[/C][C]0.149316[/C][/ROW]
[ROW][C]36[/C][C]0.050337[/C][C]0.3899[/C][C]0.348992[/C][/ROW]
[ROW][C]37[/C][C]-0.086238[/C][C]-0.668[/C][C]0.253348[/C][/ROW]
[ROW][C]38[/C][C]-0.084053[/C][C]-0.6511[/C][C]0.258744[/C][/ROW]
[ROW][C]39[/C][C]-0.019447[/C][C]-0.1506[/C][C]0.440385[/C][/ROW]
[ROW][C]40[/C][C]0.035254[/C][C]0.2731[/C][C]0.392866[/C][/ROW]
[ROW][C]41[/C][C]-0.072702[/C][C]-0.5632[/C][C]0.287716[/C][/ROW]
[ROW][C]42[/C][C]0.017993[/C][C]0.1394[/C][C]0.444811[/C][/ROW]
[ROW][C]43[/C][C]-0.066064[/C][C]-0.5117[/C][C]0.305359[/C][/ROW]
[ROW][C]44[/C][C]-0.092297[/C][C]-0.7149[/C][C]0.238712[/C][/ROW]
[ROW][C]45[/C][C]0.055203[/C][C]0.4276[/C][C]0.335236[/C][/ROW]
[ROW][C]46[/C][C]-0.014517[/C][C]-0.1125[/C][C]0.45542[/C][/ROW]
[ROW][C]47[/C][C]-0.020249[/C][C]-0.1568[/C][C]0.437946[/C][/ROW]
[ROW][C]48[/C][C]0.051623[/C][C]0.3999[/C][C]0.345337[/C][/ROW]
[/TABLE]
Source: https://freestatistics.org/blog/index.php?pk=&T=2

Globally Unique Identifier (entire table): ba.freestatistics.org/blog/index.php?pk=&T=2

As an alternative you can also use a QR Code:  

The GUIDs for individual cells are displayed in the table below:

Partial Autocorrelation Function
Time lag kPACF(k)T-STATP-value
10.628294.86674e-06
20.4247943.29040.000839
30.3813562.9540.002238
4-0.030953-0.23980.405666
5-0.193942-1.50230.069136
60.0449120.34790.364572
7-0.251432-1.94760.028074
80.1170330.90650.184139
90.0431520.33430.369677
10-0.050068-0.38780.349759
110.0560650.43430.332824
12-0.022859-0.17710.430026
13-0.256667-1.98810.025682
140.0197830.15320.439363
15-0.098726-0.76470.223716
16-0.024685-0.19120.424503
17-0.02465-0.19090.424609
18-0.054608-0.4230.336905
19-0.18106-1.40250.082962
20-0.133282-1.03240.153014
210.1728561.33890.092821
22-0.069338-0.53710.296595
230.017540.13590.446191
24-0.024152-0.18710.426115
25-0.132515-1.02650.154399
260.0258260.20.42106
27-0.044696-0.34620.365197
28-0.054709-0.42380.336622
290.1081340.83760.202789
300.0433120.33550.369212
310.1332251.0320.153117
320.0987270.76470.223714
33-0.001644-0.01270.494942
34-0.040604-0.31450.377109
35-0.135355-1.04850.149316
360.0503370.38990.348992
37-0.086238-0.6680.253348
38-0.084053-0.65110.258744
39-0.019447-0.15060.440385
400.0352540.27310.392866
41-0.072702-0.56320.287716
420.0179930.13940.444811
43-0.066064-0.51170.305359
44-0.092297-0.71490.238712
450.0552030.42760.335236
46-0.014517-0.11250.45542
47-0.020249-0.15680.437946
480.0516230.39990.345337


Parameters (Session):
par1 = 48 ; par2 = 1 ; par3 = 0 ; par4 = 0 ; par5 = 12 ; par6 = White Noise ; par7 = 0.95 ;
Parameters (R input):
par1 = 48 ; par2 = 1 ; par3 = 0 ; par4 = 0 ; par5 = 12 ; par6 = White Noise ; par7 = 0.95 ; par8 = ;
R code (references can be found in the software module):
if (par1 == 'Default') {
par1 = 10*log10(length(x))
} else {
par1 <- as.numeric(par1)
}
par2 <- as.numeric(par2)
par3 <- as.numeric(par3)
par4 <- as.numeric(par4)
par5 <- as.numeric(par5)
if (par6 == 'White Noise') par6 <- 'white' else par6 <- 'ma'
par7 <- as.numeric(par7)
if (par8 != '') par8 <- as.numeric(par8)
x <- na.omit(x)
ox <- x
if (par8 == '') {
if (par2 == 0) {
x <- log(x)
} else {
x <- (x ^ par2 - 1) / par2
}
} else {
x <- log(x,base=par8)
}
if (par3 > 0) x <- diff(x,lag=1,difference=par3)
if (par4 > 0) x <- diff(x,lag=par5,difference=par4)
bitmap(file='picts.png')
op <- par(mfrow=c(2,1))
plot(ox,type='l',main='Original Time Series',xlab='time',ylab='value')
if (par8=='') {
mytitle <- paste('Working Time Series (lambda=',par2,', d=',par3,', D=',par4,')',sep='')
mysub <- paste('(lambda=',par2,', d=',par3,', D=',par4,', CI=', par7, ', CI type=',par6,')',sep='')
} else {
mytitle <- paste('Working Time Series (base=',par8,', d=',par3,', D=',par4,')',sep='')
mysub <- paste('(base=',par8,', d=',par3,', D=',par4,', CI=', par7, ', CI type=',par6,')',sep='')
}
plot(x,type='l', main=mytitle,xlab='time',ylab='value')
par(op)
dev.off()
bitmap(file='pic1.png')
racf <- acf(x, par1, main='Autocorrelation', xlab='time lag', ylab='ACF', ci.type=par6, ci=par7, sub=mysub)
dev.off()
bitmap(file='pic2.png')
rpacf <- pacf(x,par1,main='Partial Autocorrelation',xlab='lags',ylab='PACF',sub=mysub)
dev.off()
(myacf <- c(racf$acf))
(mypacf <- c(rpacf$acf))
lengthx <- length(x)
sqrtn <- sqrt(lengthx)
load(file='createtable')
a<-table.start()
a<-table.row.start(a)
a<-table.element(a,'Autocorrelation Function',4,TRUE)
a<-table.row.end(a)
a<-table.row.start(a)
a<-table.element(a,'Time lag k',header=TRUE)
a<-table.element(a,hyperlink('basics.htm','ACF(k)','click here for more information about the Autocorrelation Function'),header=TRUE)
a<-table.element(a,'T-STAT',header=TRUE)
a<-table.element(a,'P-value',header=TRUE)
a<-table.row.end(a)
for (i in 2:(par1+1)) {
a<-table.row.start(a)
a<-table.element(a,i-1,header=TRUE)
a<-table.element(a,round(myacf[i],6))
mytstat <- myacf[i]*sqrtn
a<-table.element(a,round(mytstat,4))
a<-table.element(a,round(1-pt(abs(mytstat),lengthx),6))
a<-table.row.end(a)
}
a<-table.end(a)
table.save(a,file='mytable.tab')
a<-table.start()
a<-table.row.start(a)
a<-table.element(a,'Partial Autocorrelation Function',4,TRUE)
a<-table.row.end(a)
a<-table.row.start(a)
a<-table.element(a,'Time lag k',header=TRUE)
a<-table.element(a,hyperlink('basics.htm','PACF(k)','click here for more information about the Partial Autocorrelation Function'),header=TRUE)
a<-table.element(a,'T-STAT',header=TRUE)
a<-table.element(a,'P-value',header=TRUE)
a<-table.row.end(a)
for (i in 1:par1) {
a<-table.row.start(a)
a<-table.element(a,i,header=TRUE)
a<-table.element(a,round(mypacf[i],6))
mytstat <- mypacf[i]*sqrtn
a<-table.element(a,round(mytstat,4))
a<-table.element(a,round(1-pt(abs(mytstat),lengthx),6))
a<-table.row.end(a)
}
a<-table.end(a)
table.save(a,file='mytable1.tab')