Free Statistics

of Irreproducible Research!

Author's title

Author*Unverified author*
R Software Modulerwasp_autocorrelation.wasp
Title produced by software(Partial) Autocorrelation Function
Date of computationWed, 19 Oct 2016 14:51:36 +0100
Cite this page as followsStatistical Computations at FreeStatistics.org, Office for Research Development and Education, URL https://freestatistics.org/blog/index.php?v=date/2016/Oct/19/t1476885121hgcadsoj7s7dtdz.htm/, Retrieved Tue, 30 Apr 2024 06:07:11 +0200
Statistical Computations at FreeStatistics.org, Office for Research Development and Education, URL https://freestatistics.org/blog/index.php?pk=, Retrieved Tue, 30 Apr 2024 06:07:11 +0200
QR Codes:

Original text written by user:
IsPrivate?No (this computation is public)
User-defined keywords
Estimated Impact0
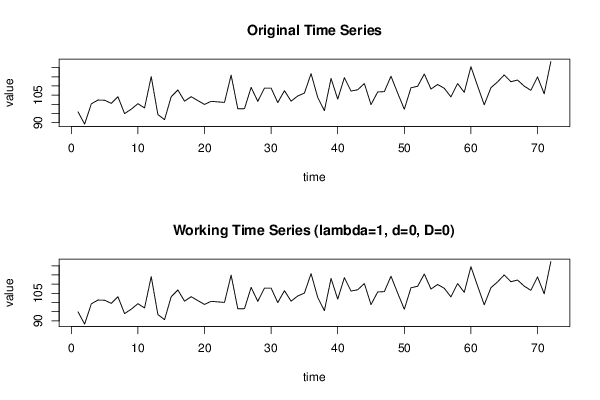
Dataseries X:
95,9
89,2
100,2
102,3
102,2
100,5
104,1
94,9
97,3
100,3
98
115,1
94,4
91,6
104,1
107,8
101,7
104,1
102
99,9
101,6
101,3
101
115,9
97,5
97,6
109,2
101,6
108,8
108,8
100,9
107,4
101,7
104,5
106,1
116,7
103,7
96,5
114,1
102,8
114,5
107,2
107,9
111,3
99,8
106,7
106,9
115,3
106,1
97,3
109
109,8
116,5
108,3
110,8
108,7
104
111,3
106,5
120,5
110
99,7
109
112,2
116
112,3
113,2
109,9
107,6
114,9
105,7
123,3


Summary of computational transaction
Raw Inputview raw input (R code)
Raw Outputview raw output of R engine
Computing time1 seconds
R Server'Gertrude Mary Cox' @ cox.wessa.net

\begin{tabular}{lllllllll}
\hline
Summary of computational transaction \tabularnewline
Raw Input & view raw input (R code)  \tabularnewline
Raw Output & view raw output of R engine  \tabularnewline
Computing time & 1 seconds \tabularnewline
R Server & 'Gertrude Mary Cox' @ cox.wessa.net \tabularnewline
\hline
\end{tabular}
%Source: https://freestatistics.org/blog/index.php?pk=&T=0

[TABLE]
[ROW][C]Summary of computational transaction[/C][/ROW]
[ROW][C]Raw Input[/C][C]view raw input (R code) [/C][/ROW]
[ROW][C]Raw Output[/C][C]view raw output of R engine [/C][/ROW]
[ROW][C]Computing time[/C][C]1 seconds[/C][/ROW]
[ROW][C]R Server[/C][C]'Gertrude Mary Cox' @ cox.wessa.net[/C][/ROW]
[/TABLE]
Source: https://freestatistics.org/blog/index.php?pk=&T=0

Globally Unique Identifier (entire table): ba.freestatistics.org/blog/index.php?pk=&T=0

As an alternative you can also use a QR Code:  

The GUIDs for individual cells are displayed in the table below:

Summary of computational transaction
Raw Inputview raw input (R code)
Raw Outputview raw output of R engine
Computing time1 seconds
R Server'Gertrude Mary Cox' @ cox.wessa.net


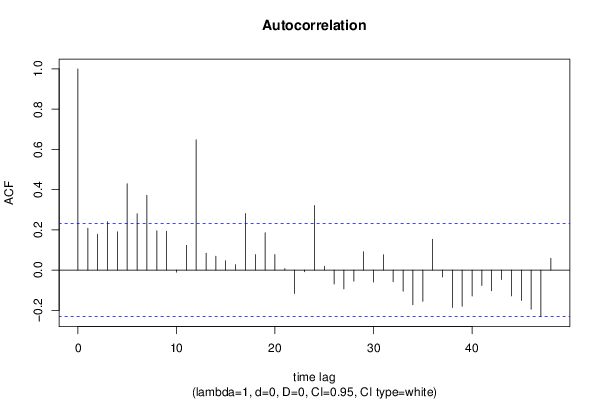
Autocorrelation Function
Time lag kACF(k)T-STATP-value
10.2079691.76470.040929
20.1784021.51380.067229
30.2400962.03730.022649
40.1901041.61310.05555
50.4292043.64190.000253
60.280072.37650.01007
70.3716843.15380.001175
80.1954371.65830.0508
90.1929811.63750.052945
10-0.010268-0.08710.465405
110.1230271.04390.150008
120.6481395.49960
130.0836130.70950.240158
140.069090.58620.279771
150.0466740.3960.346623
160.0270760.22980.409469
170.2814822.38850.009772
180.0768770.65230.258134
190.1857581.57620.05968
200.0768080.65170.258322
210.0074090.06290.475022
22-0.116457-0.98820.16319
23-0.008408-0.07130.47166
240.3214242.72740.004007
250.0192980.16370.435194
26-0.068858-0.58430.28043
27-0.093438-0.79280.215236
28-0.054905-0.46590.321351
290.0909310.77160.221444
30-0.059538-0.50520.307482
310.0760970.64570.260262
32-0.057938-0.49160.312241
33-0.105046-0.89130.187857
34-0.172537-1.4640.07377
35-0.155438-1.31890.095685
360.1532451.30030.098818
37-0.034478-0.29260.385353
38-0.185871-1.57720.059571
39-0.179879-1.52630.065655
40-0.128515-1.09050.139569
41-0.077098-0.65420.257533
42-0.102461-0.86940.193755
43-0.047075-0.39940.345373
44-0.128301-1.08870.139965
45-0.151408-1.28470.101501
46-0.195065-1.65520.051121
47-0.231511-1.96440.02667
480.0592420.50270.30836

\begin{tabular}{lllllllll}
\hline
Autocorrelation Function \tabularnewline
Time lag k & ACF(k) & T-STAT & P-value \tabularnewline
1 & 0.207969 & 1.7647 & 0.040929 \tabularnewline
2 & 0.178402 & 1.5138 & 0.067229 \tabularnewline
3 & 0.240096 & 2.0373 & 0.022649 \tabularnewline
4 & 0.190104 & 1.6131 & 0.05555 \tabularnewline
5 & 0.429204 & 3.6419 & 0.000253 \tabularnewline
6 & 0.28007 & 2.3765 & 0.01007 \tabularnewline
7 & 0.371684 & 3.1538 & 0.001175 \tabularnewline
8 & 0.195437 & 1.6583 & 0.0508 \tabularnewline
9 & 0.192981 & 1.6375 & 0.052945 \tabularnewline
10 & -0.010268 & -0.0871 & 0.465405 \tabularnewline
11 & 0.123027 & 1.0439 & 0.150008 \tabularnewline
12 & 0.648139 & 5.4996 & 0 \tabularnewline
13 & 0.083613 & 0.7095 & 0.240158 \tabularnewline
14 & 0.06909 & 0.5862 & 0.279771 \tabularnewline
15 & 0.046674 & 0.396 & 0.346623 \tabularnewline
16 & 0.027076 & 0.2298 & 0.409469 \tabularnewline
17 & 0.281482 & 2.3885 & 0.009772 \tabularnewline
18 & 0.076877 & 0.6523 & 0.258134 \tabularnewline
19 & 0.185758 & 1.5762 & 0.05968 \tabularnewline
20 & 0.076808 & 0.6517 & 0.258322 \tabularnewline
21 & 0.007409 & 0.0629 & 0.475022 \tabularnewline
22 & -0.116457 & -0.9882 & 0.16319 \tabularnewline
23 & -0.008408 & -0.0713 & 0.47166 \tabularnewline
24 & 0.321424 & 2.7274 & 0.004007 \tabularnewline
25 & 0.019298 & 0.1637 & 0.435194 \tabularnewline
26 & -0.068858 & -0.5843 & 0.28043 \tabularnewline
27 & -0.093438 & -0.7928 & 0.215236 \tabularnewline
28 & -0.054905 & -0.4659 & 0.321351 \tabularnewline
29 & 0.090931 & 0.7716 & 0.221444 \tabularnewline
30 & -0.059538 & -0.5052 & 0.307482 \tabularnewline
31 & 0.076097 & 0.6457 & 0.260262 \tabularnewline
32 & -0.057938 & -0.4916 & 0.312241 \tabularnewline
33 & -0.105046 & -0.8913 & 0.187857 \tabularnewline
34 & -0.172537 & -1.464 & 0.07377 \tabularnewline
35 & -0.155438 & -1.3189 & 0.095685 \tabularnewline
36 & 0.153245 & 1.3003 & 0.098818 \tabularnewline
37 & -0.034478 & -0.2926 & 0.385353 \tabularnewline
38 & -0.185871 & -1.5772 & 0.059571 \tabularnewline
39 & -0.179879 & -1.5263 & 0.065655 \tabularnewline
40 & -0.128515 & -1.0905 & 0.139569 \tabularnewline
41 & -0.077098 & -0.6542 & 0.257533 \tabularnewline
42 & -0.102461 & -0.8694 & 0.193755 \tabularnewline
43 & -0.047075 & -0.3994 & 0.345373 \tabularnewline
44 & -0.128301 & -1.0887 & 0.139965 \tabularnewline
45 & -0.151408 & -1.2847 & 0.101501 \tabularnewline
46 & -0.195065 & -1.6552 & 0.051121 \tabularnewline
47 & -0.231511 & -1.9644 & 0.02667 \tabularnewline
48 & 0.059242 & 0.5027 & 0.30836 \tabularnewline
\hline
\end{tabular}
%Source: https://freestatistics.org/blog/index.php?pk=&T=1

[TABLE]
[ROW][C]Autocorrelation Function[/C][/ROW]
[ROW][C]Time lag k[/C][C]ACF(k)[/C][C]T-STAT[/C][C]P-value[/C][/ROW]
[ROW][C]1[/C][C]0.207969[/C][C]1.7647[/C][C]0.040929[/C][/ROW]
[ROW][C]2[/C][C]0.178402[/C][C]1.5138[/C][C]0.067229[/C][/ROW]
[ROW][C]3[/C][C]0.240096[/C][C]2.0373[/C][C]0.022649[/C][/ROW]
[ROW][C]4[/C][C]0.190104[/C][C]1.6131[/C][C]0.05555[/C][/ROW]
[ROW][C]5[/C][C]0.429204[/C][C]3.6419[/C][C]0.000253[/C][/ROW]
[ROW][C]6[/C][C]0.28007[/C][C]2.3765[/C][C]0.01007[/C][/ROW]
[ROW][C]7[/C][C]0.371684[/C][C]3.1538[/C][C]0.001175[/C][/ROW]
[ROW][C]8[/C][C]0.195437[/C][C]1.6583[/C][C]0.0508[/C][/ROW]
[ROW][C]9[/C][C]0.192981[/C][C]1.6375[/C][C]0.052945[/C][/ROW]
[ROW][C]10[/C][C]-0.010268[/C][C]-0.0871[/C][C]0.465405[/C][/ROW]
[ROW][C]11[/C][C]0.123027[/C][C]1.0439[/C][C]0.150008[/C][/ROW]
[ROW][C]12[/C][C]0.648139[/C][C]5.4996[/C][C]0[/C][/ROW]
[ROW][C]13[/C][C]0.083613[/C][C]0.7095[/C][C]0.240158[/C][/ROW]
[ROW][C]14[/C][C]0.06909[/C][C]0.5862[/C][C]0.279771[/C][/ROW]
[ROW][C]15[/C][C]0.046674[/C][C]0.396[/C][C]0.346623[/C][/ROW]
[ROW][C]16[/C][C]0.027076[/C][C]0.2298[/C][C]0.409469[/C][/ROW]
[ROW][C]17[/C][C]0.281482[/C][C]2.3885[/C][C]0.009772[/C][/ROW]
[ROW][C]18[/C][C]0.076877[/C][C]0.6523[/C][C]0.258134[/C][/ROW]
[ROW][C]19[/C][C]0.185758[/C][C]1.5762[/C][C]0.05968[/C][/ROW]
[ROW][C]20[/C][C]0.076808[/C][C]0.6517[/C][C]0.258322[/C][/ROW]
[ROW][C]21[/C][C]0.007409[/C][C]0.0629[/C][C]0.475022[/C][/ROW]
[ROW][C]22[/C][C]-0.116457[/C][C]-0.9882[/C][C]0.16319[/C][/ROW]
[ROW][C]23[/C][C]-0.008408[/C][C]-0.0713[/C][C]0.47166[/C][/ROW]
[ROW][C]24[/C][C]0.321424[/C][C]2.7274[/C][C]0.004007[/C][/ROW]
[ROW][C]25[/C][C]0.019298[/C][C]0.1637[/C][C]0.435194[/C][/ROW]
[ROW][C]26[/C][C]-0.068858[/C][C]-0.5843[/C][C]0.28043[/C][/ROW]
[ROW][C]27[/C][C]-0.093438[/C][C]-0.7928[/C][C]0.215236[/C][/ROW]
[ROW][C]28[/C][C]-0.054905[/C][C]-0.4659[/C][C]0.321351[/C][/ROW]
[ROW][C]29[/C][C]0.090931[/C][C]0.7716[/C][C]0.221444[/C][/ROW]
[ROW][C]30[/C][C]-0.059538[/C][C]-0.5052[/C][C]0.307482[/C][/ROW]
[ROW][C]31[/C][C]0.076097[/C][C]0.6457[/C][C]0.260262[/C][/ROW]
[ROW][C]32[/C][C]-0.057938[/C][C]-0.4916[/C][C]0.312241[/C][/ROW]
[ROW][C]33[/C][C]-0.105046[/C][C]-0.8913[/C][C]0.187857[/C][/ROW]
[ROW][C]34[/C][C]-0.172537[/C][C]-1.464[/C][C]0.07377[/C][/ROW]
[ROW][C]35[/C][C]-0.155438[/C][C]-1.3189[/C][C]0.095685[/C][/ROW]
[ROW][C]36[/C][C]0.153245[/C][C]1.3003[/C][C]0.098818[/C][/ROW]
[ROW][C]37[/C][C]-0.034478[/C][C]-0.2926[/C][C]0.385353[/C][/ROW]
[ROW][C]38[/C][C]-0.185871[/C][C]-1.5772[/C][C]0.059571[/C][/ROW]
[ROW][C]39[/C][C]-0.179879[/C][C]-1.5263[/C][C]0.065655[/C][/ROW]
[ROW][C]40[/C][C]-0.128515[/C][C]-1.0905[/C][C]0.139569[/C][/ROW]
[ROW][C]41[/C][C]-0.077098[/C][C]-0.6542[/C][C]0.257533[/C][/ROW]
[ROW][C]42[/C][C]-0.102461[/C][C]-0.8694[/C][C]0.193755[/C][/ROW]
[ROW][C]43[/C][C]-0.047075[/C][C]-0.3994[/C][C]0.345373[/C][/ROW]
[ROW][C]44[/C][C]-0.128301[/C][C]-1.0887[/C][C]0.139965[/C][/ROW]
[ROW][C]45[/C][C]-0.151408[/C][C]-1.2847[/C][C]0.101501[/C][/ROW]
[ROW][C]46[/C][C]-0.195065[/C][C]-1.6552[/C][C]0.051121[/C][/ROW]
[ROW][C]47[/C][C]-0.231511[/C][C]-1.9644[/C][C]0.02667[/C][/ROW]
[ROW][C]48[/C][C]0.059242[/C][C]0.5027[/C][C]0.30836[/C][/ROW]
[/TABLE]
Source: https://freestatistics.org/blog/index.php?pk=&T=1

Globally Unique Identifier (entire table): ba.freestatistics.org/blog/index.php?pk=&T=1

As an alternative you can also use a QR Code:  

The GUIDs for individual cells are displayed in the table below:

Autocorrelation Function
Time lag kACF(k)T-STATP-value
10.2079691.76470.040929
20.1784021.51380.067229
30.2400962.03730.022649
40.1901041.61310.05555
50.4292043.64190.000253
60.280072.37650.01007
70.3716843.15380.001175
80.1954371.65830.0508
90.1929811.63750.052945
10-0.010268-0.08710.465405
110.1230271.04390.150008
120.6481395.49960
130.0836130.70950.240158
140.069090.58620.279771
150.0466740.3960.346623
160.0270760.22980.409469
170.2814822.38850.009772
180.0768770.65230.258134
190.1857581.57620.05968
200.0768080.65170.258322
210.0074090.06290.475022
22-0.116457-0.98820.16319
23-0.008408-0.07130.47166
240.3214242.72740.004007
250.0192980.16370.435194
26-0.068858-0.58430.28043
27-0.093438-0.79280.215236
28-0.054905-0.46590.321351
290.0909310.77160.221444
30-0.059538-0.50520.307482
310.0760970.64570.260262
32-0.057938-0.49160.312241
33-0.105046-0.89130.187857
34-0.172537-1.4640.07377
35-0.155438-1.31890.095685
360.1532451.30030.098818
37-0.034478-0.29260.385353
38-0.185871-1.57720.059571
39-0.179879-1.52630.065655
40-0.128515-1.09050.139569
41-0.077098-0.65420.257533
42-0.102461-0.86940.193755
43-0.047075-0.39940.345373
44-0.128301-1.08870.139965
45-0.151408-1.28470.101501
46-0.195065-1.65520.051121
47-0.231511-1.96440.02667
480.0592420.50270.30836


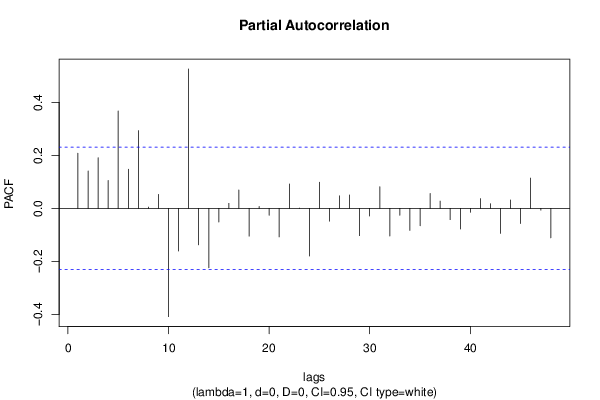
Partial Autocorrelation Function
Time lag kPACF(k)T-STATP-value
10.2079691.76470.040929
20.141261.19860.117301
30.1907491.61860.054957
40.1050320.89120.187887
50.3671983.11580.001317
60.1475931.25240.107244
70.2934342.48990.007544
80.0047530.04030.483972
90.0526740.4470.328125
10-0.408617-3.46720.000445
11-0.160909-1.36540.088195
120.5260544.46371.5e-05
13-0.137691-1.16840.12326
14-0.224364-1.90380.030467
15-0.051366-0.43590.332123
160.0188580.160.436657
170.0695820.59040.278378
18-0.104769-0.8890.188484
190.0068770.05840.476815
20-0.026321-0.22330.41195
21-0.107628-0.91330.182078
220.0917380.77840.219436
23-0.000499-0.00420.498316
24-0.179712-1.52490.065832
250.0986080.83670.202761
26-0.048267-0.40960.341674
270.0471870.40040.345026
280.0502240.42620.33563
29-0.103057-0.87450.192385
30-0.029098-0.24690.402844
310.0818120.69420.244896
32-0.104499-0.88670.189095
33-0.026102-0.22150.41267
34-0.08305-0.70470.241634
35-0.065593-0.55660.289771
360.0562780.47750.317213
370.027440.23280.408274
38-0.042597-0.36150.35941
39-0.077997-0.66180.255098
40-0.01441-0.12230.451513
410.0368070.31230.377852
420.017750.15060.44035
43-0.094517-0.8020.212596
440.0317890.26970.394066
45-0.057284-0.48610.314196
460.1140680.96790.168167
47-0.006615-0.05610.477696
48-0.111286-0.94430.174089

\begin{tabular}{lllllllll}
\hline
Partial Autocorrelation Function \tabularnewline
Time lag k & PACF(k) & T-STAT & P-value \tabularnewline
1 & 0.207969 & 1.7647 & 0.040929 \tabularnewline
2 & 0.14126 & 1.1986 & 0.117301 \tabularnewline
3 & 0.190749 & 1.6186 & 0.054957 \tabularnewline
4 & 0.105032 & 0.8912 & 0.187887 \tabularnewline
5 & 0.367198 & 3.1158 & 0.001317 \tabularnewline
6 & 0.147593 & 1.2524 & 0.107244 \tabularnewline
7 & 0.293434 & 2.4899 & 0.007544 \tabularnewline
8 & 0.004753 & 0.0403 & 0.483972 \tabularnewline
9 & 0.052674 & 0.447 & 0.328125 \tabularnewline
10 & -0.408617 & -3.4672 & 0.000445 \tabularnewline
11 & -0.160909 & -1.3654 & 0.088195 \tabularnewline
12 & 0.526054 & 4.4637 & 1.5e-05 \tabularnewline
13 & -0.137691 & -1.1684 & 0.12326 \tabularnewline
14 & -0.224364 & -1.9038 & 0.030467 \tabularnewline
15 & -0.051366 & -0.4359 & 0.332123 \tabularnewline
16 & 0.018858 & 0.16 & 0.436657 \tabularnewline
17 & 0.069582 & 0.5904 & 0.278378 \tabularnewline
18 & -0.104769 & -0.889 & 0.188484 \tabularnewline
19 & 0.006877 & 0.0584 & 0.476815 \tabularnewline
20 & -0.026321 & -0.2233 & 0.41195 \tabularnewline
21 & -0.107628 & -0.9133 & 0.182078 \tabularnewline
22 & 0.091738 & 0.7784 & 0.219436 \tabularnewline
23 & -0.000499 & -0.0042 & 0.498316 \tabularnewline
24 & -0.179712 & -1.5249 & 0.065832 \tabularnewline
25 & 0.098608 & 0.8367 & 0.202761 \tabularnewline
26 & -0.048267 & -0.4096 & 0.341674 \tabularnewline
27 & 0.047187 & 0.4004 & 0.345026 \tabularnewline
28 & 0.050224 & 0.4262 & 0.33563 \tabularnewline
29 & -0.103057 & -0.8745 & 0.192385 \tabularnewline
30 & -0.029098 & -0.2469 & 0.402844 \tabularnewline
31 & 0.081812 & 0.6942 & 0.244896 \tabularnewline
32 & -0.104499 & -0.8867 & 0.189095 \tabularnewline
33 & -0.026102 & -0.2215 & 0.41267 \tabularnewline
34 & -0.08305 & -0.7047 & 0.241634 \tabularnewline
35 & -0.065593 & -0.5566 & 0.289771 \tabularnewline
36 & 0.056278 & 0.4775 & 0.317213 \tabularnewline
37 & 0.02744 & 0.2328 & 0.408274 \tabularnewline
38 & -0.042597 & -0.3615 & 0.35941 \tabularnewline
39 & -0.077997 & -0.6618 & 0.255098 \tabularnewline
40 & -0.01441 & -0.1223 & 0.451513 \tabularnewline
41 & 0.036807 & 0.3123 & 0.377852 \tabularnewline
42 & 0.01775 & 0.1506 & 0.44035 \tabularnewline
43 & -0.094517 & -0.802 & 0.212596 \tabularnewline
44 & 0.031789 & 0.2697 & 0.394066 \tabularnewline
45 & -0.057284 & -0.4861 & 0.314196 \tabularnewline
46 & 0.114068 & 0.9679 & 0.168167 \tabularnewline
47 & -0.006615 & -0.0561 & 0.477696 \tabularnewline
48 & -0.111286 & -0.9443 & 0.174089 \tabularnewline
\hline
\end{tabular}
%Source: https://freestatistics.org/blog/index.php?pk=&T=2

[TABLE]
[ROW][C]Partial Autocorrelation Function[/C][/ROW]
[ROW][C]Time lag k[/C][C]PACF(k)[/C][C]T-STAT[/C][C]P-value[/C][/ROW]
[ROW][C]1[/C][C]0.207969[/C][C]1.7647[/C][C]0.040929[/C][/ROW]
[ROW][C]2[/C][C]0.14126[/C][C]1.1986[/C][C]0.117301[/C][/ROW]
[ROW][C]3[/C][C]0.190749[/C][C]1.6186[/C][C]0.054957[/C][/ROW]
[ROW][C]4[/C][C]0.105032[/C][C]0.8912[/C][C]0.187887[/C][/ROW]
[ROW][C]5[/C][C]0.367198[/C][C]3.1158[/C][C]0.001317[/C][/ROW]
[ROW][C]6[/C][C]0.147593[/C][C]1.2524[/C][C]0.107244[/C][/ROW]
[ROW][C]7[/C][C]0.293434[/C][C]2.4899[/C][C]0.007544[/C][/ROW]
[ROW][C]8[/C][C]0.004753[/C][C]0.0403[/C][C]0.483972[/C][/ROW]
[ROW][C]9[/C][C]0.052674[/C][C]0.447[/C][C]0.328125[/C][/ROW]
[ROW][C]10[/C][C]-0.408617[/C][C]-3.4672[/C][C]0.000445[/C][/ROW]
[ROW][C]11[/C][C]-0.160909[/C][C]-1.3654[/C][C]0.088195[/C][/ROW]
[ROW][C]12[/C][C]0.526054[/C][C]4.4637[/C][C]1.5e-05[/C][/ROW]
[ROW][C]13[/C][C]-0.137691[/C][C]-1.1684[/C][C]0.12326[/C][/ROW]
[ROW][C]14[/C][C]-0.224364[/C][C]-1.9038[/C][C]0.030467[/C][/ROW]
[ROW][C]15[/C][C]-0.051366[/C][C]-0.4359[/C][C]0.332123[/C][/ROW]
[ROW][C]16[/C][C]0.018858[/C][C]0.16[/C][C]0.436657[/C][/ROW]
[ROW][C]17[/C][C]0.069582[/C][C]0.5904[/C][C]0.278378[/C][/ROW]
[ROW][C]18[/C][C]-0.104769[/C][C]-0.889[/C][C]0.188484[/C][/ROW]
[ROW][C]19[/C][C]0.006877[/C][C]0.0584[/C][C]0.476815[/C][/ROW]
[ROW][C]20[/C][C]-0.026321[/C][C]-0.2233[/C][C]0.41195[/C][/ROW]
[ROW][C]21[/C][C]-0.107628[/C][C]-0.9133[/C][C]0.182078[/C][/ROW]
[ROW][C]22[/C][C]0.091738[/C][C]0.7784[/C][C]0.219436[/C][/ROW]
[ROW][C]23[/C][C]-0.000499[/C][C]-0.0042[/C][C]0.498316[/C][/ROW]
[ROW][C]24[/C][C]-0.179712[/C][C]-1.5249[/C][C]0.065832[/C][/ROW]
[ROW][C]25[/C][C]0.098608[/C][C]0.8367[/C][C]0.202761[/C][/ROW]
[ROW][C]26[/C][C]-0.048267[/C][C]-0.4096[/C][C]0.341674[/C][/ROW]
[ROW][C]27[/C][C]0.047187[/C][C]0.4004[/C][C]0.345026[/C][/ROW]
[ROW][C]28[/C][C]0.050224[/C][C]0.4262[/C][C]0.33563[/C][/ROW]
[ROW][C]29[/C][C]-0.103057[/C][C]-0.8745[/C][C]0.192385[/C][/ROW]
[ROW][C]30[/C][C]-0.029098[/C][C]-0.2469[/C][C]0.402844[/C][/ROW]
[ROW][C]31[/C][C]0.081812[/C][C]0.6942[/C][C]0.244896[/C][/ROW]
[ROW][C]32[/C][C]-0.104499[/C][C]-0.8867[/C][C]0.189095[/C][/ROW]
[ROW][C]33[/C][C]-0.026102[/C][C]-0.2215[/C][C]0.41267[/C][/ROW]
[ROW][C]34[/C][C]-0.08305[/C][C]-0.7047[/C][C]0.241634[/C][/ROW]
[ROW][C]35[/C][C]-0.065593[/C][C]-0.5566[/C][C]0.289771[/C][/ROW]
[ROW][C]36[/C][C]0.056278[/C][C]0.4775[/C][C]0.317213[/C][/ROW]
[ROW][C]37[/C][C]0.02744[/C][C]0.2328[/C][C]0.408274[/C][/ROW]
[ROW][C]38[/C][C]-0.042597[/C][C]-0.3615[/C][C]0.35941[/C][/ROW]
[ROW][C]39[/C][C]-0.077997[/C][C]-0.6618[/C][C]0.255098[/C][/ROW]
[ROW][C]40[/C][C]-0.01441[/C][C]-0.1223[/C][C]0.451513[/C][/ROW]
[ROW][C]41[/C][C]0.036807[/C][C]0.3123[/C][C]0.377852[/C][/ROW]
[ROW][C]42[/C][C]0.01775[/C][C]0.1506[/C][C]0.44035[/C][/ROW]
[ROW][C]43[/C][C]-0.094517[/C][C]-0.802[/C][C]0.212596[/C][/ROW]
[ROW][C]44[/C][C]0.031789[/C][C]0.2697[/C][C]0.394066[/C][/ROW]
[ROW][C]45[/C][C]-0.057284[/C][C]-0.4861[/C][C]0.314196[/C][/ROW]
[ROW][C]46[/C][C]0.114068[/C][C]0.9679[/C][C]0.168167[/C][/ROW]
[ROW][C]47[/C][C]-0.006615[/C][C]-0.0561[/C][C]0.477696[/C][/ROW]
[ROW][C]48[/C][C]-0.111286[/C][C]-0.9443[/C][C]0.174089[/C][/ROW]
[/TABLE]
Source: https://freestatistics.org/blog/index.php?pk=&T=2

Globally Unique Identifier (entire table): ba.freestatistics.org/blog/index.php?pk=&T=2

As an alternative you can also use a QR Code:  

The GUIDs for individual cells are displayed in the table below:

Partial Autocorrelation Function
Time lag kPACF(k)T-STATP-value
10.2079691.76470.040929
20.141261.19860.117301
30.1907491.61860.054957
40.1050320.89120.187887
50.3671983.11580.001317
60.1475931.25240.107244
70.2934342.48990.007544
80.0047530.04030.483972
90.0526740.4470.328125
10-0.408617-3.46720.000445
11-0.160909-1.36540.088195
120.5260544.46371.5e-05
13-0.137691-1.16840.12326
14-0.224364-1.90380.030467
15-0.051366-0.43590.332123
160.0188580.160.436657
170.0695820.59040.278378
18-0.104769-0.8890.188484
190.0068770.05840.476815
20-0.026321-0.22330.41195
21-0.107628-0.91330.182078
220.0917380.77840.219436
23-0.000499-0.00420.498316
24-0.179712-1.52490.065832
250.0986080.83670.202761
26-0.048267-0.40960.341674
270.0471870.40040.345026
280.0502240.42620.33563
29-0.103057-0.87450.192385
30-0.029098-0.24690.402844
310.0818120.69420.244896
32-0.104499-0.88670.189095
33-0.026102-0.22150.41267
34-0.08305-0.70470.241634
35-0.065593-0.55660.289771
360.0562780.47750.317213
370.027440.23280.408274
38-0.042597-0.36150.35941
39-0.077997-0.66180.255098
40-0.01441-0.12230.451513
410.0368070.31230.377852
420.017750.15060.44035
43-0.094517-0.8020.212596
440.0317890.26970.394066
45-0.057284-0.48610.314196
460.1140680.96790.168167
47-0.006615-0.05610.477696
48-0.111286-0.94430.174089


Parameters (Session):
par1 = 48 ; par2 = 1 ; par3 = 0 ; par4 = 0 ; par5 = 12 ; par6 = White Noise ; par7 = 0.95 ;
Parameters (R input):
par1 = 48 ; par2 = 1 ; par3 = 0 ; par4 = 0 ; par5 = 12 ; par6 = White Noise ; par7 = 0.95 ; par8 = ;
R code (references can be found in the software module):
if (par1 == 'Default') {
par1 = 10*log10(length(x))
} else {
par1 <- as.numeric(par1)
}
par2 <- as.numeric(par2)
par3 <- as.numeric(par3)
par4 <- as.numeric(par4)
par5 <- as.numeric(par5)
if (par6 == 'White Noise') par6 <- 'white' else par6 <- 'ma'
par7 <- as.numeric(par7)
if (par8 != '') par8 <- as.numeric(par8)
x <- na.omit(x)
ox <- x
if (par8 == '') {
if (par2 == 0) {
x <- log(x)
} else {
x <- (x ^ par2 - 1) / par2
}
} else {
x <- log(x,base=par8)
}
if (par3 > 0) x <- diff(x,lag=1,difference=par3)
if (par4 > 0) x <- diff(x,lag=par5,difference=par4)
bitmap(file='picts.png')
op <- par(mfrow=c(2,1))
plot(ox,type='l',main='Original Time Series',xlab='time',ylab='value')
if (par8=='') {
mytitle <- paste('Working Time Series (lambda=',par2,', d=',par3,', D=',par4,')',sep='')
mysub <- paste('(lambda=',par2,', d=',par3,', D=',par4,', CI=', par7, ', CI type=',par6,')',sep='')
} else {
mytitle <- paste('Working Time Series (base=',par8,', d=',par3,', D=',par4,')',sep='')
mysub <- paste('(base=',par8,', d=',par3,', D=',par4,', CI=', par7, ', CI type=',par6,')',sep='')
}
plot(x,type='l', main=mytitle,xlab='time',ylab='value')
par(op)
dev.off()
bitmap(file='pic1.png')
racf <- acf(x, par1, main='Autocorrelation', xlab='time lag', ylab='ACF', ci.type=par6, ci=par7, sub=mysub)
dev.off()
bitmap(file='pic2.png')
rpacf <- pacf(x,par1,main='Partial Autocorrelation',xlab='lags',ylab='PACF',sub=mysub)
dev.off()
(myacf <- c(racf$acf))
(mypacf <- c(rpacf$acf))
lengthx <- length(x)
sqrtn <- sqrt(lengthx)
load(file='createtable')
a<-table.start()
a<-table.row.start(a)
a<-table.element(a,'Autocorrelation Function',4,TRUE)
a<-table.row.end(a)
a<-table.row.start(a)
a<-table.element(a,'Time lag k',header=TRUE)
a<-table.element(a,hyperlink('basics.htm','ACF(k)','click here for more information about the Autocorrelation Function'),header=TRUE)
a<-table.element(a,'T-STAT',header=TRUE)
a<-table.element(a,'P-value',header=TRUE)
a<-table.row.end(a)
for (i in 2:(par1+1)) {
a<-table.row.start(a)
a<-table.element(a,i-1,header=TRUE)
a<-table.element(a,round(myacf[i],6))
mytstat <- myacf[i]*sqrtn
a<-table.element(a,round(mytstat,4))
a<-table.element(a,round(1-pt(abs(mytstat),lengthx),6))
a<-table.row.end(a)
}
a<-table.end(a)
table.save(a,file='mytable.tab')
a<-table.start()
a<-table.row.start(a)
a<-table.element(a,'Partial Autocorrelation Function',4,TRUE)
a<-table.row.end(a)
a<-table.row.start(a)
a<-table.element(a,'Time lag k',header=TRUE)
a<-table.element(a,hyperlink('basics.htm','PACF(k)','click here for more information about the Partial Autocorrelation Function'),header=TRUE)
a<-table.element(a,'T-STAT',header=TRUE)
a<-table.element(a,'P-value',header=TRUE)
a<-table.row.end(a)
for (i in 1:par1) {
a<-table.row.start(a)
a<-table.element(a,i,header=TRUE)
a<-table.element(a,round(mypacf[i],6))
mytstat <- mypacf[i]*sqrtn
a<-table.element(a,round(mytstat,4))
a<-table.element(a,round(1-pt(abs(mytstat),lengthx),6))
a<-table.row.end(a)
}
a<-table.end(a)
table.save(a,file='mytable1.tab')