Free Statistics

of Irreproducible Research!

Author's title

Author*Unverified author*
R Software Modulerwasp_autocorrelation.wasp
Title produced by software(Partial) Autocorrelation Function
Date of computationWed, 19 Oct 2016 14:53:44 +0100
Cite this page as followsStatistical Computations at FreeStatistics.org, Office for Research Development and Education, URL https://freestatistics.org/blog/index.php?v=date/2016/Oct/19/t1476885267rfae7f31vfc6jth.htm/, Retrieved Tue, 30 Apr 2024 09:30:48 +0200
Statistical Computations at FreeStatistics.org, Office for Research Development and Education, URL https://freestatistics.org/blog/index.php?pk=, Retrieved Tue, 30 Apr 2024 09:30:48 +0200
QR Codes:

Original text written by user:
IsPrivate?No (this computation is public)
User-defined keywords
Estimated Impact0
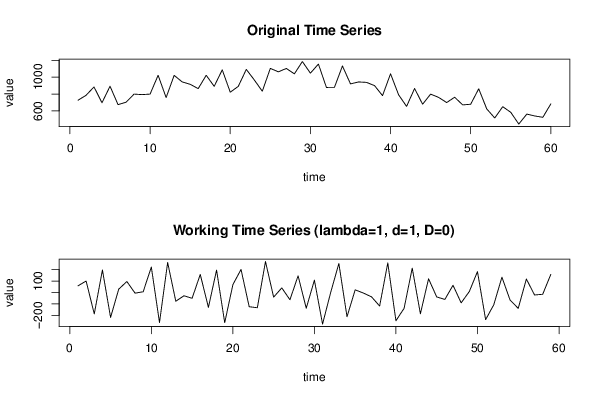
Dataseries X:
726
784
884
696
893
674
703
799
793
799
1022
758
1021
944
915
864
1022
891
1087
822
890
1092
967
833
1104
1063
1103
1039
1185
1047
1155
878
879
1133
920
943
938
900
781
1040
792
653
866
679
799
760
699
762
671
679
862
624
516
650
583
444
562
540
524
683


Summary of computational transaction
Raw Inputview raw input (R code)
Raw Outputview raw output of R engine
Computing time1 seconds
R Server'George Udny Yule' @ yule.wessa.net

\begin{tabular}{lllllllll}
\hline
Summary of computational transaction \tabularnewline
Raw Input & view raw input (R code)  \tabularnewline
Raw Output & view raw output of R engine  \tabularnewline
Computing time & 1 seconds \tabularnewline
R Server & 'George Udny Yule' @ yule.wessa.net \tabularnewline
\hline
\end{tabular}
%Source: https://freestatistics.org/blog/index.php?pk=&T=0

[TABLE]
[ROW][C]Summary of computational transaction[/C][/ROW]
[ROW][C]Raw Input[/C][C]view raw input (R code) [/C][/ROW]
[ROW][C]Raw Output[/C][C]view raw output of R engine [/C][/ROW]
[ROW][C]Computing time[/C][C]1 seconds[/C][/ROW]
[ROW][C]R Server[/C][C]'George Udny Yule' @ yule.wessa.net[/C][/ROW]
[/TABLE]
Source: https://freestatistics.org/blog/index.php?pk=&T=0

Globally Unique Identifier (entire table): ba.freestatistics.org/blog/index.php?pk=&T=0

As an alternative you can also use a QR Code:  

The GUIDs for individual cells are displayed in the table below:

Summary of computational transaction
Raw Inputview raw input (R code)
Raw Outputview raw output of R engine
Computing time1 seconds
R Server'George Udny Yule' @ yule.wessa.net


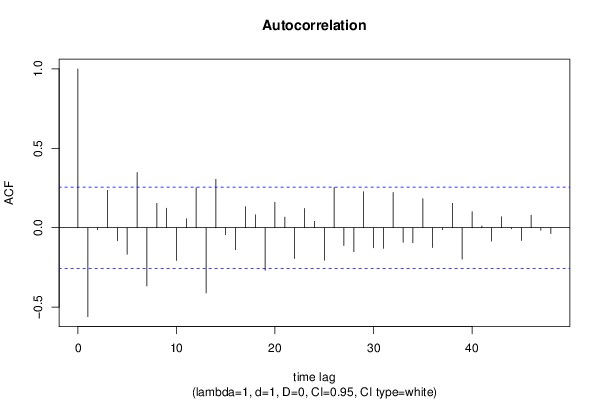
Autocorrelation Function
Time lag kACF(k)T-STATP-value
1-0.559905-4.30073.2e-05
2-0.012405-0.09530.462205
30.2354791.80870.037793
4-0.081494-0.6260.266877
5-0.167287-1.2850.101915
60.3479522.67270.004857
7-0.366293-2.81360.003323
80.1536931.18050.121263
90.122510.9410.175266
10-0.206312-1.58470.059189
110.0566850.43540.332428
120.2524591.93920.028634
13-0.410439-3.15260.001272
140.3045642.33940.01136
15-0.044695-0.34330.366293
16-0.138402-1.06310.146038
170.132261.01590.156911
180.081150.62330.267738
19-0.267654-2.05590.022113
200.1597661.22720.112314
210.0667530.51270.305023
22-0.193711-1.48790.071048
230.1214970.93320.17725
240.0405180.31120.378364
25-0.204211-1.56860.061048
260.253221.9450.028271
27-0.112101-0.86110.196345
28-0.151723-1.16540.124272
290.2266241.74070.043472
30-0.126094-0.96850.168363
31-0.12983-0.99720.161359
320.2224531.70870.046382
33-0.091253-0.70090.243052
34-0.095014-0.72980.234195
350.1821051.39880.083557
36-0.124667-0.95760.17109
37-0.012631-0.0970.461518
380.1537091.18070.121237
39-0.197719-1.51870.067088
400.1002890.77030.222088
410.0109720.08430.46656
42-0.084105-0.6460.260384
430.0696250.53480.297398
44-0.006736-0.05170.479454
45-0.080089-0.61520.270402
460.0786230.60390.274109
47-0.016132-0.12390.450902
48-0.036038-0.27680.391444

\begin{tabular}{lllllllll}
\hline
Autocorrelation Function \tabularnewline
Time lag k & ACF(k) & T-STAT & P-value \tabularnewline
1 & -0.559905 & -4.3007 & 3.2e-05 \tabularnewline
2 & -0.012405 & -0.0953 & 0.462205 \tabularnewline
3 & 0.235479 & 1.8087 & 0.037793 \tabularnewline
4 & -0.081494 & -0.626 & 0.266877 \tabularnewline
5 & -0.167287 & -1.285 & 0.101915 \tabularnewline
6 & 0.347952 & 2.6727 & 0.004857 \tabularnewline
7 & -0.366293 & -2.8136 & 0.003323 \tabularnewline
8 & 0.153693 & 1.1805 & 0.121263 \tabularnewline
9 & 0.12251 & 0.941 & 0.175266 \tabularnewline
10 & -0.206312 & -1.5847 & 0.059189 \tabularnewline
11 & 0.056685 & 0.4354 & 0.332428 \tabularnewline
12 & 0.252459 & 1.9392 & 0.028634 \tabularnewline
13 & -0.410439 & -3.1526 & 0.001272 \tabularnewline
14 & 0.304564 & 2.3394 & 0.01136 \tabularnewline
15 & -0.044695 & -0.3433 & 0.366293 \tabularnewline
16 & -0.138402 & -1.0631 & 0.146038 \tabularnewline
17 & 0.13226 & 1.0159 & 0.156911 \tabularnewline
18 & 0.08115 & 0.6233 & 0.267738 \tabularnewline
19 & -0.267654 & -2.0559 & 0.022113 \tabularnewline
20 & 0.159766 & 1.2272 & 0.112314 \tabularnewline
21 & 0.066753 & 0.5127 & 0.305023 \tabularnewline
22 & -0.193711 & -1.4879 & 0.071048 \tabularnewline
23 & 0.121497 & 0.9332 & 0.17725 \tabularnewline
24 & 0.040518 & 0.3112 & 0.378364 \tabularnewline
25 & -0.204211 & -1.5686 & 0.061048 \tabularnewline
26 & 0.25322 & 1.945 & 0.028271 \tabularnewline
27 & -0.112101 & -0.8611 & 0.196345 \tabularnewline
28 & -0.151723 & -1.1654 & 0.124272 \tabularnewline
29 & 0.226624 & 1.7407 & 0.043472 \tabularnewline
30 & -0.126094 & -0.9685 & 0.168363 \tabularnewline
31 & -0.12983 & -0.9972 & 0.161359 \tabularnewline
32 & 0.222453 & 1.7087 & 0.046382 \tabularnewline
33 & -0.091253 & -0.7009 & 0.243052 \tabularnewline
34 & -0.095014 & -0.7298 & 0.234195 \tabularnewline
35 & 0.182105 & 1.3988 & 0.083557 \tabularnewline
36 & -0.124667 & -0.9576 & 0.17109 \tabularnewline
37 & -0.012631 & -0.097 & 0.461518 \tabularnewline
38 & 0.153709 & 1.1807 & 0.121237 \tabularnewline
39 & -0.197719 & -1.5187 & 0.067088 \tabularnewline
40 & 0.100289 & 0.7703 & 0.222088 \tabularnewline
41 & 0.010972 & 0.0843 & 0.46656 \tabularnewline
42 & -0.084105 & -0.646 & 0.260384 \tabularnewline
43 & 0.069625 & 0.5348 & 0.297398 \tabularnewline
44 & -0.006736 & -0.0517 & 0.479454 \tabularnewline
45 & -0.080089 & -0.6152 & 0.270402 \tabularnewline
46 & 0.078623 & 0.6039 & 0.274109 \tabularnewline
47 & -0.016132 & -0.1239 & 0.450902 \tabularnewline
48 & -0.036038 & -0.2768 & 0.391444 \tabularnewline
\hline
\end{tabular}
%Source: https://freestatistics.org/blog/index.php?pk=&T=1

[TABLE]
[ROW][C]Autocorrelation Function[/C][/ROW]
[ROW][C]Time lag k[/C][C]ACF(k)[/C][C]T-STAT[/C][C]P-value[/C][/ROW]
[ROW][C]1[/C][C]-0.559905[/C][C]-4.3007[/C][C]3.2e-05[/C][/ROW]
[ROW][C]2[/C][C]-0.012405[/C][C]-0.0953[/C][C]0.462205[/C][/ROW]
[ROW][C]3[/C][C]0.235479[/C][C]1.8087[/C][C]0.037793[/C][/ROW]
[ROW][C]4[/C][C]-0.081494[/C][C]-0.626[/C][C]0.266877[/C][/ROW]
[ROW][C]5[/C][C]-0.167287[/C][C]-1.285[/C][C]0.101915[/C][/ROW]
[ROW][C]6[/C][C]0.347952[/C][C]2.6727[/C][C]0.004857[/C][/ROW]
[ROW][C]7[/C][C]-0.366293[/C][C]-2.8136[/C][C]0.003323[/C][/ROW]
[ROW][C]8[/C][C]0.153693[/C][C]1.1805[/C][C]0.121263[/C][/ROW]
[ROW][C]9[/C][C]0.12251[/C][C]0.941[/C][C]0.175266[/C][/ROW]
[ROW][C]10[/C][C]-0.206312[/C][C]-1.5847[/C][C]0.059189[/C][/ROW]
[ROW][C]11[/C][C]0.056685[/C][C]0.4354[/C][C]0.332428[/C][/ROW]
[ROW][C]12[/C][C]0.252459[/C][C]1.9392[/C][C]0.028634[/C][/ROW]
[ROW][C]13[/C][C]-0.410439[/C][C]-3.1526[/C][C]0.001272[/C][/ROW]
[ROW][C]14[/C][C]0.304564[/C][C]2.3394[/C][C]0.01136[/C][/ROW]
[ROW][C]15[/C][C]-0.044695[/C][C]-0.3433[/C][C]0.366293[/C][/ROW]
[ROW][C]16[/C][C]-0.138402[/C][C]-1.0631[/C][C]0.146038[/C][/ROW]
[ROW][C]17[/C][C]0.13226[/C][C]1.0159[/C][C]0.156911[/C][/ROW]
[ROW][C]18[/C][C]0.08115[/C][C]0.6233[/C][C]0.267738[/C][/ROW]
[ROW][C]19[/C][C]-0.267654[/C][C]-2.0559[/C][C]0.022113[/C][/ROW]
[ROW][C]20[/C][C]0.159766[/C][C]1.2272[/C][C]0.112314[/C][/ROW]
[ROW][C]21[/C][C]0.066753[/C][C]0.5127[/C][C]0.305023[/C][/ROW]
[ROW][C]22[/C][C]-0.193711[/C][C]-1.4879[/C][C]0.071048[/C][/ROW]
[ROW][C]23[/C][C]0.121497[/C][C]0.9332[/C][C]0.17725[/C][/ROW]
[ROW][C]24[/C][C]0.040518[/C][C]0.3112[/C][C]0.378364[/C][/ROW]
[ROW][C]25[/C][C]-0.204211[/C][C]-1.5686[/C][C]0.061048[/C][/ROW]
[ROW][C]26[/C][C]0.25322[/C][C]1.945[/C][C]0.028271[/C][/ROW]
[ROW][C]27[/C][C]-0.112101[/C][C]-0.8611[/C][C]0.196345[/C][/ROW]
[ROW][C]28[/C][C]-0.151723[/C][C]-1.1654[/C][C]0.124272[/C][/ROW]
[ROW][C]29[/C][C]0.226624[/C][C]1.7407[/C][C]0.043472[/C][/ROW]
[ROW][C]30[/C][C]-0.126094[/C][C]-0.9685[/C][C]0.168363[/C][/ROW]
[ROW][C]31[/C][C]-0.12983[/C][C]-0.9972[/C][C]0.161359[/C][/ROW]
[ROW][C]32[/C][C]0.222453[/C][C]1.7087[/C][C]0.046382[/C][/ROW]
[ROW][C]33[/C][C]-0.091253[/C][C]-0.7009[/C][C]0.243052[/C][/ROW]
[ROW][C]34[/C][C]-0.095014[/C][C]-0.7298[/C][C]0.234195[/C][/ROW]
[ROW][C]35[/C][C]0.182105[/C][C]1.3988[/C][C]0.083557[/C][/ROW]
[ROW][C]36[/C][C]-0.124667[/C][C]-0.9576[/C][C]0.17109[/C][/ROW]
[ROW][C]37[/C][C]-0.012631[/C][C]-0.097[/C][C]0.461518[/C][/ROW]
[ROW][C]38[/C][C]0.153709[/C][C]1.1807[/C][C]0.121237[/C][/ROW]
[ROW][C]39[/C][C]-0.197719[/C][C]-1.5187[/C][C]0.067088[/C][/ROW]
[ROW][C]40[/C][C]0.100289[/C][C]0.7703[/C][C]0.222088[/C][/ROW]
[ROW][C]41[/C][C]0.010972[/C][C]0.0843[/C][C]0.46656[/C][/ROW]
[ROW][C]42[/C][C]-0.084105[/C][C]-0.646[/C][C]0.260384[/C][/ROW]
[ROW][C]43[/C][C]0.069625[/C][C]0.5348[/C][C]0.297398[/C][/ROW]
[ROW][C]44[/C][C]-0.006736[/C][C]-0.0517[/C][C]0.479454[/C][/ROW]
[ROW][C]45[/C][C]-0.080089[/C][C]-0.6152[/C][C]0.270402[/C][/ROW]
[ROW][C]46[/C][C]0.078623[/C][C]0.6039[/C][C]0.274109[/C][/ROW]
[ROW][C]47[/C][C]-0.016132[/C][C]-0.1239[/C][C]0.450902[/C][/ROW]
[ROW][C]48[/C][C]-0.036038[/C][C]-0.2768[/C][C]0.391444[/C][/ROW]
[/TABLE]
Source: https://freestatistics.org/blog/index.php?pk=&T=1

Globally Unique Identifier (entire table): ba.freestatistics.org/blog/index.php?pk=&T=1

As an alternative you can also use a QR Code:  

The GUIDs for individual cells are displayed in the table below:

Autocorrelation Function
Time lag kACF(k)T-STATP-value
1-0.559905-4.30073.2e-05
2-0.012405-0.09530.462205
30.2354791.80870.037793
4-0.081494-0.6260.266877
5-0.167287-1.2850.101915
60.3479522.67270.004857
7-0.366293-2.81360.003323
80.1536931.18050.121263
90.122510.9410.175266
10-0.206312-1.58470.059189
110.0566850.43540.332428
120.2524591.93920.028634
13-0.410439-3.15260.001272
140.3045642.33940.01136
15-0.044695-0.34330.366293
16-0.138402-1.06310.146038
170.132261.01590.156911
180.081150.62330.267738
19-0.267654-2.05590.022113
200.1597661.22720.112314
210.0667530.51270.305023
22-0.193711-1.48790.071048
230.1214970.93320.17725
240.0405180.31120.378364
25-0.204211-1.56860.061048
260.253221.9450.028271
27-0.112101-0.86110.196345
28-0.151723-1.16540.124272
290.2266241.74070.043472
30-0.126094-0.96850.168363
31-0.12983-0.99720.161359
320.2224531.70870.046382
33-0.091253-0.70090.243052
34-0.095014-0.72980.234195
350.1821051.39880.083557
36-0.124667-0.95760.17109
37-0.012631-0.0970.461518
380.1537091.18070.121237
39-0.197719-1.51870.067088
400.1002890.77030.222088
410.0109720.08430.46656
42-0.084105-0.6460.260384
430.0696250.53480.297398
44-0.006736-0.05170.479454
45-0.080089-0.61520.270402
460.0786230.60390.274109
47-0.016132-0.12390.450902
48-0.036038-0.27680.391444


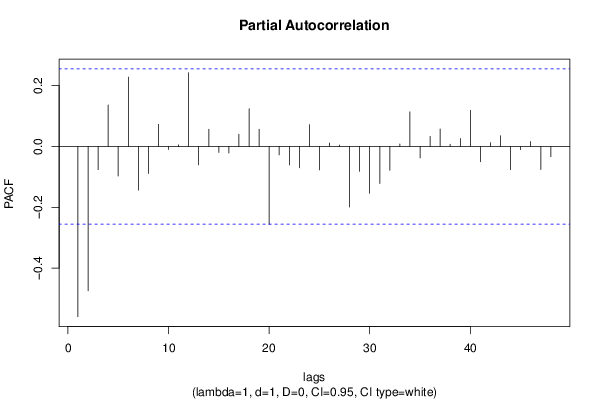
Partial Autocorrelation Function
Time lag kPACF(k)T-STATP-value
1-0.559905-4.30073.2e-05
2-0.474721-3.64640.000282
3-0.076276-0.58590.280092
40.1363551.04740.149602
5-0.097268-0.74710.228976
60.2282911.75350.042352
7-0.143724-1.1040.137046
8-0.089131-0.68460.24813
90.073260.56270.287879
10-0.009913-0.07610.469782
110.0054210.04160.483463
120.2426531.86390.03366
13-0.060625-0.46570.321584
140.0569170.43720.331785
15-0.019458-0.14950.440849
16-0.02155-0.16550.434546
170.0404930.3110.378435
180.1243070.95480.171782
190.0570660.43830.331373
20-0.256954-1.97370.026552
21-0.027602-0.2120.416414
22-0.061044-0.46890.320439
23-0.069943-0.53720.296561
240.072090.55370.290928
25-0.076878-0.59050.278551
260.0116040.08910.464639
270.0051860.03980.484179
28-0.198936-1.52810.065921
29-0.08154-0.62630.266759
30-0.153802-1.18140.121097
31-0.121573-0.93380.177101
32-0.07842-0.60240.274623
330.0079970.06140.475615
340.1140270.87590.192329
35-0.037464-0.28780.387267
360.0332030.2550.39979
370.0576990.44320.329622
380.0074960.05760.477138
390.026430.2030.419911
400.1190140.91420.182177
41-0.050262-0.38610.350418
420.0128910.0990.460731
430.0352190.27050.393852
44-0.07624-0.58560.280186
45-0.010342-0.07940.468477
460.0162610.12490.450512
47-0.075742-0.58180.281464
48-0.033455-0.2570.399048

\begin{tabular}{lllllllll}
\hline
Partial Autocorrelation Function \tabularnewline
Time lag k & PACF(k) & T-STAT & P-value \tabularnewline
1 & -0.559905 & -4.3007 & 3.2e-05 \tabularnewline
2 & -0.474721 & -3.6464 & 0.000282 \tabularnewline
3 & -0.076276 & -0.5859 & 0.280092 \tabularnewline
4 & 0.136355 & 1.0474 & 0.149602 \tabularnewline
5 & -0.097268 & -0.7471 & 0.228976 \tabularnewline
6 & 0.228291 & 1.7535 & 0.042352 \tabularnewline
7 & -0.143724 & -1.104 & 0.137046 \tabularnewline
8 & -0.089131 & -0.6846 & 0.24813 \tabularnewline
9 & 0.07326 & 0.5627 & 0.287879 \tabularnewline
10 & -0.009913 & -0.0761 & 0.469782 \tabularnewline
11 & 0.005421 & 0.0416 & 0.483463 \tabularnewline
12 & 0.242653 & 1.8639 & 0.03366 \tabularnewline
13 & -0.060625 & -0.4657 & 0.321584 \tabularnewline
14 & 0.056917 & 0.4372 & 0.331785 \tabularnewline
15 & -0.019458 & -0.1495 & 0.440849 \tabularnewline
16 & -0.02155 & -0.1655 & 0.434546 \tabularnewline
17 & 0.040493 & 0.311 & 0.378435 \tabularnewline
18 & 0.124307 & 0.9548 & 0.171782 \tabularnewline
19 & 0.057066 & 0.4383 & 0.331373 \tabularnewline
20 & -0.256954 & -1.9737 & 0.026552 \tabularnewline
21 & -0.027602 & -0.212 & 0.416414 \tabularnewline
22 & -0.061044 & -0.4689 & 0.320439 \tabularnewline
23 & -0.069943 & -0.5372 & 0.296561 \tabularnewline
24 & 0.07209 & 0.5537 & 0.290928 \tabularnewline
25 & -0.076878 & -0.5905 & 0.278551 \tabularnewline
26 & 0.011604 & 0.0891 & 0.464639 \tabularnewline
27 & 0.005186 & 0.0398 & 0.484179 \tabularnewline
28 & -0.198936 & -1.5281 & 0.065921 \tabularnewline
29 & -0.08154 & -0.6263 & 0.266759 \tabularnewline
30 & -0.153802 & -1.1814 & 0.121097 \tabularnewline
31 & -0.121573 & -0.9338 & 0.177101 \tabularnewline
32 & -0.07842 & -0.6024 & 0.274623 \tabularnewline
33 & 0.007997 & 0.0614 & 0.475615 \tabularnewline
34 & 0.114027 & 0.8759 & 0.192329 \tabularnewline
35 & -0.037464 & -0.2878 & 0.387267 \tabularnewline
36 & 0.033203 & 0.255 & 0.39979 \tabularnewline
37 & 0.057699 & 0.4432 & 0.329622 \tabularnewline
38 & 0.007496 & 0.0576 & 0.477138 \tabularnewline
39 & 0.02643 & 0.203 & 0.419911 \tabularnewline
40 & 0.119014 & 0.9142 & 0.182177 \tabularnewline
41 & -0.050262 & -0.3861 & 0.350418 \tabularnewline
42 & 0.012891 & 0.099 & 0.460731 \tabularnewline
43 & 0.035219 & 0.2705 & 0.393852 \tabularnewline
44 & -0.07624 & -0.5856 & 0.280186 \tabularnewline
45 & -0.010342 & -0.0794 & 0.468477 \tabularnewline
46 & 0.016261 & 0.1249 & 0.450512 \tabularnewline
47 & -0.075742 & -0.5818 & 0.281464 \tabularnewline
48 & -0.033455 & -0.257 & 0.399048 \tabularnewline
\hline
\end{tabular}
%Source: https://freestatistics.org/blog/index.php?pk=&T=2

[TABLE]
[ROW][C]Partial Autocorrelation Function[/C][/ROW]
[ROW][C]Time lag k[/C][C]PACF(k)[/C][C]T-STAT[/C][C]P-value[/C][/ROW]
[ROW][C]1[/C][C]-0.559905[/C][C]-4.3007[/C][C]3.2e-05[/C][/ROW]
[ROW][C]2[/C][C]-0.474721[/C][C]-3.6464[/C][C]0.000282[/C][/ROW]
[ROW][C]3[/C][C]-0.076276[/C][C]-0.5859[/C][C]0.280092[/C][/ROW]
[ROW][C]4[/C][C]0.136355[/C][C]1.0474[/C][C]0.149602[/C][/ROW]
[ROW][C]5[/C][C]-0.097268[/C][C]-0.7471[/C][C]0.228976[/C][/ROW]
[ROW][C]6[/C][C]0.228291[/C][C]1.7535[/C][C]0.042352[/C][/ROW]
[ROW][C]7[/C][C]-0.143724[/C][C]-1.104[/C][C]0.137046[/C][/ROW]
[ROW][C]8[/C][C]-0.089131[/C][C]-0.6846[/C][C]0.24813[/C][/ROW]
[ROW][C]9[/C][C]0.07326[/C][C]0.5627[/C][C]0.287879[/C][/ROW]
[ROW][C]10[/C][C]-0.009913[/C][C]-0.0761[/C][C]0.469782[/C][/ROW]
[ROW][C]11[/C][C]0.005421[/C][C]0.0416[/C][C]0.483463[/C][/ROW]
[ROW][C]12[/C][C]0.242653[/C][C]1.8639[/C][C]0.03366[/C][/ROW]
[ROW][C]13[/C][C]-0.060625[/C][C]-0.4657[/C][C]0.321584[/C][/ROW]
[ROW][C]14[/C][C]0.056917[/C][C]0.4372[/C][C]0.331785[/C][/ROW]
[ROW][C]15[/C][C]-0.019458[/C][C]-0.1495[/C][C]0.440849[/C][/ROW]
[ROW][C]16[/C][C]-0.02155[/C][C]-0.1655[/C][C]0.434546[/C][/ROW]
[ROW][C]17[/C][C]0.040493[/C][C]0.311[/C][C]0.378435[/C][/ROW]
[ROW][C]18[/C][C]0.124307[/C][C]0.9548[/C][C]0.171782[/C][/ROW]
[ROW][C]19[/C][C]0.057066[/C][C]0.4383[/C][C]0.331373[/C][/ROW]
[ROW][C]20[/C][C]-0.256954[/C][C]-1.9737[/C][C]0.026552[/C][/ROW]
[ROW][C]21[/C][C]-0.027602[/C][C]-0.212[/C][C]0.416414[/C][/ROW]
[ROW][C]22[/C][C]-0.061044[/C][C]-0.4689[/C][C]0.320439[/C][/ROW]
[ROW][C]23[/C][C]-0.069943[/C][C]-0.5372[/C][C]0.296561[/C][/ROW]
[ROW][C]24[/C][C]0.07209[/C][C]0.5537[/C][C]0.290928[/C][/ROW]
[ROW][C]25[/C][C]-0.076878[/C][C]-0.5905[/C][C]0.278551[/C][/ROW]
[ROW][C]26[/C][C]0.011604[/C][C]0.0891[/C][C]0.464639[/C][/ROW]
[ROW][C]27[/C][C]0.005186[/C][C]0.0398[/C][C]0.484179[/C][/ROW]
[ROW][C]28[/C][C]-0.198936[/C][C]-1.5281[/C][C]0.065921[/C][/ROW]
[ROW][C]29[/C][C]-0.08154[/C][C]-0.6263[/C][C]0.266759[/C][/ROW]
[ROW][C]30[/C][C]-0.153802[/C][C]-1.1814[/C][C]0.121097[/C][/ROW]
[ROW][C]31[/C][C]-0.121573[/C][C]-0.9338[/C][C]0.177101[/C][/ROW]
[ROW][C]32[/C][C]-0.07842[/C][C]-0.6024[/C][C]0.274623[/C][/ROW]
[ROW][C]33[/C][C]0.007997[/C][C]0.0614[/C][C]0.475615[/C][/ROW]
[ROW][C]34[/C][C]0.114027[/C][C]0.8759[/C][C]0.192329[/C][/ROW]
[ROW][C]35[/C][C]-0.037464[/C][C]-0.2878[/C][C]0.387267[/C][/ROW]
[ROW][C]36[/C][C]0.033203[/C][C]0.255[/C][C]0.39979[/C][/ROW]
[ROW][C]37[/C][C]0.057699[/C][C]0.4432[/C][C]0.329622[/C][/ROW]
[ROW][C]38[/C][C]0.007496[/C][C]0.0576[/C][C]0.477138[/C][/ROW]
[ROW][C]39[/C][C]0.02643[/C][C]0.203[/C][C]0.419911[/C][/ROW]
[ROW][C]40[/C][C]0.119014[/C][C]0.9142[/C][C]0.182177[/C][/ROW]
[ROW][C]41[/C][C]-0.050262[/C][C]-0.3861[/C][C]0.350418[/C][/ROW]
[ROW][C]42[/C][C]0.012891[/C][C]0.099[/C][C]0.460731[/C][/ROW]
[ROW][C]43[/C][C]0.035219[/C][C]0.2705[/C][C]0.393852[/C][/ROW]
[ROW][C]44[/C][C]-0.07624[/C][C]-0.5856[/C][C]0.280186[/C][/ROW]
[ROW][C]45[/C][C]-0.010342[/C][C]-0.0794[/C][C]0.468477[/C][/ROW]
[ROW][C]46[/C][C]0.016261[/C][C]0.1249[/C][C]0.450512[/C][/ROW]
[ROW][C]47[/C][C]-0.075742[/C][C]-0.5818[/C][C]0.281464[/C][/ROW]
[ROW][C]48[/C][C]-0.033455[/C][C]-0.257[/C][C]0.399048[/C][/ROW]
[/TABLE]
Source: https://freestatistics.org/blog/index.php?pk=&T=2

Globally Unique Identifier (entire table): ba.freestatistics.org/blog/index.php?pk=&T=2

As an alternative you can also use a QR Code:  

The GUIDs for individual cells are displayed in the table below:

Partial Autocorrelation Function
Time lag kPACF(k)T-STATP-value
1-0.559905-4.30073.2e-05
2-0.474721-3.64640.000282
3-0.076276-0.58590.280092
40.1363551.04740.149602
5-0.097268-0.74710.228976
60.2282911.75350.042352
7-0.143724-1.1040.137046
8-0.089131-0.68460.24813
90.073260.56270.287879
10-0.009913-0.07610.469782
110.0054210.04160.483463
120.2426531.86390.03366
13-0.060625-0.46570.321584
140.0569170.43720.331785
15-0.019458-0.14950.440849
16-0.02155-0.16550.434546
170.0404930.3110.378435
180.1243070.95480.171782
190.0570660.43830.331373
20-0.256954-1.97370.026552
21-0.027602-0.2120.416414
22-0.061044-0.46890.320439
23-0.069943-0.53720.296561
240.072090.55370.290928
25-0.076878-0.59050.278551
260.0116040.08910.464639
270.0051860.03980.484179
28-0.198936-1.52810.065921
29-0.08154-0.62630.266759
30-0.153802-1.18140.121097
31-0.121573-0.93380.177101
32-0.07842-0.60240.274623
330.0079970.06140.475615
340.1140270.87590.192329
35-0.037464-0.28780.387267
360.0332030.2550.39979
370.0576990.44320.329622
380.0074960.05760.477138
390.026430.2030.419911
400.1190140.91420.182177
41-0.050262-0.38610.350418
420.0128910.0990.460731
430.0352190.27050.393852
44-0.07624-0.58560.280186
45-0.010342-0.07940.468477
460.0162610.12490.450512
47-0.075742-0.58180.281464
48-0.033455-0.2570.399048


Parameters (Session):
par1 = 48 ; par2 = 1 ; par3 = 1 ; par4 = 0 ; par5 = 12 ; par6 = White Noise ; par7 = 0.95 ;
Parameters (R input):
par1 = 48 ; par2 = 1 ; par3 = 1 ; par4 = 0 ; par5 = 12 ; par6 = White Noise ; par7 = 0.95 ; par8 = ;
R code (references can be found in the software module):
if (par1 == 'Default') {
par1 = 10*log10(length(x))
} else {
par1 <- as.numeric(par1)
}
par2 <- as.numeric(par2)
par3 <- as.numeric(par3)
par4 <- as.numeric(par4)
par5 <- as.numeric(par5)
if (par6 == 'White Noise') par6 <- 'white' else par6 <- 'ma'
par7 <- as.numeric(par7)
if (par8 != '') par8 <- as.numeric(par8)
x <- na.omit(x)
ox <- x
if (par8 == '') {
if (par2 == 0) {
x <- log(x)
} else {
x <- (x ^ par2 - 1) / par2
}
} else {
x <- log(x,base=par8)
}
if (par3 > 0) x <- diff(x,lag=1,difference=par3)
if (par4 > 0) x <- diff(x,lag=par5,difference=par4)
bitmap(file='picts.png')
op <- par(mfrow=c(2,1))
plot(ox,type='l',main='Original Time Series',xlab='time',ylab='value')
if (par8=='') {
mytitle <- paste('Working Time Series (lambda=',par2,', d=',par3,', D=',par4,')',sep='')
mysub <- paste('(lambda=',par2,', d=',par3,', D=',par4,', CI=', par7, ', CI type=',par6,')',sep='')
} else {
mytitle <- paste('Working Time Series (base=',par8,', d=',par3,', D=',par4,')',sep='')
mysub <- paste('(base=',par8,', d=',par3,', D=',par4,', CI=', par7, ', CI type=',par6,')',sep='')
}
plot(x,type='l', main=mytitle,xlab='time',ylab='value')
par(op)
dev.off()
bitmap(file='pic1.png')
racf <- acf(x, par1, main='Autocorrelation', xlab='time lag', ylab='ACF', ci.type=par6, ci=par7, sub=mysub)
dev.off()
bitmap(file='pic2.png')
rpacf <- pacf(x,par1,main='Partial Autocorrelation',xlab='lags',ylab='PACF',sub=mysub)
dev.off()
(myacf <- c(racf$acf))
(mypacf <- c(rpacf$acf))
lengthx <- length(x)
sqrtn <- sqrt(lengthx)
load(file='createtable')
a<-table.start()
a<-table.row.start(a)
a<-table.element(a,'Autocorrelation Function',4,TRUE)
a<-table.row.end(a)
a<-table.row.start(a)
a<-table.element(a,'Time lag k',header=TRUE)
a<-table.element(a,hyperlink('basics.htm','ACF(k)','click here for more information about the Autocorrelation Function'),header=TRUE)
a<-table.element(a,'T-STAT',header=TRUE)
a<-table.element(a,'P-value',header=TRUE)
a<-table.row.end(a)
for (i in 2:(par1+1)) {
a<-table.row.start(a)
a<-table.element(a,i-1,header=TRUE)
a<-table.element(a,round(myacf[i],6))
mytstat <- myacf[i]*sqrtn
a<-table.element(a,round(mytstat,4))
a<-table.element(a,round(1-pt(abs(mytstat),lengthx),6))
a<-table.row.end(a)
}
a<-table.end(a)
table.save(a,file='mytable.tab')
a<-table.start()
a<-table.row.start(a)
a<-table.element(a,'Partial Autocorrelation Function',4,TRUE)
a<-table.row.end(a)
a<-table.row.start(a)
a<-table.element(a,'Time lag k',header=TRUE)
a<-table.element(a,hyperlink('basics.htm','PACF(k)','click here for more information about the Partial Autocorrelation Function'),header=TRUE)
a<-table.element(a,'T-STAT',header=TRUE)
a<-table.element(a,'P-value',header=TRUE)
a<-table.row.end(a)
for (i in 1:par1) {
a<-table.row.start(a)
a<-table.element(a,i,header=TRUE)
a<-table.element(a,round(mypacf[i],6))
mytstat <- mypacf[i]*sqrtn
a<-table.element(a,round(mytstat,4))
a<-table.element(a,round(1-pt(abs(mytstat),lengthx),6))
a<-table.row.end(a)
}
a<-table.end(a)
table.save(a,file='mytable1.tab')