Free Statistics

of Irreproducible Research!

Author's title

Author*Unverified author*
R Software Modulerwasp_autocorrelation.wasp
Title produced by software(Partial) Autocorrelation Function
Date of computationWed, 19 Oct 2016 21:39:30 +0100
Cite this page as followsStatistical Computations at FreeStatistics.org, Office for Research Development and Education, URL https://freestatistics.org/blog/index.php?v=date/2016/Oct/19/t1476909588wxzx3xmps9ijd4w.htm/, Retrieved Tue, 30 Apr 2024 07:29:40 +0200
Statistical Computations at FreeStatistics.org, Office for Research Development and Education, URL https://freestatistics.org/blog/index.php?pk=, Retrieved Tue, 30 Apr 2024 07:29:40 +0200
QR Codes:

Original text written by user:
IsPrivate?No (this computation is public)
User-defined keywords
Estimated Impact0
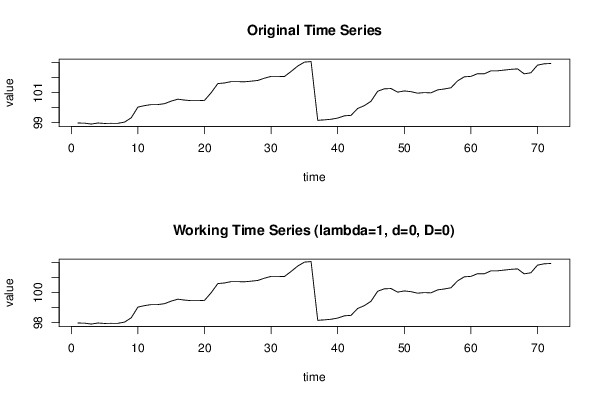
Dataseries X:
98.98
98.97
98.91
98.98
98.95
98.96
98.96
99.04
99.33
100.04
100.14
100.21
100.21
100.27
100.44
100.57
100.51
100.47
100.47
100.49
101
101.61
101.65
101.74
101.74
101.73
101.77
101.82
101.97
102.09
102.09
102.08
102.42
102.78
103.04
103.08
99.16
99.19
99.23
99.31
99.46
99.49
99.95
100.14
100.43
101.1
101.26
101.28
101.04
101.12
101.07
100.97
101.01
100.99
101.19
101.25
101.33
101.79
102.06
102.09
102.27
102.26
102.46
102.46
102.51
102.56
102.59
102.26
102.33
102.84
102.93
102.95


Summary of computational transaction
Raw Inputview raw input (R code)
Raw Outputview raw output of R engine
Computing time2 seconds
R Server'Herman Ole Andreas Wold' @ wold.wessa.net

\begin{tabular}{lllllllll}
\hline
Summary of computational transaction \tabularnewline
Raw Input & view raw input (R code)  \tabularnewline
Raw Output & view raw output of R engine  \tabularnewline
Computing time & 2 seconds \tabularnewline
R Server & 'Herman Ole Andreas Wold' @ wold.wessa.net \tabularnewline
\hline
\end{tabular}
%Source: https://freestatistics.org/blog/index.php?pk=&T=0

[TABLE]
[ROW][C]Summary of computational transaction[/C][/ROW]
[ROW][C]Raw Input[/C][C]view raw input (R code) [/C][/ROW]
[ROW][C]Raw Output[/C][C]view raw output of R engine [/C][/ROW]
[ROW][C]Computing time[/C][C]2 seconds[/C][/ROW]
[ROW][C]R Server[/C][C]'Herman Ole Andreas Wold' @ wold.wessa.net[/C][/ROW]
[/TABLE]
Source: https://freestatistics.org/blog/index.php?pk=&T=0

Globally Unique Identifier (entire table): ba.freestatistics.org/blog/index.php?pk=&T=0

As an alternative you can also use a QR Code:  

The GUIDs for individual cells are displayed in the table below:

Summary of computational transaction
Raw Inputview raw input (R code)
Raw Outputview raw output of R engine
Computing time2 seconds
R Server'Herman Ole Andreas Wold' @ wold.wessa.net


Autocorrelation Function
Time lag kACF(k)T-STATP-value
10.883547.49710
20.7554786.41040
30.6318455.36140
40.5279554.47981.4e-05
50.4378523.71530.000199
60.3382062.86980.002694
70.2505492.1260.018467
80.1717881.45770.07464
90.1102240.93530.176385
100.0826730.70150.242626
110.0630830.53530.297054
120.0330840.28070.389861
13-0.020339-0.17260.431733
14-0.078347-0.66480.254152
15-0.135429-1.14920.127148
16-0.170425-1.44610.076244
17-0.189456-1.60760.056151
18-0.212945-1.80690.037478
19-0.22987-1.95050.027504
20-0.250915-2.12910.018334
21-0.266524-2.26150.013374
22-0.25616-2.17360.016513
23-0.234738-1.99180.025092
24-0.214893-1.82340.036195
25-0.20657-1.75280.041946
26-0.206017-1.74810.042354
27-0.19693-1.6710.049531
28-0.153709-1.30430.098148
29-0.093344-0.79210.215466
30-0.02654-0.22520.411233
310.0460760.3910.348489
320.1042870.88490.189578
330.1698611.44130.076915
340.2590762.19830.01557
350.350492.9740.001999
360.4385523.72120.000195
370.3803573.22740.000941
380.3151182.67390.004636
390.2529272.14620.017616
400.1981111.6810.048545
410.1505841.27770.102722
420.1021690.86690.194429
430.0605660.51390.304442
440.0230860.19590.422624
45-0.007564-0.06420.474502
46-0.027169-0.23050.409163
47-0.043608-0.370.356224
48-0.060638-0.51450.304229

\begin{tabular}{lllllllll}
\hline
Autocorrelation Function \tabularnewline
Time lag k & ACF(k) & T-STAT & P-value \tabularnewline
1 & 0.88354 & 7.4971 & 0 \tabularnewline
2 & 0.755478 & 6.4104 & 0 \tabularnewline
3 & 0.631845 & 5.3614 & 0 \tabularnewline
4 & 0.527955 & 4.4798 & 1.4e-05 \tabularnewline
5 & 0.437852 & 3.7153 & 0.000199 \tabularnewline
6 & 0.338206 & 2.8698 & 0.002694 \tabularnewline
7 & 0.250549 & 2.126 & 0.018467 \tabularnewline
8 & 0.171788 & 1.4577 & 0.07464 \tabularnewline
9 & 0.110224 & 0.9353 & 0.176385 \tabularnewline
10 & 0.082673 & 0.7015 & 0.242626 \tabularnewline
11 & 0.063083 & 0.5353 & 0.297054 \tabularnewline
12 & 0.033084 & 0.2807 & 0.389861 \tabularnewline
13 & -0.020339 & -0.1726 & 0.431733 \tabularnewline
14 & -0.078347 & -0.6648 & 0.254152 \tabularnewline
15 & -0.135429 & -1.1492 & 0.127148 \tabularnewline
16 & -0.170425 & -1.4461 & 0.076244 \tabularnewline
17 & -0.189456 & -1.6076 & 0.056151 \tabularnewline
18 & -0.212945 & -1.8069 & 0.037478 \tabularnewline
19 & -0.22987 & -1.9505 & 0.027504 \tabularnewline
20 & -0.250915 & -2.1291 & 0.018334 \tabularnewline
21 & -0.266524 & -2.2615 & 0.013374 \tabularnewline
22 & -0.25616 & -2.1736 & 0.016513 \tabularnewline
23 & -0.234738 & -1.9918 & 0.025092 \tabularnewline
24 & -0.214893 & -1.8234 & 0.036195 \tabularnewline
25 & -0.20657 & -1.7528 & 0.041946 \tabularnewline
26 & -0.206017 & -1.7481 & 0.042354 \tabularnewline
27 & -0.19693 & -1.671 & 0.049531 \tabularnewline
28 & -0.153709 & -1.3043 & 0.098148 \tabularnewline
29 & -0.093344 & -0.7921 & 0.215466 \tabularnewline
30 & -0.02654 & -0.2252 & 0.411233 \tabularnewline
31 & 0.046076 & 0.391 & 0.348489 \tabularnewline
32 & 0.104287 & 0.8849 & 0.189578 \tabularnewline
33 & 0.169861 & 1.4413 & 0.076915 \tabularnewline
34 & 0.259076 & 2.1983 & 0.01557 \tabularnewline
35 & 0.35049 & 2.974 & 0.001999 \tabularnewline
36 & 0.438552 & 3.7212 & 0.000195 \tabularnewline
37 & 0.380357 & 3.2274 & 0.000941 \tabularnewline
38 & 0.315118 & 2.6739 & 0.004636 \tabularnewline
39 & 0.252927 & 2.1462 & 0.017616 \tabularnewline
40 & 0.198111 & 1.681 & 0.048545 \tabularnewline
41 & 0.150584 & 1.2777 & 0.102722 \tabularnewline
42 & 0.102169 & 0.8669 & 0.194429 \tabularnewline
43 & 0.060566 & 0.5139 & 0.304442 \tabularnewline
44 & 0.023086 & 0.1959 & 0.422624 \tabularnewline
45 & -0.007564 & -0.0642 & 0.474502 \tabularnewline
46 & -0.027169 & -0.2305 & 0.409163 \tabularnewline
47 & -0.043608 & -0.37 & 0.356224 \tabularnewline
48 & -0.060638 & -0.5145 & 0.304229 \tabularnewline
\hline
\end{tabular}
%Source: https://freestatistics.org/blog/index.php?pk=&T=1

[TABLE]
[ROW][C]Autocorrelation Function[/C][/ROW]
[ROW][C]Time lag k[/C][C]ACF(k)[/C][C]T-STAT[/C][C]P-value[/C][/ROW]
[ROW][C]1[/C][C]0.88354[/C][C]7.4971[/C][C]0[/C][/ROW]
[ROW][C]2[/C][C]0.755478[/C][C]6.4104[/C][C]0[/C][/ROW]
[ROW][C]3[/C][C]0.631845[/C][C]5.3614[/C][C]0[/C][/ROW]
[ROW][C]4[/C][C]0.527955[/C][C]4.4798[/C][C]1.4e-05[/C][/ROW]
[ROW][C]5[/C][C]0.437852[/C][C]3.7153[/C][C]0.000199[/C][/ROW]
[ROW][C]6[/C][C]0.338206[/C][C]2.8698[/C][C]0.002694[/C][/ROW]
[ROW][C]7[/C][C]0.250549[/C][C]2.126[/C][C]0.018467[/C][/ROW]
[ROW][C]8[/C][C]0.171788[/C][C]1.4577[/C][C]0.07464[/C][/ROW]
[ROW][C]9[/C][C]0.110224[/C][C]0.9353[/C][C]0.176385[/C][/ROW]
[ROW][C]10[/C][C]0.082673[/C][C]0.7015[/C][C]0.242626[/C][/ROW]
[ROW][C]11[/C][C]0.063083[/C][C]0.5353[/C][C]0.297054[/C][/ROW]
[ROW][C]12[/C][C]0.033084[/C][C]0.2807[/C][C]0.389861[/C][/ROW]
[ROW][C]13[/C][C]-0.020339[/C][C]-0.1726[/C][C]0.431733[/C][/ROW]
[ROW][C]14[/C][C]-0.078347[/C][C]-0.6648[/C][C]0.254152[/C][/ROW]
[ROW][C]15[/C][C]-0.135429[/C][C]-1.1492[/C][C]0.127148[/C][/ROW]
[ROW][C]16[/C][C]-0.170425[/C][C]-1.4461[/C][C]0.076244[/C][/ROW]
[ROW][C]17[/C][C]-0.189456[/C][C]-1.6076[/C][C]0.056151[/C][/ROW]
[ROW][C]18[/C][C]-0.212945[/C][C]-1.8069[/C][C]0.037478[/C][/ROW]
[ROW][C]19[/C][C]-0.22987[/C][C]-1.9505[/C][C]0.027504[/C][/ROW]
[ROW][C]20[/C][C]-0.250915[/C][C]-2.1291[/C][C]0.018334[/C][/ROW]
[ROW][C]21[/C][C]-0.266524[/C][C]-2.2615[/C][C]0.013374[/C][/ROW]
[ROW][C]22[/C][C]-0.25616[/C][C]-2.1736[/C][C]0.016513[/C][/ROW]
[ROW][C]23[/C][C]-0.234738[/C][C]-1.9918[/C][C]0.025092[/C][/ROW]
[ROW][C]24[/C][C]-0.214893[/C][C]-1.8234[/C][C]0.036195[/C][/ROW]
[ROW][C]25[/C][C]-0.20657[/C][C]-1.7528[/C][C]0.041946[/C][/ROW]
[ROW][C]26[/C][C]-0.206017[/C][C]-1.7481[/C][C]0.042354[/C][/ROW]
[ROW][C]27[/C][C]-0.19693[/C][C]-1.671[/C][C]0.049531[/C][/ROW]
[ROW][C]28[/C][C]-0.153709[/C][C]-1.3043[/C][C]0.098148[/C][/ROW]
[ROW][C]29[/C][C]-0.093344[/C][C]-0.7921[/C][C]0.215466[/C][/ROW]
[ROW][C]30[/C][C]-0.02654[/C][C]-0.2252[/C][C]0.411233[/C][/ROW]
[ROW][C]31[/C][C]0.046076[/C][C]0.391[/C][C]0.348489[/C][/ROW]
[ROW][C]32[/C][C]0.104287[/C][C]0.8849[/C][C]0.189578[/C][/ROW]
[ROW][C]33[/C][C]0.169861[/C][C]1.4413[/C][C]0.076915[/C][/ROW]
[ROW][C]34[/C][C]0.259076[/C][C]2.1983[/C][C]0.01557[/C][/ROW]
[ROW][C]35[/C][C]0.35049[/C][C]2.974[/C][C]0.001999[/C][/ROW]
[ROW][C]36[/C][C]0.438552[/C][C]3.7212[/C][C]0.000195[/C][/ROW]
[ROW][C]37[/C][C]0.380357[/C][C]3.2274[/C][C]0.000941[/C][/ROW]
[ROW][C]38[/C][C]0.315118[/C][C]2.6739[/C][C]0.004636[/C][/ROW]
[ROW][C]39[/C][C]0.252927[/C][C]2.1462[/C][C]0.017616[/C][/ROW]
[ROW][C]40[/C][C]0.198111[/C][C]1.681[/C][C]0.048545[/C][/ROW]
[ROW][C]41[/C][C]0.150584[/C][C]1.2777[/C][C]0.102722[/C][/ROW]
[ROW][C]42[/C][C]0.102169[/C][C]0.8669[/C][C]0.194429[/C][/ROW]
[ROW][C]43[/C][C]0.060566[/C][C]0.5139[/C][C]0.304442[/C][/ROW]
[ROW][C]44[/C][C]0.023086[/C][C]0.1959[/C][C]0.422624[/C][/ROW]
[ROW][C]45[/C][C]-0.007564[/C][C]-0.0642[/C][C]0.474502[/C][/ROW]
[ROW][C]46[/C][C]-0.027169[/C][C]-0.2305[/C][C]0.409163[/C][/ROW]
[ROW][C]47[/C][C]-0.043608[/C][C]-0.37[/C][C]0.356224[/C][/ROW]
[ROW][C]48[/C][C]-0.060638[/C][C]-0.5145[/C][C]0.304229[/C][/ROW]
[/TABLE]
Source: https://freestatistics.org/blog/index.php?pk=&T=1

Globally Unique Identifier (entire table): ba.freestatistics.org/blog/index.php?pk=&T=1

As an alternative you can also use a QR Code:  

The GUIDs for individual cells are displayed in the table below:

Autocorrelation Function
Time lag kACF(k)T-STATP-value
10.883547.49710
20.7554786.41040
30.6318455.36140
40.5279554.47981.4e-05
50.4378523.71530.000199
60.3382062.86980.002694
70.2505492.1260.018467
80.1717881.45770.07464
90.1102240.93530.176385
100.0826730.70150.242626
110.0630830.53530.297054
120.0330840.28070.389861
13-0.020339-0.17260.431733
14-0.078347-0.66480.254152
15-0.135429-1.14920.127148
16-0.170425-1.44610.076244
17-0.189456-1.60760.056151
18-0.212945-1.80690.037478
19-0.22987-1.95050.027504
20-0.250915-2.12910.018334
21-0.266524-2.26150.013374
22-0.25616-2.17360.016513
23-0.234738-1.99180.025092
24-0.214893-1.82340.036195
25-0.20657-1.75280.041946
26-0.206017-1.74810.042354
27-0.19693-1.6710.049531
28-0.153709-1.30430.098148
29-0.093344-0.79210.215466
30-0.02654-0.22520.411233
310.0460760.3910.348489
320.1042870.88490.189578
330.1698611.44130.076915
340.2590762.19830.01557
350.350492.9740.001999
360.4385523.72120.000195
370.3803573.22740.000941
380.3151182.67390.004636
390.2529272.14620.017616
400.1981111.6810.048545
410.1505841.27770.102722
420.1021690.86690.194429
430.0605660.51390.304442
440.0230860.19590.422624
45-0.007564-0.06420.474502
46-0.027169-0.23050.409163
47-0.043608-0.370.356224
48-0.060638-0.51450.304229


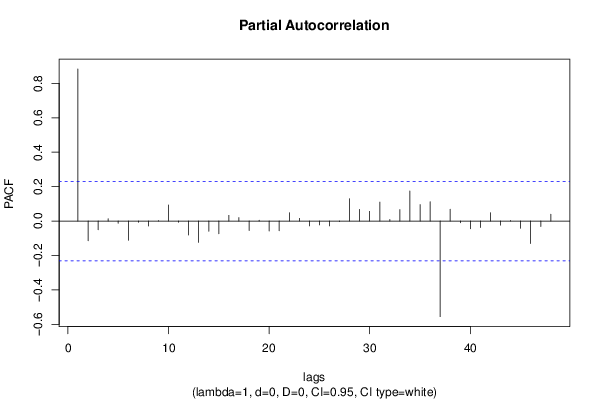
Partial Autocorrelation Function
Time lag kPACF(k)T-STATP-value
10.883547.49710
2-0.114722-0.97350.166794
3-0.050187-0.42590.335742
40.0136930.11620.453915
5-0.013056-0.11080.456047
6-0.112188-0.95190.172154
7-0.006997-0.05940.47641
8-0.028512-0.24190.40476
90.0026590.02260.49103
100.0927590.78710.216908
11-0.006966-0.05910.476514
12-0.081084-0.6880.246826
13-0.123817-1.05060.148472
14-0.059497-0.50490.307602
15-0.073818-0.62640.266527
160.0331790.28150.389555
170.0201080.17060.432501
18-0.055238-0.46870.320345
190.0045260.03840.484735
20-0.058402-0.49560.310857
21-0.056478-0.47920.316614
220.0483180.410.341514
230.015570.13210.447632
24-0.028194-0.23920.405801
25-0.022422-0.19030.424822
26-0.028049-0.2380.406276
27-0.003008-0.02550.489855
280.1294641.09850.137814
290.0676080.57370.283987
300.0562130.4770.317409
310.1097850.93160.177339
320.0088680.07530.470112
330.0663130.56270.287699
340.1749831.48480.070983
350.0952980.80860.210695
360.112010.95040.172534
37-0.55545-4.71326e-06
380.0687730.58360.280669
39-0.009974-0.08460.466394
40-0.04532-0.38460.350852
41-0.037165-0.31540.376702
420.0482910.40980.341598
43-0.023805-0.2020.420247
440.0032580.02760.489012
45-0.042396-0.35970.360047
46-0.13021-1.10490.136448
47-0.031404-0.26650.39532
480.0399380.33890.367841

\begin{tabular}{lllllllll}
\hline
Partial Autocorrelation Function \tabularnewline
Time lag k & PACF(k) & T-STAT & P-value \tabularnewline
1 & 0.88354 & 7.4971 & 0 \tabularnewline
2 & -0.114722 & -0.9735 & 0.166794 \tabularnewline
3 & -0.050187 & -0.4259 & 0.335742 \tabularnewline
4 & 0.013693 & 0.1162 & 0.453915 \tabularnewline
5 & -0.013056 & -0.1108 & 0.456047 \tabularnewline
6 & -0.112188 & -0.9519 & 0.172154 \tabularnewline
7 & -0.006997 & -0.0594 & 0.47641 \tabularnewline
8 & -0.028512 & -0.2419 & 0.40476 \tabularnewline
9 & 0.002659 & 0.0226 & 0.49103 \tabularnewline
10 & 0.092759 & 0.7871 & 0.216908 \tabularnewline
11 & -0.006966 & -0.0591 & 0.476514 \tabularnewline
12 & -0.081084 & -0.688 & 0.246826 \tabularnewline
13 & -0.123817 & -1.0506 & 0.148472 \tabularnewline
14 & -0.059497 & -0.5049 & 0.307602 \tabularnewline
15 & -0.073818 & -0.6264 & 0.266527 \tabularnewline
16 & 0.033179 & 0.2815 & 0.389555 \tabularnewline
17 & 0.020108 & 0.1706 & 0.432501 \tabularnewline
18 & -0.055238 & -0.4687 & 0.320345 \tabularnewline
19 & 0.004526 & 0.0384 & 0.484735 \tabularnewline
20 & -0.058402 & -0.4956 & 0.310857 \tabularnewline
21 & -0.056478 & -0.4792 & 0.316614 \tabularnewline
22 & 0.048318 & 0.41 & 0.341514 \tabularnewline
23 & 0.01557 & 0.1321 & 0.447632 \tabularnewline
24 & -0.028194 & -0.2392 & 0.405801 \tabularnewline
25 & -0.022422 & -0.1903 & 0.424822 \tabularnewline
26 & -0.028049 & -0.238 & 0.406276 \tabularnewline
27 & -0.003008 & -0.0255 & 0.489855 \tabularnewline
28 & 0.129464 & 1.0985 & 0.137814 \tabularnewline
29 & 0.067608 & 0.5737 & 0.283987 \tabularnewline
30 & 0.056213 & 0.477 & 0.317409 \tabularnewline
31 & 0.109785 & 0.9316 & 0.177339 \tabularnewline
32 & 0.008868 & 0.0753 & 0.470112 \tabularnewline
33 & 0.066313 & 0.5627 & 0.287699 \tabularnewline
34 & 0.174983 & 1.4848 & 0.070983 \tabularnewline
35 & 0.095298 & 0.8086 & 0.210695 \tabularnewline
36 & 0.11201 & 0.9504 & 0.172534 \tabularnewline
37 & -0.55545 & -4.7132 & 6e-06 \tabularnewline
38 & 0.068773 & 0.5836 & 0.280669 \tabularnewline
39 & -0.009974 & -0.0846 & 0.466394 \tabularnewline
40 & -0.04532 & -0.3846 & 0.350852 \tabularnewline
41 & -0.037165 & -0.3154 & 0.376702 \tabularnewline
42 & 0.048291 & 0.4098 & 0.341598 \tabularnewline
43 & -0.023805 & -0.202 & 0.420247 \tabularnewline
44 & 0.003258 & 0.0276 & 0.489012 \tabularnewline
45 & -0.042396 & -0.3597 & 0.360047 \tabularnewline
46 & -0.13021 & -1.1049 & 0.136448 \tabularnewline
47 & -0.031404 & -0.2665 & 0.39532 \tabularnewline
48 & 0.039938 & 0.3389 & 0.367841 \tabularnewline
\hline
\end{tabular}
%Source: https://freestatistics.org/blog/index.php?pk=&T=2

[TABLE]
[ROW][C]Partial Autocorrelation Function[/C][/ROW]
[ROW][C]Time lag k[/C][C]PACF(k)[/C][C]T-STAT[/C][C]P-value[/C][/ROW]
[ROW][C]1[/C][C]0.88354[/C][C]7.4971[/C][C]0[/C][/ROW]
[ROW][C]2[/C][C]-0.114722[/C][C]-0.9735[/C][C]0.166794[/C][/ROW]
[ROW][C]3[/C][C]-0.050187[/C][C]-0.4259[/C][C]0.335742[/C][/ROW]
[ROW][C]4[/C][C]0.013693[/C][C]0.1162[/C][C]0.453915[/C][/ROW]
[ROW][C]5[/C][C]-0.013056[/C][C]-0.1108[/C][C]0.456047[/C][/ROW]
[ROW][C]6[/C][C]-0.112188[/C][C]-0.9519[/C][C]0.172154[/C][/ROW]
[ROW][C]7[/C][C]-0.006997[/C][C]-0.0594[/C][C]0.47641[/C][/ROW]
[ROW][C]8[/C][C]-0.028512[/C][C]-0.2419[/C][C]0.40476[/C][/ROW]
[ROW][C]9[/C][C]0.002659[/C][C]0.0226[/C][C]0.49103[/C][/ROW]
[ROW][C]10[/C][C]0.092759[/C][C]0.7871[/C][C]0.216908[/C][/ROW]
[ROW][C]11[/C][C]-0.006966[/C][C]-0.0591[/C][C]0.476514[/C][/ROW]
[ROW][C]12[/C][C]-0.081084[/C][C]-0.688[/C][C]0.246826[/C][/ROW]
[ROW][C]13[/C][C]-0.123817[/C][C]-1.0506[/C][C]0.148472[/C][/ROW]
[ROW][C]14[/C][C]-0.059497[/C][C]-0.5049[/C][C]0.307602[/C][/ROW]
[ROW][C]15[/C][C]-0.073818[/C][C]-0.6264[/C][C]0.266527[/C][/ROW]
[ROW][C]16[/C][C]0.033179[/C][C]0.2815[/C][C]0.389555[/C][/ROW]
[ROW][C]17[/C][C]0.020108[/C][C]0.1706[/C][C]0.432501[/C][/ROW]
[ROW][C]18[/C][C]-0.055238[/C][C]-0.4687[/C][C]0.320345[/C][/ROW]
[ROW][C]19[/C][C]0.004526[/C][C]0.0384[/C][C]0.484735[/C][/ROW]
[ROW][C]20[/C][C]-0.058402[/C][C]-0.4956[/C][C]0.310857[/C][/ROW]
[ROW][C]21[/C][C]-0.056478[/C][C]-0.4792[/C][C]0.316614[/C][/ROW]
[ROW][C]22[/C][C]0.048318[/C][C]0.41[/C][C]0.341514[/C][/ROW]
[ROW][C]23[/C][C]0.01557[/C][C]0.1321[/C][C]0.447632[/C][/ROW]
[ROW][C]24[/C][C]-0.028194[/C][C]-0.2392[/C][C]0.405801[/C][/ROW]
[ROW][C]25[/C][C]-0.022422[/C][C]-0.1903[/C][C]0.424822[/C][/ROW]
[ROW][C]26[/C][C]-0.028049[/C][C]-0.238[/C][C]0.406276[/C][/ROW]
[ROW][C]27[/C][C]-0.003008[/C][C]-0.0255[/C][C]0.489855[/C][/ROW]
[ROW][C]28[/C][C]0.129464[/C][C]1.0985[/C][C]0.137814[/C][/ROW]
[ROW][C]29[/C][C]0.067608[/C][C]0.5737[/C][C]0.283987[/C][/ROW]
[ROW][C]30[/C][C]0.056213[/C][C]0.477[/C][C]0.317409[/C][/ROW]
[ROW][C]31[/C][C]0.109785[/C][C]0.9316[/C][C]0.177339[/C][/ROW]
[ROW][C]32[/C][C]0.008868[/C][C]0.0753[/C][C]0.470112[/C][/ROW]
[ROW][C]33[/C][C]0.066313[/C][C]0.5627[/C][C]0.287699[/C][/ROW]
[ROW][C]34[/C][C]0.174983[/C][C]1.4848[/C][C]0.070983[/C][/ROW]
[ROW][C]35[/C][C]0.095298[/C][C]0.8086[/C][C]0.210695[/C][/ROW]
[ROW][C]36[/C][C]0.11201[/C][C]0.9504[/C][C]0.172534[/C][/ROW]
[ROW][C]37[/C][C]-0.55545[/C][C]-4.7132[/C][C]6e-06[/C][/ROW]
[ROW][C]38[/C][C]0.068773[/C][C]0.5836[/C][C]0.280669[/C][/ROW]
[ROW][C]39[/C][C]-0.009974[/C][C]-0.0846[/C][C]0.466394[/C][/ROW]
[ROW][C]40[/C][C]-0.04532[/C][C]-0.3846[/C][C]0.350852[/C][/ROW]
[ROW][C]41[/C][C]-0.037165[/C][C]-0.3154[/C][C]0.376702[/C][/ROW]
[ROW][C]42[/C][C]0.048291[/C][C]0.4098[/C][C]0.341598[/C][/ROW]
[ROW][C]43[/C][C]-0.023805[/C][C]-0.202[/C][C]0.420247[/C][/ROW]
[ROW][C]44[/C][C]0.003258[/C][C]0.0276[/C][C]0.489012[/C][/ROW]
[ROW][C]45[/C][C]-0.042396[/C][C]-0.3597[/C][C]0.360047[/C][/ROW]
[ROW][C]46[/C][C]-0.13021[/C][C]-1.1049[/C][C]0.136448[/C][/ROW]
[ROW][C]47[/C][C]-0.031404[/C][C]-0.2665[/C][C]0.39532[/C][/ROW]
[ROW][C]48[/C][C]0.039938[/C][C]0.3389[/C][C]0.367841[/C][/ROW]
[/TABLE]
Source: https://freestatistics.org/blog/index.php?pk=&T=2

Globally Unique Identifier (entire table): ba.freestatistics.org/blog/index.php?pk=&T=2

As an alternative you can also use a QR Code:  

The GUIDs for individual cells are displayed in the table below:

Partial Autocorrelation Function
Time lag kPACF(k)T-STATP-value
10.883547.49710
2-0.114722-0.97350.166794
3-0.050187-0.42590.335742
40.0136930.11620.453915
5-0.013056-0.11080.456047
6-0.112188-0.95190.172154
7-0.006997-0.05940.47641
8-0.028512-0.24190.40476
90.0026590.02260.49103
100.0927590.78710.216908
11-0.006966-0.05910.476514
12-0.081084-0.6880.246826
13-0.123817-1.05060.148472
14-0.059497-0.50490.307602
15-0.073818-0.62640.266527
160.0331790.28150.389555
170.0201080.17060.432501
18-0.055238-0.46870.320345
190.0045260.03840.484735
20-0.058402-0.49560.310857
21-0.056478-0.47920.316614
220.0483180.410.341514
230.015570.13210.447632
24-0.028194-0.23920.405801
25-0.022422-0.19030.424822
26-0.028049-0.2380.406276
27-0.003008-0.02550.489855
280.1294641.09850.137814
290.0676080.57370.283987
300.0562130.4770.317409
310.1097850.93160.177339
320.0088680.07530.470112
330.0663130.56270.287699
340.1749831.48480.070983
350.0952980.80860.210695
360.112010.95040.172534
37-0.55545-4.71326e-06
380.0687730.58360.280669
39-0.009974-0.08460.466394
40-0.04532-0.38460.350852
41-0.037165-0.31540.376702
420.0482910.40980.341598
43-0.023805-0.2020.420247
440.0032580.02760.489012
45-0.042396-0.35970.360047
46-0.13021-1.10490.136448
47-0.031404-0.26650.39532
480.0399380.33890.367841


Parameters (Session):
par1 = 48 ; par2 = 1 ; par3 = 0 ; par4 = 0 ; par5 = 12 ; par6 = White Noise ; par7 = 0.95 ;
Parameters (R input):
par1 = 48 ; par2 = 1 ; par3 = 0 ; par4 = 0 ; par5 = 12 ; par6 = White Noise ; par7 = 0.95 ; par8 = ;
R code (references can be found in the software module):
if (par1 == 'Default') {
par1 = 10*log10(length(x))
} else {
par1 <- as.numeric(par1)
}
par2 <- as.numeric(par2)
par3 <- as.numeric(par3)
par4 <- as.numeric(par4)
par5 <- as.numeric(par5)
if (par6 == 'White Noise') par6 <- 'white' else par6 <- 'ma'
par7 <- as.numeric(par7)
if (par8 != '') par8 <- as.numeric(par8)
x <- na.omit(x)
ox <- x
if (par8 == '') {
if (par2 == 0) {
x <- log(x)
} else {
x <- (x ^ par2 - 1) / par2
}
} else {
x <- log(x,base=par8)
}
if (par3 > 0) x <- diff(x,lag=1,difference=par3)
if (par4 > 0) x <- diff(x,lag=par5,difference=par4)
bitmap(file='picts.png')
op <- par(mfrow=c(2,1))
plot(ox,type='l',main='Original Time Series',xlab='time',ylab='value')
if (par8=='') {
mytitle <- paste('Working Time Series (lambda=',par2,', d=',par3,', D=',par4,')',sep='')
mysub <- paste('(lambda=',par2,', d=',par3,', D=',par4,', CI=', par7, ', CI type=',par6,')',sep='')
} else {
mytitle <- paste('Working Time Series (base=',par8,', d=',par3,', D=',par4,')',sep='')
mysub <- paste('(base=',par8,', d=',par3,', D=',par4,', CI=', par7, ', CI type=',par6,')',sep='')
}
plot(x,type='l', main=mytitle,xlab='time',ylab='value')
par(op)
dev.off()
bitmap(file='pic1.png')
racf <- acf(x, par1, main='Autocorrelation', xlab='time lag', ylab='ACF', ci.type=par6, ci=par7, sub=mysub)
dev.off()
bitmap(file='pic2.png')
rpacf <- pacf(x,par1,main='Partial Autocorrelation',xlab='lags',ylab='PACF',sub=mysub)
dev.off()
(myacf <- c(racf$acf))
(mypacf <- c(rpacf$acf))
lengthx <- length(x)
sqrtn <- sqrt(lengthx)
load(file='createtable')
a<-table.start()
a<-table.row.start(a)
a<-table.element(a,'Autocorrelation Function',4,TRUE)
a<-table.row.end(a)
a<-table.row.start(a)
a<-table.element(a,'Time lag k',header=TRUE)
a<-table.element(a,hyperlink('basics.htm','ACF(k)','click here for more information about the Autocorrelation Function'),header=TRUE)
a<-table.element(a,'T-STAT',header=TRUE)
a<-table.element(a,'P-value',header=TRUE)
a<-table.row.end(a)
for (i in 2:(par1+1)) {
a<-table.row.start(a)
a<-table.element(a,i-1,header=TRUE)
a<-table.element(a,round(myacf[i],6))
mytstat <- myacf[i]*sqrtn
a<-table.element(a,round(mytstat,4))
a<-table.element(a,round(1-pt(abs(mytstat),lengthx),6))
a<-table.row.end(a)
}
a<-table.end(a)
table.save(a,file='mytable.tab')
a<-table.start()
a<-table.row.start(a)
a<-table.element(a,'Partial Autocorrelation Function',4,TRUE)
a<-table.row.end(a)
a<-table.row.start(a)
a<-table.element(a,'Time lag k',header=TRUE)
a<-table.element(a,hyperlink('basics.htm','PACF(k)','click here for more information about the Partial Autocorrelation Function'),header=TRUE)
a<-table.element(a,'T-STAT',header=TRUE)
a<-table.element(a,'P-value',header=TRUE)
a<-table.row.end(a)
for (i in 1:par1) {
a<-table.row.start(a)
a<-table.element(a,i,header=TRUE)
a<-table.element(a,round(mypacf[i],6))
mytstat <- mypacf[i]*sqrtn
a<-table.element(a,round(mytstat,4))
a<-table.element(a,round(1-pt(abs(mytstat),lengthx),6))
a<-table.row.end(a)
}
a<-table.end(a)
table.save(a,file='mytable1.tab')