Free Statistics

of Irreproducible Research!

Author's title

Author*Unverified author*
R Software Modulerwasp_autocorrelation.wasp
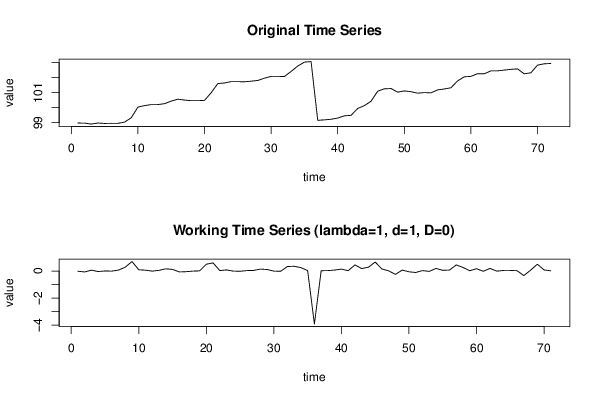
Title produced by software(Partial) Autocorrelation Function
Date of computationWed, 19 Oct 2016 21:43:43 +0100
Cite this page as followsStatistical Computations at FreeStatistics.org, Office for Research Development and Education, URL https://freestatistics.org/blog/index.php?v=date/2016/Oct/19/t1476909909mhvtvb11ot02yj6.htm/, Retrieved Tue, 30 Apr 2024 05:55:38 +0200
Statistical Computations at FreeStatistics.org, Office for Research Development and Education, URL https://freestatistics.org/blog/index.php?pk=, Retrieved Tue, 30 Apr 2024 05:55:38 +0200
QR Codes:

Original text written by user:
IsPrivate?No (this computation is public)
User-defined keywords
Estimated Impact0
Dataseries X:
98.98
98.97
98.91
98.98
98.95
98.96
98.96
99.04
99.33
100.04
100.14
100.21
100.21
100.27
100.44
100.57
100.51
100.47
100.47
100.49
101
101.61
101.65
101.74
101.74
101.73
101.77
101.82
101.97
102.09
102.09
102.08
102.42
102.78
103.04
103.08
99.16
99.19
99.23
99.31
99.46
99.49
99.95
100.14
100.43
101.1
101.26
101.28
101.04
101.12
101.07
100.97
101.01
100.99
101.19
101.25
101.33
101.79
102.06
102.09
102.27
102.26
102.46
102.46
102.51
102.56
102.59
102.26
102.33
102.84
102.93
102.95


Summary of computational transaction
Raw Inputview raw input (R code)
Raw Outputview raw output of R engine
Computing time2 seconds
R Server'Gwilym Jenkins' @ jenkins.wessa.net

\begin{tabular}{lllllllll}
\hline
Summary of computational transaction \tabularnewline
Raw Input & view raw input (R code)  \tabularnewline
Raw Output & view raw output of R engine  \tabularnewline
Computing time & 2 seconds \tabularnewline
R Server & 'Gwilym Jenkins' @ jenkins.wessa.net \tabularnewline
\hline
\end{tabular}
%Source: https://freestatistics.org/blog/index.php?pk=&T=0

[TABLE]
[ROW][C]Summary of computational transaction[/C][/ROW]
[ROW][C]Raw Input[/C][C]view raw input (R code) [/C][/ROW]
[ROW][C]Raw Output[/C][C]view raw output of R engine [/C][/ROW]
[ROW][C]Computing time[/C][C]2 seconds[/C][/ROW]
[ROW][C]R Server[/C][C]'Gwilym Jenkins' @ jenkins.wessa.net[/C][/ROW]
[/TABLE]
Source: https://freestatistics.org/blog/index.php?pk=&T=0

Globally Unique Identifier (entire table): ba.freestatistics.org/blog/index.php?pk=&T=0

As an alternative you can also use a QR Code:  

The GUIDs for individual cells are displayed in the table below:

Summary of computational transaction
Raw Inputview raw input (R code)
Raw Outputview raw output of R engine
Computing time2 seconds
R Server'Gwilym Jenkins' @ jenkins.wessa.net


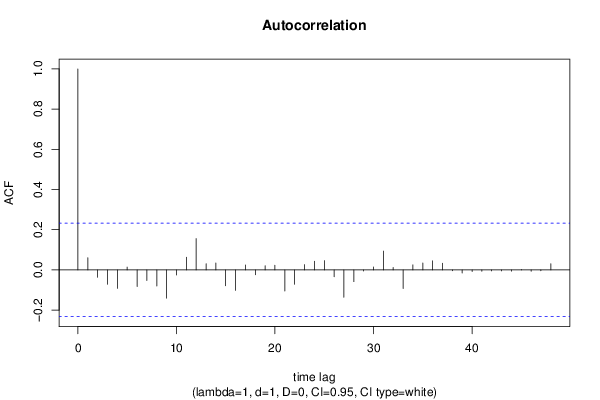
Autocorrelation Function
Time lag kACF(k)T-STATP-value
10.0604680.50950.305988
2-0.036817-0.31020.37865
3-0.071771-0.60480.273635
4-0.091809-0.77360.22087
50.0139340.11740.453433
6-0.082762-0.69740.243926
7-0.052533-0.44260.329683
8-0.079733-0.67180.251933
9-0.140383-1.18290.1204
10-0.025414-0.21410.415526
110.0628620.52970.29899
120.155581.31090.097051
130.0304470.25650.399135
140.0346550.2920.385567
15-0.079024-0.66590.253826
16-0.101783-0.85760.19699
170.0242850.20460.419225
18-0.024348-0.20520.419018
190.0207840.17510.430739
200.0236190.1990.42141
21-0.105272-0.8870.189026
22-0.071148-0.59950.275373
230.0262140.22090.41291
240.0435290.36680.357436
250.0461320.38870.349324
26-0.034006-0.28650.387649
27-0.135943-1.14550.127928
28-0.058345-0.49160.312251
29-0.005203-0.04380.482577
300.0146940.12380.450905
310.0935940.78860.216474
320.0116490.09820.461043
33-0.092725-0.78130.218606
340.0251690.21210.416327
350.0341380.28760.387227
360.044990.37910.352875
370.0330790.27870.390632
38-0.004518-0.03810.484871
39-0.015269-0.12870.448995
40-0.007769-0.06550.473994
41-0.007014-0.05910.476519
42-0.004807-0.04050.483902
43-0.004791-0.04040.483958
44-0.006184-0.05210.479294
450.0013730.01160.495401
46-0.006908-0.05820.476874
47-0.004505-0.0380.484915
480.0303450.25570.399464

\begin{tabular}{lllllllll}
\hline
Autocorrelation Function \tabularnewline
Time lag k & ACF(k) & T-STAT & P-value \tabularnewline
1 & 0.060468 & 0.5095 & 0.305988 \tabularnewline
2 & -0.036817 & -0.3102 & 0.37865 \tabularnewline
3 & -0.071771 & -0.6048 & 0.273635 \tabularnewline
4 & -0.091809 & -0.7736 & 0.22087 \tabularnewline
5 & 0.013934 & 0.1174 & 0.453433 \tabularnewline
6 & -0.082762 & -0.6974 & 0.243926 \tabularnewline
7 & -0.052533 & -0.4426 & 0.329683 \tabularnewline
8 & -0.079733 & -0.6718 & 0.251933 \tabularnewline
9 & -0.140383 & -1.1829 & 0.1204 \tabularnewline
10 & -0.025414 & -0.2141 & 0.415526 \tabularnewline
11 & 0.062862 & 0.5297 & 0.29899 \tabularnewline
12 & 0.15558 & 1.3109 & 0.097051 \tabularnewline
13 & 0.030447 & 0.2565 & 0.399135 \tabularnewline
14 & 0.034655 & 0.292 & 0.385567 \tabularnewline
15 & -0.079024 & -0.6659 & 0.253826 \tabularnewline
16 & -0.101783 & -0.8576 & 0.19699 \tabularnewline
17 & 0.024285 & 0.2046 & 0.419225 \tabularnewline
18 & -0.024348 & -0.2052 & 0.419018 \tabularnewline
19 & 0.020784 & 0.1751 & 0.430739 \tabularnewline
20 & 0.023619 & 0.199 & 0.42141 \tabularnewline
21 & -0.105272 & -0.887 & 0.189026 \tabularnewline
22 & -0.071148 & -0.5995 & 0.275373 \tabularnewline
23 & 0.026214 & 0.2209 & 0.41291 \tabularnewline
24 & 0.043529 & 0.3668 & 0.357436 \tabularnewline
25 & 0.046132 & 0.3887 & 0.349324 \tabularnewline
26 & -0.034006 & -0.2865 & 0.387649 \tabularnewline
27 & -0.135943 & -1.1455 & 0.127928 \tabularnewline
28 & -0.058345 & -0.4916 & 0.312251 \tabularnewline
29 & -0.005203 & -0.0438 & 0.482577 \tabularnewline
30 & 0.014694 & 0.1238 & 0.450905 \tabularnewline
31 & 0.093594 & 0.7886 & 0.216474 \tabularnewline
32 & 0.011649 & 0.0982 & 0.461043 \tabularnewline
33 & -0.092725 & -0.7813 & 0.218606 \tabularnewline
34 & 0.025169 & 0.2121 & 0.416327 \tabularnewline
35 & 0.034138 & 0.2876 & 0.387227 \tabularnewline
36 & 0.04499 & 0.3791 & 0.352875 \tabularnewline
37 & 0.033079 & 0.2787 & 0.390632 \tabularnewline
38 & -0.004518 & -0.0381 & 0.484871 \tabularnewline
39 & -0.015269 & -0.1287 & 0.448995 \tabularnewline
40 & -0.007769 & -0.0655 & 0.473994 \tabularnewline
41 & -0.007014 & -0.0591 & 0.476519 \tabularnewline
42 & -0.004807 & -0.0405 & 0.483902 \tabularnewline
43 & -0.004791 & -0.0404 & 0.483958 \tabularnewline
44 & -0.006184 & -0.0521 & 0.479294 \tabularnewline
45 & 0.001373 & 0.0116 & 0.495401 \tabularnewline
46 & -0.006908 & -0.0582 & 0.476874 \tabularnewline
47 & -0.004505 & -0.038 & 0.484915 \tabularnewline
48 & 0.030345 & 0.2557 & 0.399464 \tabularnewline
\hline
\end{tabular}
%Source: https://freestatistics.org/blog/index.php?pk=&T=1

[TABLE]
[ROW][C]Autocorrelation Function[/C][/ROW]
[ROW][C]Time lag k[/C][C]ACF(k)[/C][C]T-STAT[/C][C]P-value[/C][/ROW]
[ROW][C]1[/C][C]0.060468[/C][C]0.5095[/C][C]0.305988[/C][/ROW]
[ROW][C]2[/C][C]-0.036817[/C][C]-0.3102[/C][C]0.37865[/C][/ROW]
[ROW][C]3[/C][C]-0.071771[/C][C]-0.6048[/C][C]0.273635[/C][/ROW]
[ROW][C]4[/C][C]-0.091809[/C][C]-0.7736[/C][C]0.22087[/C][/ROW]
[ROW][C]5[/C][C]0.013934[/C][C]0.1174[/C][C]0.453433[/C][/ROW]
[ROW][C]6[/C][C]-0.082762[/C][C]-0.6974[/C][C]0.243926[/C][/ROW]
[ROW][C]7[/C][C]-0.052533[/C][C]-0.4426[/C][C]0.329683[/C][/ROW]
[ROW][C]8[/C][C]-0.079733[/C][C]-0.6718[/C][C]0.251933[/C][/ROW]
[ROW][C]9[/C][C]-0.140383[/C][C]-1.1829[/C][C]0.1204[/C][/ROW]
[ROW][C]10[/C][C]-0.025414[/C][C]-0.2141[/C][C]0.415526[/C][/ROW]
[ROW][C]11[/C][C]0.062862[/C][C]0.5297[/C][C]0.29899[/C][/ROW]
[ROW][C]12[/C][C]0.15558[/C][C]1.3109[/C][C]0.097051[/C][/ROW]
[ROW][C]13[/C][C]0.030447[/C][C]0.2565[/C][C]0.399135[/C][/ROW]
[ROW][C]14[/C][C]0.034655[/C][C]0.292[/C][C]0.385567[/C][/ROW]
[ROW][C]15[/C][C]-0.079024[/C][C]-0.6659[/C][C]0.253826[/C][/ROW]
[ROW][C]16[/C][C]-0.101783[/C][C]-0.8576[/C][C]0.19699[/C][/ROW]
[ROW][C]17[/C][C]0.024285[/C][C]0.2046[/C][C]0.419225[/C][/ROW]
[ROW][C]18[/C][C]-0.024348[/C][C]-0.2052[/C][C]0.419018[/C][/ROW]
[ROW][C]19[/C][C]0.020784[/C][C]0.1751[/C][C]0.430739[/C][/ROW]
[ROW][C]20[/C][C]0.023619[/C][C]0.199[/C][C]0.42141[/C][/ROW]
[ROW][C]21[/C][C]-0.105272[/C][C]-0.887[/C][C]0.189026[/C][/ROW]
[ROW][C]22[/C][C]-0.071148[/C][C]-0.5995[/C][C]0.275373[/C][/ROW]
[ROW][C]23[/C][C]0.026214[/C][C]0.2209[/C][C]0.41291[/C][/ROW]
[ROW][C]24[/C][C]0.043529[/C][C]0.3668[/C][C]0.357436[/C][/ROW]
[ROW][C]25[/C][C]0.046132[/C][C]0.3887[/C][C]0.349324[/C][/ROW]
[ROW][C]26[/C][C]-0.034006[/C][C]-0.2865[/C][C]0.387649[/C][/ROW]
[ROW][C]27[/C][C]-0.135943[/C][C]-1.1455[/C][C]0.127928[/C][/ROW]
[ROW][C]28[/C][C]-0.058345[/C][C]-0.4916[/C][C]0.312251[/C][/ROW]
[ROW][C]29[/C][C]-0.005203[/C][C]-0.0438[/C][C]0.482577[/C][/ROW]
[ROW][C]30[/C][C]0.014694[/C][C]0.1238[/C][C]0.450905[/C][/ROW]
[ROW][C]31[/C][C]0.093594[/C][C]0.7886[/C][C]0.216474[/C][/ROW]
[ROW][C]32[/C][C]0.011649[/C][C]0.0982[/C][C]0.461043[/C][/ROW]
[ROW][C]33[/C][C]-0.092725[/C][C]-0.7813[/C][C]0.218606[/C][/ROW]
[ROW][C]34[/C][C]0.025169[/C][C]0.2121[/C][C]0.416327[/C][/ROW]
[ROW][C]35[/C][C]0.034138[/C][C]0.2876[/C][C]0.387227[/C][/ROW]
[ROW][C]36[/C][C]0.04499[/C][C]0.3791[/C][C]0.352875[/C][/ROW]
[ROW][C]37[/C][C]0.033079[/C][C]0.2787[/C][C]0.390632[/C][/ROW]
[ROW][C]38[/C][C]-0.004518[/C][C]-0.0381[/C][C]0.484871[/C][/ROW]
[ROW][C]39[/C][C]-0.015269[/C][C]-0.1287[/C][C]0.448995[/C][/ROW]
[ROW][C]40[/C][C]-0.007769[/C][C]-0.0655[/C][C]0.473994[/C][/ROW]
[ROW][C]41[/C][C]-0.007014[/C][C]-0.0591[/C][C]0.476519[/C][/ROW]
[ROW][C]42[/C][C]-0.004807[/C][C]-0.0405[/C][C]0.483902[/C][/ROW]
[ROW][C]43[/C][C]-0.004791[/C][C]-0.0404[/C][C]0.483958[/C][/ROW]
[ROW][C]44[/C][C]-0.006184[/C][C]-0.0521[/C][C]0.479294[/C][/ROW]
[ROW][C]45[/C][C]0.001373[/C][C]0.0116[/C][C]0.495401[/C][/ROW]
[ROW][C]46[/C][C]-0.006908[/C][C]-0.0582[/C][C]0.476874[/C][/ROW]
[ROW][C]47[/C][C]-0.004505[/C][C]-0.038[/C][C]0.484915[/C][/ROW]
[ROW][C]48[/C][C]0.030345[/C][C]0.2557[/C][C]0.399464[/C][/ROW]
[/TABLE]
Source: https://freestatistics.org/blog/index.php?pk=&T=1

Globally Unique Identifier (entire table): ba.freestatistics.org/blog/index.php?pk=&T=1

As an alternative you can also use a QR Code:  

The GUIDs for individual cells are displayed in the table below:

Autocorrelation Function
Time lag kACF(k)T-STATP-value
10.0604680.50950.305988
2-0.036817-0.31020.37865
3-0.071771-0.60480.273635
4-0.091809-0.77360.22087
50.0139340.11740.453433
6-0.082762-0.69740.243926
7-0.052533-0.44260.329683
8-0.079733-0.67180.251933
9-0.140383-1.18290.1204
10-0.025414-0.21410.415526
110.0628620.52970.29899
120.155581.31090.097051
130.0304470.25650.399135
140.0346550.2920.385567
15-0.079024-0.66590.253826
16-0.101783-0.85760.19699
170.0242850.20460.419225
18-0.024348-0.20520.419018
190.0207840.17510.430739
200.0236190.1990.42141
21-0.105272-0.8870.189026
22-0.071148-0.59950.275373
230.0262140.22090.41291
240.0435290.36680.357436
250.0461320.38870.349324
26-0.034006-0.28650.387649
27-0.135943-1.14550.127928
28-0.058345-0.49160.312251
29-0.005203-0.04380.482577
300.0146940.12380.450905
310.0935940.78860.216474
320.0116490.09820.461043
33-0.092725-0.78130.218606
340.0251690.21210.416327
350.0341380.28760.387227
360.044990.37910.352875
370.0330790.27870.390632
38-0.004518-0.03810.484871
39-0.015269-0.12870.448995
40-0.007769-0.06550.473994
41-0.007014-0.05910.476519
42-0.004807-0.04050.483902
43-0.004791-0.04040.483958
44-0.006184-0.05210.479294
450.0013730.01160.495401
46-0.006908-0.05820.476874
47-0.004505-0.0380.484915
480.0303450.25570.399464


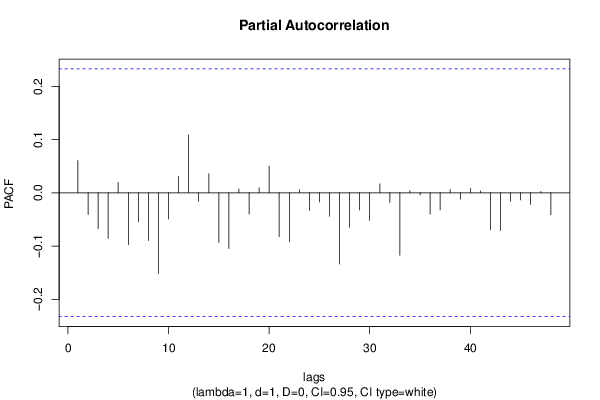
Partial Autocorrelation Function
Time lag kPACF(k)T-STATP-value
10.0604680.50950.305988
2-0.040621-0.34230.366575
3-0.067355-0.56750.286067
4-0.085595-0.72120.236565
50.0193110.16270.435602
6-0.097527-0.82180.206978
7-0.05441-0.45850.32401
8-0.089597-0.7550.226386
9-0.151502-1.27660.102955
10-0.049244-0.41490.339718
110.0309490.26080.397509
120.1084760.9140.181897
13-0.015974-0.13460.446654
140.0357420.30120.382082
15-0.093219-0.78550.217395
16-0.10465-0.88180.190432
170.007330.06180.475463
18-0.039821-0.33550.369106
190.0094990.080.468214
200.0498250.41980.337936
21-0.08261-0.69610.244323
22-0.09227-0.77750.219729
230.0055910.04710.481278
24-0.033203-0.27980.390232
25-0.017146-0.14450.442767
26-0.043934-0.37020.356171
27-0.133866-1.1280.131564
28-0.064578-0.54410.294024
29-0.032338-0.27250.393021
30-0.051453-0.43350.332965
310.0168090.14160.443884
32-0.018082-0.15240.439668
33-0.117261-0.98810.163239
340.0038150.03210.487223
35-0.004024-0.03390.486522
36-0.040084-0.33780.368273
37-0.032073-0.27030.393874
380.0060160.05070.479857
39-0.011888-0.10020.460245
400.0082070.06920.47253
410.0033780.02850.488685
42-0.069552-0.58610.279848
43-0.070946-0.59780.275938
44-0.015779-0.1330.447302
45-0.013336-0.11240.455424
46-0.021953-0.1850.426886
470.0026260.02210.491205
48-0.041226-0.34740.364669

\begin{tabular}{lllllllll}
\hline
Partial Autocorrelation Function \tabularnewline
Time lag k & PACF(k) & T-STAT & P-value \tabularnewline
1 & 0.060468 & 0.5095 & 0.305988 \tabularnewline
2 & -0.040621 & -0.3423 & 0.366575 \tabularnewline
3 & -0.067355 & -0.5675 & 0.286067 \tabularnewline
4 & -0.085595 & -0.7212 & 0.236565 \tabularnewline
5 & 0.019311 & 0.1627 & 0.435602 \tabularnewline
6 & -0.097527 & -0.8218 & 0.206978 \tabularnewline
7 & -0.05441 & -0.4585 & 0.32401 \tabularnewline
8 & -0.089597 & -0.755 & 0.226386 \tabularnewline
9 & -0.151502 & -1.2766 & 0.102955 \tabularnewline
10 & -0.049244 & -0.4149 & 0.339718 \tabularnewline
11 & 0.030949 & 0.2608 & 0.397509 \tabularnewline
12 & 0.108476 & 0.914 & 0.181897 \tabularnewline
13 & -0.015974 & -0.1346 & 0.446654 \tabularnewline
14 & 0.035742 & 0.3012 & 0.382082 \tabularnewline
15 & -0.093219 & -0.7855 & 0.217395 \tabularnewline
16 & -0.10465 & -0.8818 & 0.190432 \tabularnewline
17 & 0.00733 & 0.0618 & 0.475463 \tabularnewline
18 & -0.039821 & -0.3355 & 0.369106 \tabularnewline
19 & 0.009499 & 0.08 & 0.468214 \tabularnewline
20 & 0.049825 & 0.4198 & 0.337936 \tabularnewline
21 & -0.08261 & -0.6961 & 0.244323 \tabularnewline
22 & -0.09227 & -0.7775 & 0.219729 \tabularnewline
23 & 0.005591 & 0.0471 & 0.481278 \tabularnewline
24 & -0.033203 & -0.2798 & 0.390232 \tabularnewline
25 & -0.017146 & -0.1445 & 0.442767 \tabularnewline
26 & -0.043934 & -0.3702 & 0.356171 \tabularnewline
27 & -0.133866 & -1.128 & 0.131564 \tabularnewline
28 & -0.064578 & -0.5441 & 0.294024 \tabularnewline
29 & -0.032338 & -0.2725 & 0.393021 \tabularnewline
30 & -0.051453 & -0.4335 & 0.332965 \tabularnewline
31 & 0.016809 & 0.1416 & 0.443884 \tabularnewline
32 & -0.018082 & -0.1524 & 0.439668 \tabularnewline
33 & -0.117261 & -0.9881 & 0.163239 \tabularnewline
34 & 0.003815 & 0.0321 & 0.487223 \tabularnewline
35 & -0.004024 & -0.0339 & 0.486522 \tabularnewline
36 & -0.040084 & -0.3378 & 0.368273 \tabularnewline
37 & -0.032073 & -0.2703 & 0.393874 \tabularnewline
38 & 0.006016 & 0.0507 & 0.479857 \tabularnewline
39 & -0.011888 & -0.1002 & 0.460245 \tabularnewline
40 & 0.008207 & 0.0692 & 0.47253 \tabularnewline
41 & 0.003378 & 0.0285 & 0.488685 \tabularnewline
42 & -0.069552 & -0.5861 & 0.279848 \tabularnewline
43 & -0.070946 & -0.5978 & 0.275938 \tabularnewline
44 & -0.015779 & -0.133 & 0.447302 \tabularnewline
45 & -0.013336 & -0.1124 & 0.455424 \tabularnewline
46 & -0.021953 & -0.185 & 0.426886 \tabularnewline
47 & 0.002626 & 0.0221 & 0.491205 \tabularnewline
48 & -0.041226 & -0.3474 & 0.364669 \tabularnewline
\hline
\end{tabular}
%Source: https://freestatistics.org/blog/index.php?pk=&T=2

[TABLE]
[ROW][C]Partial Autocorrelation Function[/C][/ROW]
[ROW][C]Time lag k[/C][C]PACF(k)[/C][C]T-STAT[/C][C]P-value[/C][/ROW]
[ROW][C]1[/C][C]0.060468[/C][C]0.5095[/C][C]0.305988[/C][/ROW]
[ROW][C]2[/C][C]-0.040621[/C][C]-0.3423[/C][C]0.366575[/C][/ROW]
[ROW][C]3[/C][C]-0.067355[/C][C]-0.5675[/C][C]0.286067[/C][/ROW]
[ROW][C]4[/C][C]-0.085595[/C][C]-0.7212[/C][C]0.236565[/C][/ROW]
[ROW][C]5[/C][C]0.019311[/C][C]0.1627[/C][C]0.435602[/C][/ROW]
[ROW][C]6[/C][C]-0.097527[/C][C]-0.8218[/C][C]0.206978[/C][/ROW]
[ROW][C]7[/C][C]-0.05441[/C][C]-0.4585[/C][C]0.32401[/C][/ROW]
[ROW][C]8[/C][C]-0.089597[/C][C]-0.755[/C][C]0.226386[/C][/ROW]
[ROW][C]9[/C][C]-0.151502[/C][C]-1.2766[/C][C]0.102955[/C][/ROW]
[ROW][C]10[/C][C]-0.049244[/C][C]-0.4149[/C][C]0.339718[/C][/ROW]
[ROW][C]11[/C][C]0.030949[/C][C]0.2608[/C][C]0.397509[/C][/ROW]
[ROW][C]12[/C][C]0.108476[/C][C]0.914[/C][C]0.181897[/C][/ROW]
[ROW][C]13[/C][C]-0.015974[/C][C]-0.1346[/C][C]0.446654[/C][/ROW]
[ROW][C]14[/C][C]0.035742[/C][C]0.3012[/C][C]0.382082[/C][/ROW]
[ROW][C]15[/C][C]-0.093219[/C][C]-0.7855[/C][C]0.217395[/C][/ROW]
[ROW][C]16[/C][C]-0.10465[/C][C]-0.8818[/C][C]0.190432[/C][/ROW]
[ROW][C]17[/C][C]0.00733[/C][C]0.0618[/C][C]0.475463[/C][/ROW]
[ROW][C]18[/C][C]-0.039821[/C][C]-0.3355[/C][C]0.369106[/C][/ROW]
[ROW][C]19[/C][C]0.009499[/C][C]0.08[/C][C]0.468214[/C][/ROW]
[ROW][C]20[/C][C]0.049825[/C][C]0.4198[/C][C]0.337936[/C][/ROW]
[ROW][C]21[/C][C]-0.08261[/C][C]-0.6961[/C][C]0.244323[/C][/ROW]
[ROW][C]22[/C][C]-0.09227[/C][C]-0.7775[/C][C]0.219729[/C][/ROW]
[ROW][C]23[/C][C]0.005591[/C][C]0.0471[/C][C]0.481278[/C][/ROW]
[ROW][C]24[/C][C]-0.033203[/C][C]-0.2798[/C][C]0.390232[/C][/ROW]
[ROW][C]25[/C][C]-0.017146[/C][C]-0.1445[/C][C]0.442767[/C][/ROW]
[ROW][C]26[/C][C]-0.043934[/C][C]-0.3702[/C][C]0.356171[/C][/ROW]
[ROW][C]27[/C][C]-0.133866[/C][C]-1.128[/C][C]0.131564[/C][/ROW]
[ROW][C]28[/C][C]-0.064578[/C][C]-0.5441[/C][C]0.294024[/C][/ROW]
[ROW][C]29[/C][C]-0.032338[/C][C]-0.2725[/C][C]0.393021[/C][/ROW]
[ROW][C]30[/C][C]-0.051453[/C][C]-0.4335[/C][C]0.332965[/C][/ROW]
[ROW][C]31[/C][C]0.016809[/C][C]0.1416[/C][C]0.443884[/C][/ROW]
[ROW][C]32[/C][C]-0.018082[/C][C]-0.1524[/C][C]0.439668[/C][/ROW]
[ROW][C]33[/C][C]-0.117261[/C][C]-0.9881[/C][C]0.163239[/C][/ROW]
[ROW][C]34[/C][C]0.003815[/C][C]0.0321[/C][C]0.487223[/C][/ROW]
[ROW][C]35[/C][C]-0.004024[/C][C]-0.0339[/C][C]0.486522[/C][/ROW]
[ROW][C]36[/C][C]-0.040084[/C][C]-0.3378[/C][C]0.368273[/C][/ROW]
[ROW][C]37[/C][C]-0.032073[/C][C]-0.2703[/C][C]0.393874[/C][/ROW]
[ROW][C]38[/C][C]0.006016[/C][C]0.0507[/C][C]0.479857[/C][/ROW]
[ROW][C]39[/C][C]-0.011888[/C][C]-0.1002[/C][C]0.460245[/C][/ROW]
[ROW][C]40[/C][C]0.008207[/C][C]0.0692[/C][C]0.47253[/C][/ROW]
[ROW][C]41[/C][C]0.003378[/C][C]0.0285[/C][C]0.488685[/C][/ROW]
[ROW][C]42[/C][C]-0.069552[/C][C]-0.5861[/C][C]0.279848[/C][/ROW]
[ROW][C]43[/C][C]-0.070946[/C][C]-0.5978[/C][C]0.275938[/C][/ROW]
[ROW][C]44[/C][C]-0.015779[/C][C]-0.133[/C][C]0.447302[/C][/ROW]
[ROW][C]45[/C][C]-0.013336[/C][C]-0.1124[/C][C]0.455424[/C][/ROW]
[ROW][C]46[/C][C]-0.021953[/C][C]-0.185[/C][C]0.426886[/C][/ROW]
[ROW][C]47[/C][C]0.002626[/C][C]0.0221[/C][C]0.491205[/C][/ROW]
[ROW][C]48[/C][C]-0.041226[/C][C]-0.3474[/C][C]0.364669[/C][/ROW]
[/TABLE]
Source: https://freestatistics.org/blog/index.php?pk=&T=2

Globally Unique Identifier (entire table): ba.freestatistics.org/blog/index.php?pk=&T=2

As an alternative you can also use a QR Code:  

The GUIDs for individual cells are displayed in the table below:

Partial Autocorrelation Function
Time lag kPACF(k)T-STATP-value
10.0604680.50950.305988
2-0.040621-0.34230.366575
3-0.067355-0.56750.286067
4-0.085595-0.72120.236565
50.0193110.16270.435602
6-0.097527-0.82180.206978
7-0.05441-0.45850.32401
8-0.089597-0.7550.226386
9-0.151502-1.27660.102955
10-0.049244-0.41490.339718
110.0309490.26080.397509
120.1084760.9140.181897
13-0.015974-0.13460.446654
140.0357420.30120.382082
15-0.093219-0.78550.217395
16-0.10465-0.88180.190432
170.007330.06180.475463
18-0.039821-0.33550.369106
190.0094990.080.468214
200.0498250.41980.337936
21-0.08261-0.69610.244323
22-0.09227-0.77750.219729
230.0055910.04710.481278
24-0.033203-0.27980.390232
25-0.017146-0.14450.442767
26-0.043934-0.37020.356171
27-0.133866-1.1280.131564
28-0.064578-0.54410.294024
29-0.032338-0.27250.393021
30-0.051453-0.43350.332965
310.0168090.14160.443884
32-0.018082-0.15240.439668
33-0.117261-0.98810.163239
340.0038150.03210.487223
35-0.004024-0.03390.486522
36-0.040084-0.33780.368273
37-0.032073-0.27030.393874
380.0060160.05070.479857
39-0.011888-0.10020.460245
400.0082070.06920.47253
410.0033780.02850.488685
42-0.069552-0.58610.279848
43-0.070946-0.59780.275938
44-0.015779-0.1330.447302
45-0.013336-0.11240.455424
46-0.021953-0.1850.426886
470.0026260.02210.491205
48-0.041226-0.34740.364669


Parameters (Session):
par1 = 48 ; par2 = 1 ; par3 = 1 ; par4 = 0 ; par5 = 12 ; par6 = White Noise ; par7 = 0.95 ;
Parameters (R input):
par1 = 48 ; par2 = 1 ; par3 = 1 ; par4 = 0 ; par5 = 12 ; par6 = White Noise ; par7 = 0.95 ; par8 = ;
R code (references can be found in the software module):
if (par1 == 'Default') {
par1 = 10*log10(length(x))
} else {
par1 <- as.numeric(par1)
}
par2 <- as.numeric(par2)
par3 <- as.numeric(par3)
par4 <- as.numeric(par4)
par5 <- as.numeric(par5)
if (par6 == 'White Noise') par6 <- 'white' else par6 <- 'ma'
par7 <- as.numeric(par7)
if (par8 != '') par8 <- as.numeric(par8)
x <- na.omit(x)
ox <- x
if (par8 == '') {
if (par2 == 0) {
x <- log(x)
} else {
x <- (x ^ par2 - 1) / par2
}
} else {
x <- log(x,base=par8)
}
if (par3 > 0) x <- diff(x,lag=1,difference=par3)
if (par4 > 0) x <- diff(x,lag=par5,difference=par4)
bitmap(file='picts.png')
op <- par(mfrow=c(2,1))
plot(ox,type='l',main='Original Time Series',xlab='time',ylab='value')
if (par8=='') {
mytitle <- paste('Working Time Series (lambda=',par2,', d=',par3,', D=',par4,')',sep='')
mysub <- paste('(lambda=',par2,', d=',par3,', D=',par4,', CI=', par7, ', CI type=',par6,')',sep='')
} else {
mytitle <- paste('Working Time Series (base=',par8,', d=',par3,', D=',par4,')',sep='')
mysub <- paste('(base=',par8,', d=',par3,', D=',par4,', CI=', par7, ', CI type=',par6,')',sep='')
}
plot(x,type='l', main=mytitle,xlab='time',ylab='value')
par(op)
dev.off()
bitmap(file='pic1.png')
racf <- acf(x, par1, main='Autocorrelation', xlab='time lag', ylab='ACF', ci.type=par6, ci=par7, sub=mysub)
dev.off()
bitmap(file='pic2.png')
rpacf <- pacf(x,par1,main='Partial Autocorrelation',xlab='lags',ylab='PACF',sub=mysub)
dev.off()
(myacf <- c(racf$acf))
(mypacf <- c(rpacf$acf))
lengthx <- length(x)
sqrtn <- sqrt(lengthx)
load(file='createtable')
a<-table.start()
a<-table.row.start(a)
a<-table.element(a,'Autocorrelation Function',4,TRUE)
a<-table.row.end(a)
a<-table.row.start(a)
a<-table.element(a,'Time lag k',header=TRUE)
a<-table.element(a,hyperlink('basics.htm','ACF(k)','click here for more information about the Autocorrelation Function'),header=TRUE)
a<-table.element(a,'T-STAT',header=TRUE)
a<-table.element(a,'P-value',header=TRUE)
a<-table.row.end(a)
for (i in 2:(par1+1)) {
a<-table.row.start(a)
a<-table.element(a,i-1,header=TRUE)
a<-table.element(a,round(myacf[i],6))
mytstat <- myacf[i]*sqrtn
a<-table.element(a,round(mytstat,4))
a<-table.element(a,round(1-pt(abs(mytstat),lengthx),6))
a<-table.row.end(a)
}
a<-table.end(a)
table.save(a,file='mytable.tab')
a<-table.start()
a<-table.row.start(a)
a<-table.element(a,'Partial Autocorrelation Function',4,TRUE)
a<-table.row.end(a)
a<-table.row.start(a)
a<-table.element(a,'Time lag k',header=TRUE)
a<-table.element(a,hyperlink('basics.htm','PACF(k)','click here for more information about the Partial Autocorrelation Function'),header=TRUE)
a<-table.element(a,'T-STAT',header=TRUE)
a<-table.element(a,'P-value',header=TRUE)
a<-table.row.end(a)
for (i in 1:par1) {
a<-table.row.start(a)
a<-table.element(a,i,header=TRUE)
a<-table.element(a,round(mypacf[i],6))
mytstat <- mypacf[i]*sqrtn
a<-table.element(a,round(mytstat,4))
a<-table.element(a,round(1-pt(abs(mytstat),lengthx),6))
a<-table.row.end(a)
}
a<-table.end(a)
table.save(a,file='mytable1.tab')