Free Statistics

of Irreproducible Research!

Author's title

Author*Unverified author*
R Software Modulerwasp_autocorrelation.wasp
Title produced by software(Partial) Autocorrelation Function
Date of computationThu, 20 Oct 2016 15:43:53 +0100
Cite this page as followsStatistical Computations at FreeStatistics.org, Office for Research Development and Education, URL https://freestatistics.org/blog/index.php?v=date/2016/Oct/20/t1476974668fbvww7krw3xdary.htm/, Retrieved Sun, 05 May 2024 10:25:25 +0200
Statistical Computations at FreeStatistics.org, Office for Research Development and Education, URL https://freestatistics.org/blog/index.php?pk=, Retrieved Sun, 05 May 2024 10:25:25 +0200
QR Codes:

Original text written by user:
IsPrivate?No (this computation is public)
User-defined keywords
Estimated Impact0
Dataseries X:
99,6
96,1
109
99,5
104,6
99,9
94,1
105,3
110,4
110,5
110
108,5
101,5
99
106,2
97,6
103,7
103,4
99,9
105
103,4
117,8
110,6
102
105,1
98,5
104,4
103,9
105,8
100,3
106,3
101,4
104,3
114,6
105
103,4
102,9
96,4
102,6
104,7
100,8
102,1
101,1
98,1
109,2
114,4
104
107,2
101,3
98,1
109,6
105,9
99,5
109,9
105,3
102,5
111,9
118
112,1
113,8


Summary of computational transaction
Raw Inputview raw input (R code)
Raw Outputview raw output of R engine
Computing time2 seconds
R Server'Sir Ronald Aylmer Fisher' @ fisher.wessa.net

\begin{tabular}{lllllllll}
\hline
Summary of computational transaction \tabularnewline
Raw Input & view raw input (R code)  \tabularnewline
Raw Output & view raw output of R engine  \tabularnewline
Computing time & 2 seconds \tabularnewline
R Server & 'Sir Ronald Aylmer Fisher' @ fisher.wessa.net \tabularnewline
\hline
\end{tabular}
%Source: https://freestatistics.org/blog/index.php?pk=&T=0

[TABLE]
[ROW][C]Summary of computational transaction[/C][/ROW]
[ROW][C]Raw Input[/C][C]view raw input (R code) [/C][/ROW]
[ROW][C]Raw Output[/C][C]view raw output of R engine [/C][/ROW]
[ROW][C]Computing time[/C][C]2 seconds[/C][/ROW]
[ROW][C]R Server[/C][C]'Sir Ronald Aylmer Fisher' @ fisher.wessa.net[/C][/ROW]
[/TABLE]
Source: https://freestatistics.org/blog/index.php?pk=&T=0

Globally Unique Identifier (entire table): ba.freestatistics.org/blog/index.php?pk=&T=0

As an alternative you can also use a QR Code:  

The GUIDs for individual cells are displayed in the table below:

Summary of computational transaction
Raw Inputview raw input (R code)
Raw Outputview raw output of R engine
Computing time2 seconds
R Server'Sir Ronald Aylmer Fisher' @ fisher.wessa.net


Autocorrelation Function
Time lag kACF(k)T-STATP-value
10.2538021.96590.026969
20.0507760.39330.347743
30.0574340.44490.329003
4-0.283247-2.1940.016059
5-0.025807-0.19990.421117
60.1227930.95120.172672
7-0.119499-0.92560.179171
8-0.209631-1.62380.054831
9-0.045342-0.35120.363327
10-0.123025-0.95290.17222
110.1829261.41690.080836
120.4996373.87020.000135
130.0905060.70110.242989
140.0904230.70040.243189
15-0.179954-1.39390.084242
16-0.315974-2.44750.008664
170.0020390.01580.493725
18-0.084109-0.65150.258604
19-0.069461-0.5380.29627
20-0.134332-1.04050.151134
21-0.221509-1.71580.045679
22-0.0698-0.54070.29537
230.1907971.47790.072331
240.2537191.96530.027007
250.1325191.02650.154391
260.0690980.53520.297234
27-0.188598-1.46090.074634
28-0.099186-0.76830.222665
29-0.011004-0.08520.466178
30-0.072867-0.56440.287284
310.0420370.32560.372924
32-0.118085-0.91470.182011
33-0.104138-0.80660.211528
340.0358420.27760.391125
350.1102610.85410.19823
360.2571131.99160.025487
370.2344811.81630.037162
38-0.012443-0.09640.461769
39-0.09286-0.71930.237377
40-0.034415-0.26660.395353
41-0.117347-0.9090.183502
42-0.000577-0.00450.498225
430.0357350.27680.391441
44-0.177516-1.3750.087117
45-0.045176-0.34990.363809
460.0342250.26510.395918
470.0186790.14470.442721
480.1479041.14570.128242

\begin{tabular}{lllllllll}
\hline
Autocorrelation Function \tabularnewline
Time lag k & ACF(k) & T-STAT & P-value \tabularnewline
1 & 0.253802 & 1.9659 & 0.026969 \tabularnewline
2 & 0.050776 & 0.3933 & 0.347743 \tabularnewline
3 & 0.057434 & 0.4449 & 0.329003 \tabularnewline
4 & -0.283247 & -2.194 & 0.016059 \tabularnewline
5 & -0.025807 & -0.1999 & 0.421117 \tabularnewline
6 & 0.122793 & 0.9512 & 0.172672 \tabularnewline
7 & -0.119499 & -0.9256 & 0.179171 \tabularnewline
8 & -0.209631 & -1.6238 & 0.054831 \tabularnewline
9 & -0.045342 & -0.3512 & 0.363327 \tabularnewline
10 & -0.123025 & -0.9529 & 0.17222 \tabularnewline
11 & 0.182926 & 1.4169 & 0.080836 \tabularnewline
12 & 0.499637 & 3.8702 & 0.000135 \tabularnewline
13 & 0.090506 & 0.7011 & 0.242989 \tabularnewline
14 & 0.090423 & 0.7004 & 0.243189 \tabularnewline
15 & -0.179954 & -1.3939 & 0.084242 \tabularnewline
16 & -0.315974 & -2.4475 & 0.008664 \tabularnewline
17 & 0.002039 & 0.0158 & 0.493725 \tabularnewline
18 & -0.084109 & -0.6515 & 0.258604 \tabularnewline
19 & -0.069461 & -0.538 & 0.29627 \tabularnewline
20 & -0.134332 & -1.0405 & 0.151134 \tabularnewline
21 & -0.221509 & -1.7158 & 0.045679 \tabularnewline
22 & -0.0698 & -0.5407 & 0.29537 \tabularnewline
23 & 0.190797 & 1.4779 & 0.072331 \tabularnewline
24 & 0.253719 & 1.9653 & 0.027007 \tabularnewline
25 & 0.132519 & 1.0265 & 0.154391 \tabularnewline
26 & 0.069098 & 0.5352 & 0.297234 \tabularnewline
27 & -0.188598 & -1.4609 & 0.074634 \tabularnewline
28 & -0.099186 & -0.7683 & 0.222665 \tabularnewline
29 & -0.011004 & -0.0852 & 0.466178 \tabularnewline
30 & -0.072867 & -0.5644 & 0.287284 \tabularnewline
31 & 0.042037 & 0.3256 & 0.372924 \tabularnewline
32 & -0.118085 & -0.9147 & 0.182011 \tabularnewline
33 & -0.104138 & -0.8066 & 0.211528 \tabularnewline
34 & 0.035842 & 0.2776 & 0.391125 \tabularnewline
35 & 0.110261 & 0.8541 & 0.19823 \tabularnewline
36 & 0.257113 & 1.9916 & 0.025487 \tabularnewline
37 & 0.234481 & 1.8163 & 0.037162 \tabularnewline
38 & -0.012443 & -0.0964 & 0.461769 \tabularnewline
39 & -0.09286 & -0.7193 & 0.237377 \tabularnewline
40 & -0.034415 & -0.2666 & 0.395353 \tabularnewline
41 & -0.117347 & -0.909 & 0.183502 \tabularnewline
42 & -0.000577 & -0.0045 & 0.498225 \tabularnewline
43 & 0.035735 & 0.2768 & 0.391441 \tabularnewline
44 & -0.177516 & -1.375 & 0.087117 \tabularnewline
45 & -0.045176 & -0.3499 & 0.363809 \tabularnewline
46 & 0.034225 & 0.2651 & 0.395918 \tabularnewline
47 & 0.018679 & 0.1447 & 0.442721 \tabularnewline
48 & 0.147904 & 1.1457 & 0.128242 \tabularnewline
\hline
\end{tabular}
%Source: https://freestatistics.org/blog/index.php?pk=&T=1

[TABLE]
[ROW][C]Autocorrelation Function[/C][/ROW]
[ROW][C]Time lag k[/C][C]ACF(k)[/C][C]T-STAT[/C][C]P-value[/C][/ROW]
[ROW][C]1[/C][C]0.253802[/C][C]1.9659[/C][C]0.026969[/C][/ROW]
[ROW][C]2[/C][C]0.050776[/C][C]0.3933[/C][C]0.347743[/C][/ROW]
[ROW][C]3[/C][C]0.057434[/C][C]0.4449[/C][C]0.329003[/C][/ROW]
[ROW][C]4[/C][C]-0.283247[/C][C]-2.194[/C][C]0.016059[/C][/ROW]
[ROW][C]5[/C][C]-0.025807[/C][C]-0.1999[/C][C]0.421117[/C][/ROW]
[ROW][C]6[/C][C]0.122793[/C][C]0.9512[/C][C]0.172672[/C][/ROW]
[ROW][C]7[/C][C]-0.119499[/C][C]-0.9256[/C][C]0.179171[/C][/ROW]
[ROW][C]8[/C][C]-0.209631[/C][C]-1.6238[/C][C]0.054831[/C][/ROW]
[ROW][C]9[/C][C]-0.045342[/C][C]-0.3512[/C][C]0.363327[/C][/ROW]
[ROW][C]10[/C][C]-0.123025[/C][C]-0.9529[/C][C]0.17222[/C][/ROW]
[ROW][C]11[/C][C]0.182926[/C][C]1.4169[/C][C]0.080836[/C][/ROW]
[ROW][C]12[/C][C]0.499637[/C][C]3.8702[/C][C]0.000135[/C][/ROW]
[ROW][C]13[/C][C]0.090506[/C][C]0.7011[/C][C]0.242989[/C][/ROW]
[ROW][C]14[/C][C]0.090423[/C][C]0.7004[/C][C]0.243189[/C][/ROW]
[ROW][C]15[/C][C]-0.179954[/C][C]-1.3939[/C][C]0.084242[/C][/ROW]
[ROW][C]16[/C][C]-0.315974[/C][C]-2.4475[/C][C]0.008664[/C][/ROW]
[ROW][C]17[/C][C]0.002039[/C][C]0.0158[/C][C]0.493725[/C][/ROW]
[ROW][C]18[/C][C]-0.084109[/C][C]-0.6515[/C][C]0.258604[/C][/ROW]
[ROW][C]19[/C][C]-0.069461[/C][C]-0.538[/C][C]0.29627[/C][/ROW]
[ROW][C]20[/C][C]-0.134332[/C][C]-1.0405[/C][C]0.151134[/C][/ROW]
[ROW][C]21[/C][C]-0.221509[/C][C]-1.7158[/C][C]0.045679[/C][/ROW]
[ROW][C]22[/C][C]-0.0698[/C][C]-0.5407[/C][C]0.29537[/C][/ROW]
[ROW][C]23[/C][C]0.190797[/C][C]1.4779[/C][C]0.072331[/C][/ROW]
[ROW][C]24[/C][C]0.253719[/C][C]1.9653[/C][C]0.027007[/C][/ROW]
[ROW][C]25[/C][C]0.132519[/C][C]1.0265[/C][C]0.154391[/C][/ROW]
[ROW][C]26[/C][C]0.069098[/C][C]0.5352[/C][C]0.297234[/C][/ROW]
[ROW][C]27[/C][C]-0.188598[/C][C]-1.4609[/C][C]0.074634[/C][/ROW]
[ROW][C]28[/C][C]-0.099186[/C][C]-0.7683[/C][C]0.222665[/C][/ROW]
[ROW][C]29[/C][C]-0.011004[/C][C]-0.0852[/C][C]0.466178[/C][/ROW]
[ROW][C]30[/C][C]-0.072867[/C][C]-0.5644[/C][C]0.287284[/C][/ROW]
[ROW][C]31[/C][C]0.042037[/C][C]0.3256[/C][C]0.372924[/C][/ROW]
[ROW][C]32[/C][C]-0.118085[/C][C]-0.9147[/C][C]0.182011[/C][/ROW]
[ROW][C]33[/C][C]-0.104138[/C][C]-0.8066[/C][C]0.211528[/C][/ROW]
[ROW][C]34[/C][C]0.035842[/C][C]0.2776[/C][C]0.391125[/C][/ROW]
[ROW][C]35[/C][C]0.110261[/C][C]0.8541[/C][C]0.19823[/C][/ROW]
[ROW][C]36[/C][C]0.257113[/C][C]1.9916[/C][C]0.025487[/C][/ROW]
[ROW][C]37[/C][C]0.234481[/C][C]1.8163[/C][C]0.037162[/C][/ROW]
[ROW][C]38[/C][C]-0.012443[/C][C]-0.0964[/C][C]0.461769[/C][/ROW]
[ROW][C]39[/C][C]-0.09286[/C][C]-0.7193[/C][C]0.237377[/C][/ROW]
[ROW][C]40[/C][C]-0.034415[/C][C]-0.2666[/C][C]0.395353[/C][/ROW]
[ROW][C]41[/C][C]-0.117347[/C][C]-0.909[/C][C]0.183502[/C][/ROW]
[ROW][C]42[/C][C]-0.000577[/C][C]-0.0045[/C][C]0.498225[/C][/ROW]
[ROW][C]43[/C][C]0.035735[/C][C]0.2768[/C][C]0.391441[/C][/ROW]
[ROW][C]44[/C][C]-0.177516[/C][C]-1.375[/C][C]0.087117[/C][/ROW]
[ROW][C]45[/C][C]-0.045176[/C][C]-0.3499[/C][C]0.363809[/C][/ROW]
[ROW][C]46[/C][C]0.034225[/C][C]0.2651[/C][C]0.395918[/C][/ROW]
[ROW][C]47[/C][C]0.018679[/C][C]0.1447[/C][C]0.442721[/C][/ROW]
[ROW][C]48[/C][C]0.147904[/C][C]1.1457[/C][C]0.128242[/C][/ROW]
[/TABLE]
Source: https://freestatistics.org/blog/index.php?pk=&T=1

Globally Unique Identifier (entire table): ba.freestatistics.org/blog/index.php?pk=&T=1

As an alternative you can also use a QR Code:  

The GUIDs for individual cells are displayed in the table below:

Autocorrelation Function
Time lag kACF(k)T-STATP-value
10.2538021.96590.026969
20.0507760.39330.347743
30.0574340.44490.329003
4-0.283247-2.1940.016059
5-0.025807-0.19990.421117
60.1227930.95120.172672
7-0.119499-0.92560.179171
8-0.209631-1.62380.054831
9-0.045342-0.35120.363327
10-0.123025-0.95290.17222
110.1829261.41690.080836
120.4996373.87020.000135
130.0905060.70110.242989
140.0904230.70040.243189
15-0.179954-1.39390.084242
16-0.315974-2.44750.008664
170.0020390.01580.493725
18-0.084109-0.65150.258604
19-0.069461-0.5380.29627
20-0.134332-1.04050.151134
21-0.221509-1.71580.045679
22-0.0698-0.54070.29537
230.1907971.47790.072331
240.2537191.96530.027007
250.1325191.02650.154391
260.0690980.53520.297234
27-0.188598-1.46090.074634
28-0.099186-0.76830.222665
29-0.011004-0.08520.466178
30-0.072867-0.56440.287284
310.0420370.32560.372924
32-0.118085-0.91470.182011
33-0.104138-0.80660.211528
340.0358420.27760.391125
350.1102610.85410.19823
360.2571131.99160.025487
370.2344811.81630.037162
38-0.012443-0.09640.461769
39-0.09286-0.71930.237377
40-0.034415-0.26660.395353
41-0.117347-0.9090.183502
42-0.000577-0.00450.498225
430.0357350.27680.391441
44-0.177516-1.3750.087117
45-0.045176-0.34990.363809
460.0342250.26510.395918
470.0186790.14470.442721
480.1479041.14570.128242


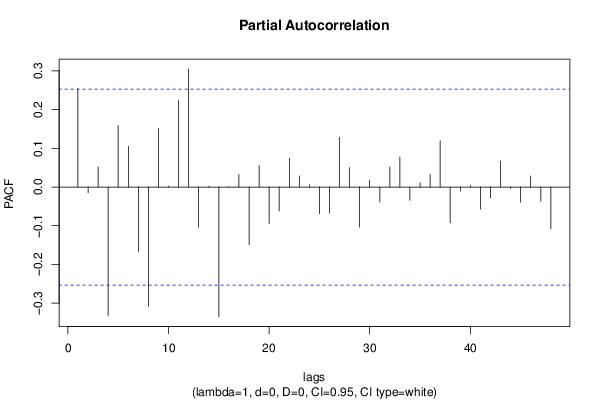
Partial Autocorrelation Function
Time lag kPACF(k)T-STATP-value
10.2538021.96590.026969
2-0.014579-0.11290.455233
30.0513790.3980.346028
4-0.331978-2.57150.006311
50.1585291.2280.112129
60.1053250.81580.208909
7-0.16718-1.2950.100145
8-0.308385-2.38870.010034
90.1517931.17580.122164
100.0021310.01650.493443
110.2242411.7370.043763
120.3048962.36170.010727
13-0.103646-0.80280.212618
140.0018570.01440.494286
15-0.334761-2.5930.005967
160.0008340.00650.497434
170.0321760.24920.402014
18-0.148854-1.1530.126738
190.0552420.42790.335127
20-0.094092-0.72880.234469
21-0.061917-0.47960.316624
220.0742210.57490.28375
230.028690.22220.412445
240.0057250.04430.482388
25-0.069135-0.53550.297135
26-0.067333-0.52160.301948
270.128230.99330.162286
280.0497080.3850.350786
29-0.103495-0.80170.212954
300.018210.14110.444151
31-0.038663-0.29950.382804
320.0516640.40020.34522
330.0771540.59760.276168
34-0.033993-0.26330.396608
350.0108180.08380.466747
360.032160.24910.402062
370.1192930.9240.179584
38-0.092395-0.71570.238481
39-0.010187-0.07890.468685
400.0040370.03130.487577
41-0.057135-0.44260.329835
42-0.027366-0.2120.416421
430.0673480.52170.301908
44-0.003696-0.02860.488626
45-0.03919-0.30360.381255
460.0286160.22170.412667
47-0.036889-0.28570.38803
48-0.107861-0.83550.203378

\begin{tabular}{lllllllll}
\hline
Partial Autocorrelation Function \tabularnewline
Time lag k & PACF(k) & T-STAT & P-value \tabularnewline
1 & 0.253802 & 1.9659 & 0.026969 \tabularnewline
2 & -0.014579 & -0.1129 & 0.455233 \tabularnewline
3 & 0.051379 & 0.398 & 0.346028 \tabularnewline
4 & -0.331978 & -2.5715 & 0.006311 \tabularnewline
5 & 0.158529 & 1.228 & 0.112129 \tabularnewline
6 & 0.105325 & 0.8158 & 0.208909 \tabularnewline
7 & -0.16718 & -1.295 & 0.100145 \tabularnewline
8 & -0.308385 & -2.3887 & 0.010034 \tabularnewline
9 & 0.151793 & 1.1758 & 0.122164 \tabularnewline
10 & 0.002131 & 0.0165 & 0.493443 \tabularnewline
11 & 0.224241 & 1.737 & 0.043763 \tabularnewline
12 & 0.304896 & 2.3617 & 0.010727 \tabularnewline
13 & -0.103646 & -0.8028 & 0.212618 \tabularnewline
14 & 0.001857 & 0.0144 & 0.494286 \tabularnewline
15 & -0.334761 & -2.593 & 0.005967 \tabularnewline
16 & 0.000834 & 0.0065 & 0.497434 \tabularnewline
17 & 0.032176 & 0.2492 & 0.402014 \tabularnewline
18 & -0.148854 & -1.153 & 0.126738 \tabularnewline
19 & 0.055242 & 0.4279 & 0.335127 \tabularnewline
20 & -0.094092 & -0.7288 & 0.234469 \tabularnewline
21 & -0.061917 & -0.4796 & 0.316624 \tabularnewline
22 & 0.074221 & 0.5749 & 0.28375 \tabularnewline
23 & 0.02869 & 0.2222 & 0.412445 \tabularnewline
24 & 0.005725 & 0.0443 & 0.482388 \tabularnewline
25 & -0.069135 & -0.5355 & 0.297135 \tabularnewline
26 & -0.067333 & -0.5216 & 0.301948 \tabularnewline
27 & 0.12823 & 0.9933 & 0.162286 \tabularnewline
28 & 0.049708 & 0.385 & 0.350786 \tabularnewline
29 & -0.103495 & -0.8017 & 0.212954 \tabularnewline
30 & 0.01821 & 0.1411 & 0.444151 \tabularnewline
31 & -0.038663 & -0.2995 & 0.382804 \tabularnewline
32 & 0.051664 & 0.4002 & 0.34522 \tabularnewline
33 & 0.077154 & 0.5976 & 0.276168 \tabularnewline
34 & -0.033993 & -0.2633 & 0.396608 \tabularnewline
35 & 0.010818 & 0.0838 & 0.466747 \tabularnewline
36 & 0.03216 & 0.2491 & 0.402062 \tabularnewline
37 & 0.119293 & 0.924 & 0.179584 \tabularnewline
38 & -0.092395 & -0.7157 & 0.238481 \tabularnewline
39 & -0.010187 & -0.0789 & 0.468685 \tabularnewline
40 & 0.004037 & 0.0313 & 0.487577 \tabularnewline
41 & -0.057135 & -0.4426 & 0.329835 \tabularnewline
42 & -0.027366 & -0.212 & 0.416421 \tabularnewline
43 & 0.067348 & 0.5217 & 0.301908 \tabularnewline
44 & -0.003696 & -0.0286 & 0.488626 \tabularnewline
45 & -0.03919 & -0.3036 & 0.381255 \tabularnewline
46 & 0.028616 & 0.2217 & 0.412667 \tabularnewline
47 & -0.036889 & -0.2857 & 0.38803 \tabularnewline
48 & -0.107861 & -0.8355 & 0.203378 \tabularnewline
\hline
\end{tabular}
%Source: https://freestatistics.org/blog/index.php?pk=&T=2

[TABLE]
[ROW][C]Partial Autocorrelation Function[/C][/ROW]
[ROW][C]Time lag k[/C][C]PACF(k)[/C][C]T-STAT[/C][C]P-value[/C][/ROW]
[ROW][C]1[/C][C]0.253802[/C][C]1.9659[/C][C]0.026969[/C][/ROW]
[ROW][C]2[/C][C]-0.014579[/C][C]-0.1129[/C][C]0.455233[/C][/ROW]
[ROW][C]3[/C][C]0.051379[/C][C]0.398[/C][C]0.346028[/C][/ROW]
[ROW][C]4[/C][C]-0.331978[/C][C]-2.5715[/C][C]0.006311[/C][/ROW]
[ROW][C]5[/C][C]0.158529[/C][C]1.228[/C][C]0.112129[/C][/ROW]
[ROW][C]6[/C][C]0.105325[/C][C]0.8158[/C][C]0.208909[/C][/ROW]
[ROW][C]7[/C][C]-0.16718[/C][C]-1.295[/C][C]0.100145[/C][/ROW]
[ROW][C]8[/C][C]-0.308385[/C][C]-2.3887[/C][C]0.010034[/C][/ROW]
[ROW][C]9[/C][C]0.151793[/C][C]1.1758[/C][C]0.122164[/C][/ROW]
[ROW][C]10[/C][C]0.002131[/C][C]0.0165[/C][C]0.493443[/C][/ROW]
[ROW][C]11[/C][C]0.224241[/C][C]1.737[/C][C]0.043763[/C][/ROW]
[ROW][C]12[/C][C]0.304896[/C][C]2.3617[/C][C]0.010727[/C][/ROW]
[ROW][C]13[/C][C]-0.103646[/C][C]-0.8028[/C][C]0.212618[/C][/ROW]
[ROW][C]14[/C][C]0.001857[/C][C]0.0144[/C][C]0.494286[/C][/ROW]
[ROW][C]15[/C][C]-0.334761[/C][C]-2.593[/C][C]0.005967[/C][/ROW]
[ROW][C]16[/C][C]0.000834[/C][C]0.0065[/C][C]0.497434[/C][/ROW]
[ROW][C]17[/C][C]0.032176[/C][C]0.2492[/C][C]0.402014[/C][/ROW]
[ROW][C]18[/C][C]-0.148854[/C][C]-1.153[/C][C]0.126738[/C][/ROW]
[ROW][C]19[/C][C]0.055242[/C][C]0.4279[/C][C]0.335127[/C][/ROW]
[ROW][C]20[/C][C]-0.094092[/C][C]-0.7288[/C][C]0.234469[/C][/ROW]
[ROW][C]21[/C][C]-0.061917[/C][C]-0.4796[/C][C]0.316624[/C][/ROW]
[ROW][C]22[/C][C]0.074221[/C][C]0.5749[/C][C]0.28375[/C][/ROW]
[ROW][C]23[/C][C]0.02869[/C][C]0.2222[/C][C]0.412445[/C][/ROW]
[ROW][C]24[/C][C]0.005725[/C][C]0.0443[/C][C]0.482388[/C][/ROW]
[ROW][C]25[/C][C]-0.069135[/C][C]-0.5355[/C][C]0.297135[/C][/ROW]
[ROW][C]26[/C][C]-0.067333[/C][C]-0.5216[/C][C]0.301948[/C][/ROW]
[ROW][C]27[/C][C]0.12823[/C][C]0.9933[/C][C]0.162286[/C][/ROW]
[ROW][C]28[/C][C]0.049708[/C][C]0.385[/C][C]0.350786[/C][/ROW]
[ROW][C]29[/C][C]-0.103495[/C][C]-0.8017[/C][C]0.212954[/C][/ROW]
[ROW][C]30[/C][C]0.01821[/C][C]0.1411[/C][C]0.444151[/C][/ROW]
[ROW][C]31[/C][C]-0.038663[/C][C]-0.2995[/C][C]0.382804[/C][/ROW]
[ROW][C]32[/C][C]0.051664[/C][C]0.4002[/C][C]0.34522[/C][/ROW]
[ROW][C]33[/C][C]0.077154[/C][C]0.5976[/C][C]0.276168[/C][/ROW]
[ROW][C]34[/C][C]-0.033993[/C][C]-0.2633[/C][C]0.396608[/C][/ROW]
[ROW][C]35[/C][C]0.010818[/C][C]0.0838[/C][C]0.466747[/C][/ROW]
[ROW][C]36[/C][C]0.03216[/C][C]0.2491[/C][C]0.402062[/C][/ROW]
[ROW][C]37[/C][C]0.119293[/C][C]0.924[/C][C]0.179584[/C][/ROW]
[ROW][C]38[/C][C]-0.092395[/C][C]-0.7157[/C][C]0.238481[/C][/ROW]
[ROW][C]39[/C][C]-0.010187[/C][C]-0.0789[/C][C]0.468685[/C][/ROW]
[ROW][C]40[/C][C]0.004037[/C][C]0.0313[/C][C]0.487577[/C][/ROW]
[ROW][C]41[/C][C]-0.057135[/C][C]-0.4426[/C][C]0.329835[/C][/ROW]
[ROW][C]42[/C][C]-0.027366[/C][C]-0.212[/C][C]0.416421[/C][/ROW]
[ROW][C]43[/C][C]0.067348[/C][C]0.5217[/C][C]0.301908[/C][/ROW]
[ROW][C]44[/C][C]-0.003696[/C][C]-0.0286[/C][C]0.488626[/C][/ROW]
[ROW][C]45[/C][C]-0.03919[/C][C]-0.3036[/C][C]0.381255[/C][/ROW]
[ROW][C]46[/C][C]0.028616[/C][C]0.2217[/C][C]0.412667[/C][/ROW]
[ROW][C]47[/C][C]-0.036889[/C][C]-0.2857[/C][C]0.38803[/C][/ROW]
[ROW][C]48[/C][C]-0.107861[/C][C]-0.8355[/C][C]0.203378[/C][/ROW]
[/TABLE]
Source: https://freestatistics.org/blog/index.php?pk=&T=2

Globally Unique Identifier (entire table): ba.freestatistics.org/blog/index.php?pk=&T=2

As an alternative you can also use a QR Code:  

The GUIDs for individual cells are displayed in the table below:

Partial Autocorrelation Function
Time lag kPACF(k)T-STATP-value
10.2538021.96590.026969
2-0.014579-0.11290.455233
30.0513790.3980.346028
4-0.331978-2.57150.006311
50.1585291.2280.112129
60.1053250.81580.208909
7-0.16718-1.2950.100145
8-0.308385-2.38870.010034
90.1517931.17580.122164
100.0021310.01650.493443
110.2242411.7370.043763
120.3048962.36170.010727
13-0.103646-0.80280.212618
140.0018570.01440.494286
15-0.334761-2.5930.005967
160.0008340.00650.497434
170.0321760.24920.402014
18-0.148854-1.1530.126738
190.0552420.42790.335127
20-0.094092-0.72880.234469
21-0.061917-0.47960.316624
220.0742210.57490.28375
230.028690.22220.412445
240.0057250.04430.482388
25-0.069135-0.53550.297135
26-0.067333-0.52160.301948
270.128230.99330.162286
280.0497080.3850.350786
29-0.103495-0.80170.212954
300.018210.14110.444151
31-0.038663-0.29950.382804
320.0516640.40020.34522
330.0771540.59760.276168
34-0.033993-0.26330.396608
350.0108180.08380.466747
360.032160.24910.402062
370.1192930.9240.179584
38-0.092395-0.71570.238481
39-0.010187-0.07890.468685
400.0040370.03130.487577
41-0.057135-0.44260.329835
42-0.027366-0.2120.416421
430.0673480.52170.301908
44-0.003696-0.02860.488626
45-0.03919-0.30360.381255
460.0286160.22170.412667
47-0.036889-0.28570.38803
48-0.107861-0.83550.203378


Parameters (Session):
par1 = 48 ; par2 = 1 ; par3 = 0 ; par4 = 0 ; par5 = 12 ; par6 = White Noise ; par7 = 0.95 ;
Parameters (R input):
par1 = 48 ; par2 = 1 ; par3 = 0 ; par4 = 0 ; par5 = 12 ; par6 = White Noise ; par7 = 0.95 ; par8 = ;
R code (references can be found in the software module):
if (par1 == 'Default') {
par1 = 10*log10(length(x))
} else {
par1 <- as.numeric(par1)
}
par2 <- as.numeric(par2)
par3 <- as.numeric(par3)
par4 <- as.numeric(par4)
par5 <- as.numeric(par5)
if (par6 == 'White Noise') par6 <- 'white' else par6 <- 'ma'
par7 <- as.numeric(par7)
if (par8 != '') par8 <- as.numeric(par8)
x <- na.omit(x)
ox <- x
if (par8 == '') {
if (par2 == 0) {
x <- log(x)
} else {
x <- (x ^ par2 - 1) / par2
}
} else {
x <- log(x,base=par8)
}
if (par3 > 0) x <- diff(x,lag=1,difference=par3)
if (par4 > 0) x <- diff(x,lag=par5,difference=par4)
bitmap(file='picts.png')
op <- par(mfrow=c(2,1))
plot(ox,type='l',main='Original Time Series',xlab='time',ylab='value')
if (par8=='') {
mytitle <- paste('Working Time Series (lambda=',par2,', d=',par3,', D=',par4,')',sep='')
mysub <- paste('(lambda=',par2,', d=',par3,', D=',par4,', CI=', par7, ', CI type=',par6,')',sep='')
} else {
mytitle <- paste('Working Time Series (base=',par8,', d=',par3,', D=',par4,')',sep='')
mysub <- paste('(base=',par8,', d=',par3,', D=',par4,', CI=', par7, ', CI type=',par6,')',sep='')
}
plot(x,type='l', main=mytitle,xlab='time',ylab='value')
par(op)
dev.off()
bitmap(file='pic1.png')
racf <- acf(x, par1, main='Autocorrelation', xlab='time lag', ylab='ACF', ci.type=par6, ci=par7, sub=mysub)
dev.off()
bitmap(file='pic2.png')
rpacf <- pacf(x,par1,main='Partial Autocorrelation',xlab='lags',ylab='PACF',sub=mysub)
dev.off()
(myacf <- c(racf$acf))
(mypacf <- c(rpacf$acf))
lengthx <- length(x)
sqrtn <- sqrt(lengthx)
load(file='createtable')
a<-table.start()
a<-table.row.start(a)
a<-table.element(a,'Autocorrelation Function',4,TRUE)
a<-table.row.end(a)
a<-table.row.start(a)
a<-table.element(a,'Time lag k',header=TRUE)
a<-table.element(a,hyperlink('basics.htm','ACF(k)','click here for more information about the Autocorrelation Function'),header=TRUE)
a<-table.element(a,'T-STAT',header=TRUE)
a<-table.element(a,'P-value',header=TRUE)
a<-table.row.end(a)
for (i in 2:(par1+1)) {
a<-table.row.start(a)
a<-table.element(a,i-1,header=TRUE)
a<-table.element(a,round(myacf[i],6))
mytstat <- myacf[i]*sqrtn
a<-table.element(a,round(mytstat,4))
a<-table.element(a,round(1-pt(abs(mytstat),lengthx),6))
a<-table.row.end(a)
}
a<-table.end(a)
table.save(a,file='mytable.tab')
a<-table.start()
a<-table.row.start(a)
a<-table.element(a,'Partial Autocorrelation Function',4,TRUE)
a<-table.row.end(a)
a<-table.row.start(a)
a<-table.element(a,'Time lag k',header=TRUE)
a<-table.element(a,hyperlink('basics.htm','PACF(k)','click here for more information about the Partial Autocorrelation Function'),header=TRUE)
a<-table.element(a,'T-STAT',header=TRUE)
a<-table.element(a,'P-value',header=TRUE)
a<-table.row.end(a)
for (i in 1:par1) {
a<-table.row.start(a)
a<-table.element(a,i,header=TRUE)
a<-table.element(a,round(mypacf[i],6))
mytstat <- mypacf[i]*sqrtn
a<-table.element(a,round(mytstat,4))
a<-table.element(a,round(1-pt(abs(mytstat),lengthx),6))
a<-table.row.end(a)
}
a<-table.end(a)
table.save(a,file='mytable1.tab')