Free Statistics

of Irreproducible Research!

Author's title

Author*Unverified author*
R Software Modulerwasp_autocorrelation.wasp
Title produced by software(Partial) Autocorrelation Function
Date of computationThu, 20 Oct 2016 16:06:59 +0100
Cite this page as followsStatistical Computations at FreeStatistics.org, Office for Research Development and Education, URL https://freestatistics.org/blog/index.php?v=date/2016/Oct/20/t1476976049i3ntxsogdhlgngy.htm/, Retrieved Sun, 05 May 2024 04:44:59 +0200
Statistical Computations at FreeStatistics.org, Office for Research Development and Education, URL https://freestatistics.org/blog/index.php?pk=, Retrieved Sun, 05 May 2024 04:44:59 +0200
QR Codes:

Original text written by user:
IsPrivate?No (this computation is public)
User-defined keywords
Estimated Impact0
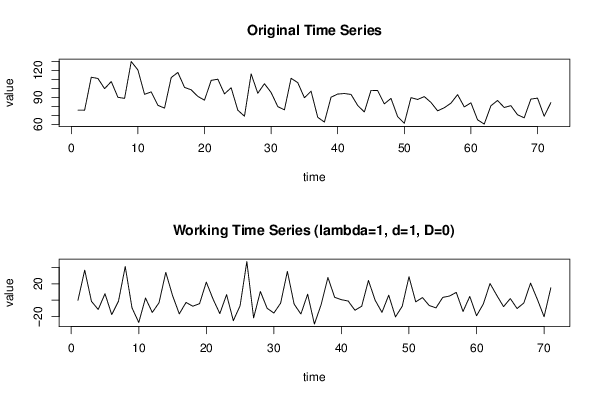
Dataseries X:
75,8
75,7
112,3
110,9
99,6
107,5
90
88,8
129,7
120,4
93,3
96
81,1
78
111,9
117,6
101
98,3
91
86,8
108,8
110,1
93,8
100,6
75,7
69
116
94,5
105,1
95,3
79,7
76,1
111,1
106,3
89,5
96,8
67,8
62,5
90,1
93,6
94,2
93,2
81
73,7
97,7
97,5
82,7
88,8
68,5
61,1
89,6
87,6
90,8
84,3
75
78,4
83,5
93
79,3
83,9
65
60,3
80,6
86,5
78,7
80,7
70,6
67,2
88
89,1
69
84,1


Summary of computational transaction
Raw Inputview raw input (R code)
Raw Outputview raw output of R engine
Computing time2 seconds
R Server'Gwilym Jenkins' @ jenkins.wessa.net

\begin{tabular}{lllllllll}
\hline
Summary of computational transaction \tabularnewline
Raw Input & view raw input (R code)  \tabularnewline
Raw Output & view raw output of R engine  \tabularnewline
Computing time & 2 seconds \tabularnewline
R Server & 'Gwilym Jenkins' @ jenkins.wessa.net \tabularnewline
\hline
\end{tabular}
%Source: https://freestatistics.org/blog/index.php?pk=&T=0

[TABLE]
[ROW][C]Summary of computational transaction[/C][/ROW]
[ROW][C]Raw Input[/C][C]view raw input (R code) [/C][/ROW]
[ROW][C]Raw Output[/C][C]view raw output of R engine [/C][/ROW]
[ROW][C]Computing time[/C][C]2 seconds[/C][/ROW]
[ROW][C]R Server[/C][C]'Gwilym Jenkins' @ jenkins.wessa.net[/C][/ROW]
[/TABLE]
Source: https://freestatistics.org/blog/index.php?pk=&T=0

Globally Unique Identifier (entire table): ba.freestatistics.org/blog/index.php?pk=&T=0

As an alternative you can also use a QR Code:  

The GUIDs for individual cells are displayed in the table below:

Summary of computational transaction
Raw Inputview raw input (R code)
Raw Outputview raw output of R engine
Computing time2 seconds
R Server'Gwilym Jenkins' @ jenkins.wessa.net


Autocorrelation Function
Time lag kACF(k)T-STATP-value
1-0.181809-1.5320.064989
2-0.349308-2.94330.002192
30.1533491.29210.100249
4-0.393534-3.3160.000721
5-0.059166-0.49850.309821
60.6761815.69760
7-0.014354-0.12090.452037
8-0.372833-3.14150.001225
90.1147360.96680.168468
10-0.312021-2.62910.005243
11-0.109176-0.91990.180362
120.665125.60440
13-0.048909-0.41210.340748
14-0.233891-1.97080.026323
150.0948960.79960.213302
16-0.350722-2.95520.002118
17-0.056614-0.4770.317401
180.5454644.59629e-06
19-0.034768-0.2930.385204
20-0.237127-1.99810.02477
210.1255571.0580.146829
22-0.325532-2.7430.003851
23-0.109966-0.92660.178639
240.5775464.86653e-06
25-0.075716-0.6380.262765
26-0.153305-1.29180.100313
270.1013860.85430.197907
28-0.295255-2.48790.0076
29-0.056541-0.47640.317617
300.3795043.19780.001035
310.0269210.22680.4106
32-0.190668-1.60660.056291
330.09880.83250.203957
34-0.213847-1.80190.037902
35-0.121338-1.02240.155029
360.3647113.07310.001502
370.0264150.22260.412251
38-0.15332-1.29190.100291
390.0799640.67380.251316
40-0.14963-1.26080.105754
41-0.087656-0.73860.231292
420.2514642.11890.0188
430.0330390.27840.39076
44-0.140218-1.18150.120673
450.0712530.60040.275079
46-0.137456-1.15820.125326
47-0.054203-0.45670.324633
480.1987981.67510.049157

\begin{tabular}{lllllllll}
\hline
Autocorrelation Function \tabularnewline
Time lag k & ACF(k) & T-STAT & P-value \tabularnewline
1 & -0.181809 & -1.532 & 0.064989 \tabularnewline
2 & -0.349308 & -2.9433 & 0.002192 \tabularnewline
3 & 0.153349 & 1.2921 & 0.100249 \tabularnewline
4 & -0.393534 & -3.316 & 0.000721 \tabularnewline
5 & -0.059166 & -0.4985 & 0.309821 \tabularnewline
6 & 0.676181 & 5.6976 & 0 \tabularnewline
7 & -0.014354 & -0.1209 & 0.452037 \tabularnewline
8 & -0.372833 & -3.1415 & 0.001225 \tabularnewline
9 & 0.114736 & 0.9668 & 0.168468 \tabularnewline
10 & -0.312021 & -2.6291 & 0.005243 \tabularnewline
11 & -0.109176 & -0.9199 & 0.180362 \tabularnewline
12 & 0.66512 & 5.6044 & 0 \tabularnewline
13 & -0.048909 & -0.4121 & 0.340748 \tabularnewline
14 & -0.233891 & -1.9708 & 0.026323 \tabularnewline
15 & 0.094896 & 0.7996 & 0.213302 \tabularnewline
16 & -0.350722 & -2.9552 & 0.002118 \tabularnewline
17 & -0.056614 & -0.477 & 0.317401 \tabularnewline
18 & 0.545464 & 4.5962 & 9e-06 \tabularnewline
19 & -0.034768 & -0.293 & 0.385204 \tabularnewline
20 & -0.237127 & -1.9981 & 0.02477 \tabularnewline
21 & 0.125557 & 1.058 & 0.146829 \tabularnewline
22 & -0.325532 & -2.743 & 0.003851 \tabularnewline
23 & -0.109966 & -0.9266 & 0.178639 \tabularnewline
24 & 0.577546 & 4.8665 & 3e-06 \tabularnewline
25 & -0.075716 & -0.638 & 0.262765 \tabularnewline
26 & -0.153305 & -1.2918 & 0.100313 \tabularnewline
27 & 0.101386 & 0.8543 & 0.197907 \tabularnewline
28 & -0.295255 & -2.4879 & 0.0076 \tabularnewline
29 & -0.056541 & -0.4764 & 0.317617 \tabularnewline
30 & 0.379504 & 3.1978 & 0.001035 \tabularnewline
31 & 0.026921 & 0.2268 & 0.4106 \tabularnewline
32 & -0.190668 & -1.6066 & 0.056291 \tabularnewline
33 & 0.0988 & 0.8325 & 0.203957 \tabularnewline
34 & -0.213847 & -1.8019 & 0.037902 \tabularnewline
35 & -0.121338 & -1.0224 & 0.155029 \tabularnewline
36 & 0.364711 & 3.0731 & 0.001502 \tabularnewline
37 & 0.026415 & 0.2226 & 0.412251 \tabularnewline
38 & -0.15332 & -1.2919 & 0.100291 \tabularnewline
39 & 0.079964 & 0.6738 & 0.251316 \tabularnewline
40 & -0.14963 & -1.2608 & 0.105754 \tabularnewline
41 & -0.087656 & -0.7386 & 0.231292 \tabularnewline
42 & 0.251464 & 2.1189 & 0.0188 \tabularnewline
43 & 0.033039 & 0.2784 & 0.39076 \tabularnewline
44 & -0.140218 & -1.1815 & 0.120673 \tabularnewline
45 & 0.071253 & 0.6004 & 0.275079 \tabularnewline
46 & -0.137456 & -1.1582 & 0.125326 \tabularnewline
47 & -0.054203 & -0.4567 & 0.324633 \tabularnewline
48 & 0.198798 & 1.6751 & 0.049157 \tabularnewline
\hline
\end{tabular}
%Source: https://freestatistics.org/blog/index.php?pk=&T=1

[TABLE]
[ROW][C]Autocorrelation Function[/C][/ROW]
[ROW][C]Time lag k[/C][C]ACF(k)[/C][C]T-STAT[/C][C]P-value[/C][/ROW]
[ROW][C]1[/C][C]-0.181809[/C][C]-1.532[/C][C]0.064989[/C][/ROW]
[ROW][C]2[/C][C]-0.349308[/C][C]-2.9433[/C][C]0.002192[/C][/ROW]
[ROW][C]3[/C][C]0.153349[/C][C]1.2921[/C][C]0.100249[/C][/ROW]
[ROW][C]4[/C][C]-0.393534[/C][C]-3.316[/C][C]0.000721[/C][/ROW]
[ROW][C]5[/C][C]-0.059166[/C][C]-0.4985[/C][C]0.309821[/C][/ROW]
[ROW][C]6[/C][C]0.676181[/C][C]5.6976[/C][C]0[/C][/ROW]
[ROW][C]7[/C][C]-0.014354[/C][C]-0.1209[/C][C]0.452037[/C][/ROW]
[ROW][C]8[/C][C]-0.372833[/C][C]-3.1415[/C][C]0.001225[/C][/ROW]
[ROW][C]9[/C][C]0.114736[/C][C]0.9668[/C][C]0.168468[/C][/ROW]
[ROW][C]10[/C][C]-0.312021[/C][C]-2.6291[/C][C]0.005243[/C][/ROW]
[ROW][C]11[/C][C]-0.109176[/C][C]-0.9199[/C][C]0.180362[/C][/ROW]
[ROW][C]12[/C][C]0.66512[/C][C]5.6044[/C][C]0[/C][/ROW]
[ROW][C]13[/C][C]-0.048909[/C][C]-0.4121[/C][C]0.340748[/C][/ROW]
[ROW][C]14[/C][C]-0.233891[/C][C]-1.9708[/C][C]0.026323[/C][/ROW]
[ROW][C]15[/C][C]0.094896[/C][C]0.7996[/C][C]0.213302[/C][/ROW]
[ROW][C]16[/C][C]-0.350722[/C][C]-2.9552[/C][C]0.002118[/C][/ROW]
[ROW][C]17[/C][C]-0.056614[/C][C]-0.477[/C][C]0.317401[/C][/ROW]
[ROW][C]18[/C][C]0.545464[/C][C]4.5962[/C][C]9e-06[/C][/ROW]
[ROW][C]19[/C][C]-0.034768[/C][C]-0.293[/C][C]0.385204[/C][/ROW]
[ROW][C]20[/C][C]-0.237127[/C][C]-1.9981[/C][C]0.02477[/C][/ROW]
[ROW][C]21[/C][C]0.125557[/C][C]1.058[/C][C]0.146829[/C][/ROW]
[ROW][C]22[/C][C]-0.325532[/C][C]-2.743[/C][C]0.003851[/C][/ROW]
[ROW][C]23[/C][C]-0.109966[/C][C]-0.9266[/C][C]0.178639[/C][/ROW]
[ROW][C]24[/C][C]0.577546[/C][C]4.8665[/C][C]3e-06[/C][/ROW]
[ROW][C]25[/C][C]-0.075716[/C][C]-0.638[/C][C]0.262765[/C][/ROW]
[ROW][C]26[/C][C]-0.153305[/C][C]-1.2918[/C][C]0.100313[/C][/ROW]
[ROW][C]27[/C][C]0.101386[/C][C]0.8543[/C][C]0.197907[/C][/ROW]
[ROW][C]28[/C][C]-0.295255[/C][C]-2.4879[/C][C]0.0076[/C][/ROW]
[ROW][C]29[/C][C]-0.056541[/C][C]-0.4764[/C][C]0.317617[/C][/ROW]
[ROW][C]30[/C][C]0.379504[/C][C]3.1978[/C][C]0.001035[/C][/ROW]
[ROW][C]31[/C][C]0.026921[/C][C]0.2268[/C][C]0.4106[/C][/ROW]
[ROW][C]32[/C][C]-0.190668[/C][C]-1.6066[/C][C]0.056291[/C][/ROW]
[ROW][C]33[/C][C]0.0988[/C][C]0.8325[/C][C]0.203957[/C][/ROW]
[ROW][C]34[/C][C]-0.213847[/C][C]-1.8019[/C][C]0.037902[/C][/ROW]
[ROW][C]35[/C][C]-0.121338[/C][C]-1.0224[/C][C]0.155029[/C][/ROW]
[ROW][C]36[/C][C]0.364711[/C][C]3.0731[/C][C]0.001502[/C][/ROW]
[ROW][C]37[/C][C]0.026415[/C][C]0.2226[/C][C]0.412251[/C][/ROW]
[ROW][C]38[/C][C]-0.15332[/C][C]-1.2919[/C][C]0.100291[/C][/ROW]
[ROW][C]39[/C][C]0.079964[/C][C]0.6738[/C][C]0.251316[/C][/ROW]
[ROW][C]40[/C][C]-0.14963[/C][C]-1.2608[/C][C]0.105754[/C][/ROW]
[ROW][C]41[/C][C]-0.087656[/C][C]-0.7386[/C][C]0.231292[/C][/ROW]
[ROW][C]42[/C][C]0.251464[/C][C]2.1189[/C][C]0.0188[/C][/ROW]
[ROW][C]43[/C][C]0.033039[/C][C]0.2784[/C][C]0.39076[/C][/ROW]
[ROW][C]44[/C][C]-0.140218[/C][C]-1.1815[/C][C]0.120673[/C][/ROW]
[ROW][C]45[/C][C]0.071253[/C][C]0.6004[/C][C]0.275079[/C][/ROW]
[ROW][C]46[/C][C]-0.137456[/C][C]-1.1582[/C][C]0.125326[/C][/ROW]
[ROW][C]47[/C][C]-0.054203[/C][C]-0.4567[/C][C]0.324633[/C][/ROW]
[ROW][C]48[/C][C]0.198798[/C][C]1.6751[/C][C]0.049157[/C][/ROW]
[/TABLE]
Source: https://freestatistics.org/blog/index.php?pk=&T=1

Globally Unique Identifier (entire table): ba.freestatistics.org/blog/index.php?pk=&T=1

As an alternative you can also use a QR Code:  

The GUIDs for individual cells are displayed in the table below:

Autocorrelation Function
Time lag kACF(k)T-STATP-value
1-0.181809-1.5320.064989
2-0.349308-2.94330.002192
30.1533491.29210.100249
4-0.393534-3.3160.000721
5-0.059166-0.49850.309821
60.6761815.69760
7-0.014354-0.12090.452037
8-0.372833-3.14150.001225
90.1147360.96680.168468
10-0.312021-2.62910.005243
11-0.109176-0.91990.180362
120.665125.60440
13-0.048909-0.41210.340748
14-0.233891-1.97080.026323
150.0948960.79960.213302
16-0.350722-2.95520.002118
17-0.056614-0.4770.317401
180.5454644.59629e-06
19-0.034768-0.2930.385204
20-0.237127-1.99810.02477
210.1255571.0580.146829
22-0.325532-2.7430.003851
23-0.109966-0.92660.178639
240.5775464.86653e-06
25-0.075716-0.6380.262765
26-0.153305-1.29180.100313
270.1013860.85430.197907
28-0.295255-2.48790.0076
29-0.056541-0.47640.317617
300.3795043.19780.001035
310.0269210.22680.4106
32-0.190668-1.60660.056291
330.09880.83250.203957
34-0.213847-1.80190.037902
35-0.121338-1.02240.155029
360.3647113.07310.001502
370.0264150.22260.412251
38-0.15332-1.29190.100291
390.0799640.67380.251316
40-0.14963-1.26080.105754
41-0.087656-0.73860.231292
420.2514642.11890.0188
430.0330390.27840.39076
44-0.140218-1.18150.120673
450.0712530.60040.275079
46-0.137456-1.15820.125326
47-0.054203-0.45670.324633
480.1987981.67510.049157


Partial Autocorrelation Function
Time lag kPACF(k)T-STATP-value
1-0.181809-1.5320.064989
2-0.395434-3.3320.000686
3-0.008783-0.0740.470606
4-0.606363-5.10931e-06
5-0.450377-3.79490.000154
60.2390872.01460.023869
70.3184192.6830.004535
8-0.164457-1.38570.085082
9-0.069963-0.58950.278693
10-0.144033-1.21360.114453
11-0.172499-1.45350.075246
120.1077130.90760.183579
13-0.049826-0.41980.337935
140.1565171.31880.09573
150.1685411.42010.07997
16-0.003983-0.03360.48666
17-0.022039-0.18570.426602
180.0518860.43720.331646
19-0.062355-0.52540.300468
20-0.169495-1.42820.07881
21-0.032291-0.27210.39317
220.0198330.16710.433876
23-0.078902-0.66480.254153
240.0745320.6280.266004
25-0.013315-0.11220.455492
260.1066370.89850.185968
27-0.07267-0.61230.271139
280.033490.28220.389308
290.1142660.96280.169451
30-0.138573-1.16760.123429
31-0.021487-0.18110.428421
32-0.085687-0.7220.236329
33-0.001745-0.01470.494156
340.0598010.50390.307947
35-0.041894-0.3530.362565
36-0.084647-0.71320.239015
370.1160430.97780.165748
38-0.138324-1.16550.12385
39-0.123581-1.04130.150633
400.0293960.24770.402543
410.1236631.0420.150473
42-0.010446-0.0880.465056
43-0.079519-0.670.252503
440.0212210.17880.429298
450.0694950.58560.280009
46-0.176812-1.48980.070347
47-0.016471-0.13880.445007
48-0.005161-0.04350.482717

\begin{tabular}{lllllllll}
\hline
Partial Autocorrelation Function \tabularnewline
Time lag k & PACF(k) & T-STAT & P-value \tabularnewline
1 & -0.181809 & -1.532 & 0.064989 \tabularnewline
2 & -0.395434 & -3.332 & 0.000686 \tabularnewline
3 & -0.008783 & -0.074 & 0.470606 \tabularnewline
4 & -0.606363 & -5.1093 & 1e-06 \tabularnewline
5 & -0.450377 & -3.7949 & 0.000154 \tabularnewline
6 & 0.239087 & 2.0146 & 0.023869 \tabularnewline
7 & 0.318419 & 2.683 & 0.004535 \tabularnewline
8 & -0.164457 & -1.3857 & 0.085082 \tabularnewline
9 & -0.069963 & -0.5895 & 0.278693 \tabularnewline
10 & -0.144033 & -1.2136 & 0.114453 \tabularnewline
11 & -0.172499 & -1.4535 & 0.075246 \tabularnewline
12 & 0.107713 & 0.9076 & 0.183579 \tabularnewline
13 & -0.049826 & -0.4198 & 0.337935 \tabularnewline
14 & 0.156517 & 1.3188 & 0.09573 \tabularnewline
15 & 0.168541 & 1.4201 & 0.07997 \tabularnewline
16 & -0.003983 & -0.0336 & 0.48666 \tabularnewline
17 & -0.022039 & -0.1857 & 0.426602 \tabularnewline
18 & 0.051886 & 0.4372 & 0.331646 \tabularnewline
19 & -0.062355 & -0.5254 & 0.300468 \tabularnewline
20 & -0.169495 & -1.4282 & 0.07881 \tabularnewline
21 & -0.032291 & -0.2721 & 0.39317 \tabularnewline
22 & 0.019833 & 0.1671 & 0.433876 \tabularnewline
23 & -0.078902 & -0.6648 & 0.254153 \tabularnewline
24 & 0.074532 & 0.628 & 0.266004 \tabularnewline
25 & -0.013315 & -0.1122 & 0.455492 \tabularnewline
26 & 0.106637 & 0.8985 & 0.185968 \tabularnewline
27 & -0.07267 & -0.6123 & 0.271139 \tabularnewline
28 & 0.03349 & 0.2822 & 0.389308 \tabularnewline
29 & 0.114266 & 0.9628 & 0.169451 \tabularnewline
30 & -0.138573 & -1.1676 & 0.123429 \tabularnewline
31 & -0.021487 & -0.1811 & 0.428421 \tabularnewline
32 & -0.085687 & -0.722 & 0.236329 \tabularnewline
33 & -0.001745 & -0.0147 & 0.494156 \tabularnewline
34 & 0.059801 & 0.5039 & 0.307947 \tabularnewline
35 & -0.041894 & -0.353 & 0.362565 \tabularnewline
36 & -0.084647 & -0.7132 & 0.239015 \tabularnewline
37 & 0.116043 & 0.9778 & 0.165748 \tabularnewline
38 & -0.138324 & -1.1655 & 0.12385 \tabularnewline
39 & -0.123581 & -1.0413 & 0.150633 \tabularnewline
40 & 0.029396 & 0.2477 & 0.402543 \tabularnewline
41 & 0.123663 & 1.042 & 0.150473 \tabularnewline
42 & -0.010446 & -0.088 & 0.465056 \tabularnewline
43 & -0.079519 & -0.67 & 0.252503 \tabularnewline
44 & 0.021221 & 0.1788 & 0.429298 \tabularnewline
45 & 0.069495 & 0.5856 & 0.280009 \tabularnewline
46 & -0.176812 & -1.4898 & 0.070347 \tabularnewline
47 & -0.016471 & -0.1388 & 0.445007 \tabularnewline
48 & -0.005161 & -0.0435 & 0.482717 \tabularnewline
\hline
\end{tabular}
%Source: https://freestatistics.org/blog/index.php?pk=&T=2

[TABLE]
[ROW][C]Partial Autocorrelation Function[/C][/ROW]
[ROW][C]Time lag k[/C][C]PACF(k)[/C][C]T-STAT[/C][C]P-value[/C][/ROW]
[ROW][C]1[/C][C]-0.181809[/C][C]-1.532[/C][C]0.064989[/C][/ROW]
[ROW][C]2[/C][C]-0.395434[/C][C]-3.332[/C][C]0.000686[/C][/ROW]
[ROW][C]3[/C][C]-0.008783[/C][C]-0.074[/C][C]0.470606[/C][/ROW]
[ROW][C]4[/C][C]-0.606363[/C][C]-5.1093[/C][C]1e-06[/C][/ROW]
[ROW][C]5[/C][C]-0.450377[/C][C]-3.7949[/C][C]0.000154[/C][/ROW]
[ROW][C]6[/C][C]0.239087[/C][C]2.0146[/C][C]0.023869[/C][/ROW]
[ROW][C]7[/C][C]0.318419[/C][C]2.683[/C][C]0.004535[/C][/ROW]
[ROW][C]8[/C][C]-0.164457[/C][C]-1.3857[/C][C]0.085082[/C][/ROW]
[ROW][C]9[/C][C]-0.069963[/C][C]-0.5895[/C][C]0.278693[/C][/ROW]
[ROW][C]10[/C][C]-0.144033[/C][C]-1.2136[/C][C]0.114453[/C][/ROW]
[ROW][C]11[/C][C]-0.172499[/C][C]-1.4535[/C][C]0.075246[/C][/ROW]
[ROW][C]12[/C][C]0.107713[/C][C]0.9076[/C][C]0.183579[/C][/ROW]
[ROW][C]13[/C][C]-0.049826[/C][C]-0.4198[/C][C]0.337935[/C][/ROW]
[ROW][C]14[/C][C]0.156517[/C][C]1.3188[/C][C]0.09573[/C][/ROW]
[ROW][C]15[/C][C]0.168541[/C][C]1.4201[/C][C]0.07997[/C][/ROW]
[ROW][C]16[/C][C]-0.003983[/C][C]-0.0336[/C][C]0.48666[/C][/ROW]
[ROW][C]17[/C][C]-0.022039[/C][C]-0.1857[/C][C]0.426602[/C][/ROW]
[ROW][C]18[/C][C]0.051886[/C][C]0.4372[/C][C]0.331646[/C][/ROW]
[ROW][C]19[/C][C]-0.062355[/C][C]-0.5254[/C][C]0.300468[/C][/ROW]
[ROW][C]20[/C][C]-0.169495[/C][C]-1.4282[/C][C]0.07881[/C][/ROW]
[ROW][C]21[/C][C]-0.032291[/C][C]-0.2721[/C][C]0.39317[/C][/ROW]
[ROW][C]22[/C][C]0.019833[/C][C]0.1671[/C][C]0.433876[/C][/ROW]
[ROW][C]23[/C][C]-0.078902[/C][C]-0.6648[/C][C]0.254153[/C][/ROW]
[ROW][C]24[/C][C]0.074532[/C][C]0.628[/C][C]0.266004[/C][/ROW]
[ROW][C]25[/C][C]-0.013315[/C][C]-0.1122[/C][C]0.455492[/C][/ROW]
[ROW][C]26[/C][C]0.106637[/C][C]0.8985[/C][C]0.185968[/C][/ROW]
[ROW][C]27[/C][C]-0.07267[/C][C]-0.6123[/C][C]0.271139[/C][/ROW]
[ROW][C]28[/C][C]0.03349[/C][C]0.2822[/C][C]0.389308[/C][/ROW]
[ROW][C]29[/C][C]0.114266[/C][C]0.9628[/C][C]0.169451[/C][/ROW]
[ROW][C]30[/C][C]-0.138573[/C][C]-1.1676[/C][C]0.123429[/C][/ROW]
[ROW][C]31[/C][C]-0.021487[/C][C]-0.1811[/C][C]0.428421[/C][/ROW]
[ROW][C]32[/C][C]-0.085687[/C][C]-0.722[/C][C]0.236329[/C][/ROW]
[ROW][C]33[/C][C]-0.001745[/C][C]-0.0147[/C][C]0.494156[/C][/ROW]
[ROW][C]34[/C][C]0.059801[/C][C]0.5039[/C][C]0.307947[/C][/ROW]
[ROW][C]35[/C][C]-0.041894[/C][C]-0.353[/C][C]0.362565[/C][/ROW]
[ROW][C]36[/C][C]-0.084647[/C][C]-0.7132[/C][C]0.239015[/C][/ROW]
[ROW][C]37[/C][C]0.116043[/C][C]0.9778[/C][C]0.165748[/C][/ROW]
[ROW][C]38[/C][C]-0.138324[/C][C]-1.1655[/C][C]0.12385[/C][/ROW]
[ROW][C]39[/C][C]-0.123581[/C][C]-1.0413[/C][C]0.150633[/C][/ROW]
[ROW][C]40[/C][C]0.029396[/C][C]0.2477[/C][C]0.402543[/C][/ROW]
[ROW][C]41[/C][C]0.123663[/C][C]1.042[/C][C]0.150473[/C][/ROW]
[ROW][C]42[/C][C]-0.010446[/C][C]-0.088[/C][C]0.465056[/C][/ROW]
[ROW][C]43[/C][C]-0.079519[/C][C]-0.67[/C][C]0.252503[/C][/ROW]
[ROW][C]44[/C][C]0.021221[/C][C]0.1788[/C][C]0.429298[/C][/ROW]
[ROW][C]45[/C][C]0.069495[/C][C]0.5856[/C][C]0.280009[/C][/ROW]
[ROW][C]46[/C][C]-0.176812[/C][C]-1.4898[/C][C]0.070347[/C][/ROW]
[ROW][C]47[/C][C]-0.016471[/C][C]-0.1388[/C][C]0.445007[/C][/ROW]
[ROW][C]48[/C][C]-0.005161[/C][C]-0.0435[/C][C]0.482717[/C][/ROW]
[/TABLE]
Source: https://freestatistics.org/blog/index.php?pk=&T=2

Globally Unique Identifier (entire table): ba.freestatistics.org/blog/index.php?pk=&T=2

As an alternative you can also use a QR Code:  

The GUIDs for individual cells are displayed in the table below:

Partial Autocorrelation Function
Time lag kPACF(k)T-STATP-value
1-0.181809-1.5320.064989
2-0.395434-3.3320.000686
3-0.008783-0.0740.470606
4-0.606363-5.10931e-06
5-0.450377-3.79490.000154
60.2390872.01460.023869
70.3184192.6830.004535
8-0.164457-1.38570.085082
9-0.069963-0.58950.278693
10-0.144033-1.21360.114453
11-0.172499-1.45350.075246
120.1077130.90760.183579
13-0.049826-0.41980.337935
140.1565171.31880.09573
150.1685411.42010.07997
16-0.003983-0.03360.48666
17-0.022039-0.18570.426602
180.0518860.43720.331646
19-0.062355-0.52540.300468
20-0.169495-1.42820.07881
21-0.032291-0.27210.39317
220.0198330.16710.433876
23-0.078902-0.66480.254153
240.0745320.6280.266004
25-0.013315-0.11220.455492
260.1066370.89850.185968
27-0.07267-0.61230.271139
280.033490.28220.389308
290.1142660.96280.169451
30-0.138573-1.16760.123429
31-0.021487-0.18110.428421
32-0.085687-0.7220.236329
33-0.001745-0.01470.494156
340.0598010.50390.307947
35-0.041894-0.3530.362565
36-0.084647-0.71320.239015
370.1160430.97780.165748
38-0.138324-1.16550.12385
39-0.123581-1.04130.150633
400.0293960.24770.402543
410.1236631.0420.150473
42-0.010446-0.0880.465056
43-0.079519-0.670.252503
440.0212210.17880.429298
450.0694950.58560.280009
46-0.176812-1.48980.070347
47-0.016471-0.13880.445007
48-0.005161-0.04350.482717


Parameters (Session):
par1 = 48 ; par2 = 1 ; par3 = 1 ; par4 = 0 ; par5 = 12 ; par6 = White Noise ; par7 = 0.95 ;
Parameters (R input):
par1 = 48 ; par2 = 1 ; par3 = 1 ; par4 = 0 ; par5 = 12 ; par6 = White Noise ; par7 = 0.95 ; par8 = ;
R code (references can be found in the software module):
par8 <- ''
par7 <- '0.95'
par6 <- 'White Noise'
par5 <- '12'
par4 <- '0'
par3 <- '1'
par2 <- '1'
par1 <- '48'
if (par1 == 'Default') {
par1 = 10*log10(length(x))
} else {
par1 <- as.numeric(par1)
}
par2 <- as.numeric(par2)
par3 <- as.numeric(par3)
par4 <- as.numeric(par4)
par5 <- as.numeric(par5)
if (par6 == 'White Noise') par6 <- 'white' else par6 <- 'ma'
par7 <- as.numeric(par7)
if (par8 != '') par8 <- as.numeric(par8)
x <- na.omit(x)
ox <- x
if (par8 == '') {
if (par2 == 0) {
x <- log(x)
} else {
x <- (x ^ par2 - 1) / par2
}
} else {
x <- log(x,base=par8)
}
if (par3 > 0) x <- diff(x,lag=1,difference=par3)
if (par4 > 0) x <- diff(x,lag=par5,difference=par4)
bitmap(file='picts.png')
op <- par(mfrow=c(2,1))
plot(ox,type='l',main='Original Time Series',xlab='time',ylab='value')
if (par8=='') {
mytitle <- paste('Working Time Series (lambda=',par2,', d=',par3,', D=',par4,')',sep='')
mysub <- paste('(lambda=',par2,', d=',par3,', D=',par4,', CI=', par7, ', CI type=',par6,')',sep='')
} else {
mytitle <- paste('Working Time Series (base=',par8,', d=',par3,', D=',par4,')',sep='')
mysub <- paste('(base=',par8,', d=',par3,', D=',par4,', CI=', par7, ', CI type=',par6,')',sep='')
}
plot(x,type='l', main=mytitle,xlab='time',ylab='value')
par(op)
dev.off()
bitmap(file='pic1.png')
racf <- acf(x, par1, main='Autocorrelation', xlab='time lag', ylab='ACF', ci.type=par6, ci=par7, sub=mysub)
dev.off()
bitmap(file='pic2.png')
rpacf <- pacf(x,par1,main='Partial Autocorrelation',xlab='lags',ylab='PACF',sub=mysub)
dev.off()
(myacf <- c(racf$acf))
(mypacf <- c(rpacf$acf))
lengthx <- length(x)
sqrtn <- sqrt(lengthx)
load(file='createtable')
a<-table.start()
a<-table.row.start(a)
a<-table.element(a,'Autocorrelation Function',4,TRUE)
a<-table.row.end(a)
a<-table.row.start(a)
a<-table.element(a,'Time lag k',header=TRUE)
a<-table.element(a,hyperlink('basics.htm','ACF(k)','click here for more information about the Autocorrelation Function'),header=TRUE)
a<-table.element(a,'T-STAT',header=TRUE)
a<-table.element(a,'P-value',header=TRUE)
a<-table.row.end(a)
for (i in 2:(par1+1)) {
a<-table.row.start(a)
a<-table.element(a,i-1,header=TRUE)
a<-table.element(a,round(myacf[i],6))
mytstat <- myacf[i]*sqrtn
a<-table.element(a,round(mytstat,4))
a<-table.element(a,round(1-pt(abs(mytstat),lengthx),6))
a<-table.row.end(a)
}
a<-table.end(a)
table.save(a,file='mytable.tab')
a<-table.start()
a<-table.row.start(a)
a<-table.element(a,'Partial Autocorrelation Function',4,TRUE)
a<-table.row.end(a)
a<-table.row.start(a)
a<-table.element(a,'Time lag k',header=TRUE)
a<-table.element(a,hyperlink('basics.htm','PACF(k)','click here for more information about the Partial Autocorrelation Function'),header=TRUE)
a<-table.element(a,'T-STAT',header=TRUE)
a<-table.element(a,'P-value',header=TRUE)
a<-table.row.end(a)
for (i in 1:par1) {
a<-table.row.start(a)
a<-table.element(a,i,header=TRUE)
a<-table.element(a,round(mypacf[i],6))
mytstat <- mypacf[i]*sqrtn
a<-table.element(a,round(mytstat,4))
a<-table.element(a,round(1-pt(abs(mytstat),lengthx),6))
a<-table.row.end(a)
}
a<-table.end(a)
table.save(a,file='mytable1.tab')