Free Statistics

of Irreproducible Research!

Author's title

Author*Unverified author*
R Software Modulerwasp_autocorrelation.wasp
Title produced by software(Partial) Autocorrelation Function
Date of computationThu, 20 Oct 2016 18:17:27 +0100
Cite this page as followsStatistical Computations at FreeStatistics.org, Office for Research Development and Education, URL https://freestatistics.org/blog/index.php?v=date/2016/Oct/20/t1476983891qua0gvescyt8hzh.htm/, Retrieved Sun, 05 May 2024 01:38:38 +0200
Statistical Computations at FreeStatistics.org, Office for Research Development and Education, URL https://freestatistics.org/blog/index.php?pk=, Retrieved Sun, 05 May 2024 01:38:38 +0200
QR Codes:

Original text written by user:
IsPrivate?No (this computation is public)
User-defined keywords
Estimated Impact0
Dataseries X:
12200
10644
12044
11338
11292
10612
10995
10686
10635
11285
11475
12535
12490
12511
12799
11876
11602
11062
11055
10855
10704
11510
11663
12686
13516
12539
13811
12354
11441
10814
11261
10788
10326
11490
11029
11876
12198
11142
12008
11258
11367
10596
11721
11199
10972
11635
11725
13402
14955
13183
13673
12195
11811
11138
11590
11174
11250
12235
11612
12318


Summary of computational transaction
Raw Inputview raw input (R code)
Raw Outputview raw output of R engine
Computing time2 seconds
R Server'Herman Ole Andreas Wold' @ wold.wessa.net

\begin{tabular}{lllllllll}
\hline
Summary of computational transaction \tabularnewline
Raw Input & view raw input (R code)  \tabularnewline
Raw Output & view raw output of R engine  \tabularnewline
Computing time & 2 seconds \tabularnewline
R Server & 'Herman Ole Andreas Wold' @ wold.wessa.net \tabularnewline
\hline
\end{tabular}
%Source: https://freestatistics.org/blog/index.php?pk=&T=0

[TABLE]
[ROW][C]Summary of computational transaction[/C][/ROW]
[ROW][C]Raw Input[/C][C]view raw input (R code) [/C][/ROW]
[ROW][C]Raw Output[/C][C]view raw output of R engine [/C][/ROW]
[ROW][C]Computing time[/C][C]2 seconds[/C][/ROW]
[ROW][C]R Server[/C][C]'Herman Ole Andreas Wold' @ wold.wessa.net[/C][/ROW]
[/TABLE]
Source: https://freestatistics.org/blog/index.php?pk=&T=0

Globally Unique Identifier (entire table): ba.freestatistics.org/blog/index.php?pk=&T=0

As an alternative you can also use a QR Code:  

The GUIDs for individual cells are displayed in the table below:

Summary of computational transaction
Raw Inputview raw input (R code)
Raw Outputview raw output of R engine
Computing time2 seconds
R Server'Herman Ole Andreas Wold' @ wold.wessa.net


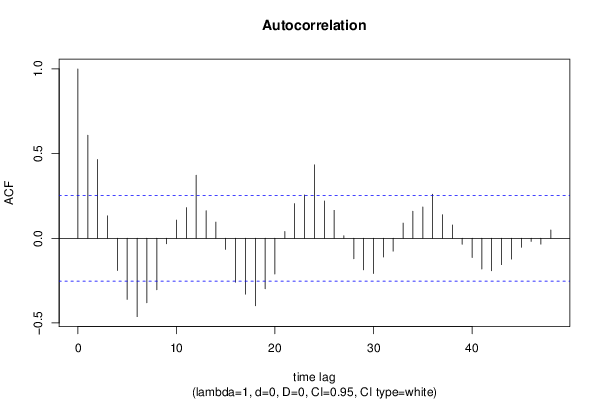
Autocorrelation Function
Time lag kACF(k)T-STATP-value
10.6085254.71367e-06
20.4651293.60290.00032
30.1323641.02530.154671
4-0.189962-1.47140.073199
5-0.360566-2.79290.003499
6-0.462571-3.58310.000341
7-0.380069-2.9440.002301
8-0.303765-2.3530.010961
9-0.032177-0.24920.402014
100.1076470.83380.203842
110.1810571.40250.082965
120.3725612.88580.002709
130.1626391.25980.10631
140.0957980.7420.230477
15-0.065245-0.50540.307569
16-0.258734-2.00410.024787
17-0.329712-2.55390.006604
18-0.397801-3.08130.001555
19-0.298302-2.31060.012154
20-0.210537-1.63080.054085
210.0403820.31280.377759
220.205091.58860.058701
230.2562271.98470.025876
240.43363.35860.000683
250.2198921.70330.046846
260.1649421.27760.10315
270.0153340.11880.452925
28-0.120338-0.93210.177502
29-0.186257-1.44270.077147
30-0.208231-1.61290.056002
31-0.110456-0.85560.197814
32-0.075821-0.58730.279599
330.0898630.69610.244534
340.1601991.24090.109737
350.1853121.43540.07818
360.2597552.01210.024355
370.1390761.07730.142834
380.0789120.61130.271671
39-0.035535-0.27530.392034
40-0.113626-0.88010.191147
41-0.181332-1.40460.08265
42-0.191853-1.48610.071246
43-0.155404-1.20380.116707
44-0.12274-0.95070.172775
45-0.053191-0.4120.340897
46-0.018297-0.14170.443886
47-0.034226-0.26510.395915
480.049440.3830.351552

\begin{tabular}{lllllllll}
\hline
Autocorrelation Function \tabularnewline
Time lag k & ACF(k) & T-STAT & P-value \tabularnewline
1 & 0.608525 & 4.7136 & 7e-06 \tabularnewline
2 & 0.465129 & 3.6029 & 0.00032 \tabularnewline
3 & 0.132364 & 1.0253 & 0.154671 \tabularnewline
4 & -0.189962 & -1.4714 & 0.073199 \tabularnewline
5 & -0.360566 & -2.7929 & 0.003499 \tabularnewline
6 & -0.462571 & -3.5831 & 0.000341 \tabularnewline
7 & -0.380069 & -2.944 & 0.002301 \tabularnewline
8 & -0.303765 & -2.353 & 0.010961 \tabularnewline
9 & -0.032177 & -0.2492 & 0.402014 \tabularnewline
10 & 0.107647 & 0.8338 & 0.203842 \tabularnewline
11 & 0.181057 & 1.4025 & 0.082965 \tabularnewline
12 & 0.372561 & 2.8858 & 0.002709 \tabularnewline
13 & 0.162639 & 1.2598 & 0.10631 \tabularnewline
14 & 0.095798 & 0.742 & 0.230477 \tabularnewline
15 & -0.065245 & -0.5054 & 0.307569 \tabularnewline
16 & -0.258734 & -2.0041 & 0.024787 \tabularnewline
17 & -0.329712 & -2.5539 & 0.006604 \tabularnewline
18 & -0.397801 & -3.0813 & 0.001555 \tabularnewline
19 & -0.298302 & -2.3106 & 0.012154 \tabularnewline
20 & -0.210537 & -1.6308 & 0.054085 \tabularnewline
21 & 0.040382 & 0.3128 & 0.377759 \tabularnewline
22 & 0.20509 & 1.5886 & 0.058701 \tabularnewline
23 & 0.256227 & 1.9847 & 0.025876 \tabularnewline
24 & 0.4336 & 3.3586 & 0.000683 \tabularnewline
25 & 0.219892 & 1.7033 & 0.046846 \tabularnewline
26 & 0.164942 & 1.2776 & 0.10315 \tabularnewline
27 & 0.015334 & 0.1188 & 0.452925 \tabularnewline
28 & -0.120338 & -0.9321 & 0.177502 \tabularnewline
29 & -0.186257 & -1.4427 & 0.077147 \tabularnewline
30 & -0.208231 & -1.6129 & 0.056002 \tabularnewline
31 & -0.110456 & -0.8556 & 0.197814 \tabularnewline
32 & -0.075821 & -0.5873 & 0.279599 \tabularnewline
33 & 0.089863 & 0.6961 & 0.244534 \tabularnewline
34 & 0.160199 & 1.2409 & 0.109737 \tabularnewline
35 & 0.185312 & 1.4354 & 0.07818 \tabularnewline
36 & 0.259755 & 2.0121 & 0.024355 \tabularnewline
37 & 0.139076 & 1.0773 & 0.142834 \tabularnewline
38 & 0.078912 & 0.6113 & 0.271671 \tabularnewline
39 & -0.035535 & -0.2753 & 0.392034 \tabularnewline
40 & -0.113626 & -0.8801 & 0.191147 \tabularnewline
41 & -0.181332 & -1.4046 & 0.08265 \tabularnewline
42 & -0.191853 & -1.4861 & 0.071246 \tabularnewline
43 & -0.155404 & -1.2038 & 0.116707 \tabularnewline
44 & -0.12274 & -0.9507 & 0.172775 \tabularnewline
45 & -0.053191 & -0.412 & 0.340897 \tabularnewline
46 & -0.018297 & -0.1417 & 0.443886 \tabularnewline
47 & -0.034226 & -0.2651 & 0.395915 \tabularnewline
48 & 0.04944 & 0.383 & 0.351552 \tabularnewline
\hline
\end{tabular}
%Source: https://freestatistics.org/blog/index.php?pk=&T=1

[TABLE]
[ROW][C]Autocorrelation Function[/C][/ROW]
[ROW][C]Time lag k[/C][C]ACF(k)[/C][C]T-STAT[/C][C]P-value[/C][/ROW]
[ROW][C]1[/C][C]0.608525[/C][C]4.7136[/C][C]7e-06[/C][/ROW]
[ROW][C]2[/C][C]0.465129[/C][C]3.6029[/C][C]0.00032[/C][/ROW]
[ROW][C]3[/C][C]0.132364[/C][C]1.0253[/C][C]0.154671[/C][/ROW]
[ROW][C]4[/C][C]-0.189962[/C][C]-1.4714[/C][C]0.073199[/C][/ROW]
[ROW][C]5[/C][C]-0.360566[/C][C]-2.7929[/C][C]0.003499[/C][/ROW]
[ROW][C]6[/C][C]-0.462571[/C][C]-3.5831[/C][C]0.000341[/C][/ROW]
[ROW][C]7[/C][C]-0.380069[/C][C]-2.944[/C][C]0.002301[/C][/ROW]
[ROW][C]8[/C][C]-0.303765[/C][C]-2.353[/C][C]0.010961[/C][/ROW]
[ROW][C]9[/C][C]-0.032177[/C][C]-0.2492[/C][C]0.402014[/C][/ROW]
[ROW][C]10[/C][C]0.107647[/C][C]0.8338[/C][C]0.203842[/C][/ROW]
[ROW][C]11[/C][C]0.181057[/C][C]1.4025[/C][C]0.082965[/C][/ROW]
[ROW][C]12[/C][C]0.372561[/C][C]2.8858[/C][C]0.002709[/C][/ROW]
[ROW][C]13[/C][C]0.162639[/C][C]1.2598[/C][C]0.10631[/C][/ROW]
[ROW][C]14[/C][C]0.095798[/C][C]0.742[/C][C]0.230477[/C][/ROW]
[ROW][C]15[/C][C]-0.065245[/C][C]-0.5054[/C][C]0.307569[/C][/ROW]
[ROW][C]16[/C][C]-0.258734[/C][C]-2.0041[/C][C]0.024787[/C][/ROW]
[ROW][C]17[/C][C]-0.329712[/C][C]-2.5539[/C][C]0.006604[/C][/ROW]
[ROW][C]18[/C][C]-0.397801[/C][C]-3.0813[/C][C]0.001555[/C][/ROW]
[ROW][C]19[/C][C]-0.298302[/C][C]-2.3106[/C][C]0.012154[/C][/ROW]
[ROW][C]20[/C][C]-0.210537[/C][C]-1.6308[/C][C]0.054085[/C][/ROW]
[ROW][C]21[/C][C]0.040382[/C][C]0.3128[/C][C]0.377759[/C][/ROW]
[ROW][C]22[/C][C]0.20509[/C][C]1.5886[/C][C]0.058701[/C][/ROW]
[ROW][C]23[/C][C]0.256227[/C][C]1.9847[/C][C]0.025876[/C][/ROW]
[ROW][C]24[/C][C]0.4336[/C][C]3.3586[/C][C]0.000683[/C][/ROW]
[ROW][C]25[/C][C]0.219892[/C][C]1.7033[/C][C]0.046846[/C][/ROW]
[ROW][C]26[/C][C]0.164942[/C][C]1.2776[/C][C]0.10315[/C][/ROW]
[ROW][C]27[/C][C]0.015334[/C][C]0.1188[/C][C]0.452925[/C][/ROW]
[ROW][C]28[/C][C]-0.120338[/C][C]-0.9321[/C][C]0.177502[/C][/ROW]
[ROW][C]29[/C][C]-0.186257[/C][C]-1.4427[/C][C]0.077147[/C][/ROW]
[ROW][C]30[/C][C]-0.208231[/C][C]-1.6129[/C][C]0.056002[/C][/ROW]
[ROW][C]31[/C][C]-0.110456[/C][C]-0.8556[/C][C]0.197814[/C][/ROW]
[ROW][C]32[/C][C]-0.075821[/C][C]-0.5873[/C][C]0.279599[/C][/ROW]
[ROW][C]33[/C][C]0.089863[/C][C]0.6961[/C][C]0.244534[/C][/ROW]
[ROW][C]34[/C][C]0.160199[/C][C]1.2409[/C][C]0.109737[/C][/ROW]
[ROW][C]35[/C][C]0.185312[/C][C]1.4354[/C][C]0.07818[/C][/ROW]
[ROW][C]36[/C][C]0.259755[/C][C]2.0121[/C][C]0.024355[/C][/ROW]
[ROW][C]37[/C][C]0.139076[/C][C]1.0773[/C][C]0.142834[/C][/ROW]
[ROW][C]38[/C][C]0.078912[/C][C]0.6113[/C][C]0.271671[/C][/ROW]
[ROW][C]39[/C][C]-0.035535[/C][C]-0.2753[/C][C]0.392034[/C][/ROW]
[ROW][C]40[/C][C]-0.113626[/C][C]-0.8801[/C][C]0.191147[/C][/ROW]
[ROW][C]41[/C][C]-0.181332[/C][C]-1.4046[/C][C]0.08265[/C][/ROW]
[ROW][C]42[/C][C]-0.191853[/C][C]-1.4861[/C][C]0.071246[/C][/ROW]
[ROW][C]43[/C][C]-0.155404[/C][C]-1.2038[/C][C]0.116707[/C][/ROW]
[ROW][C]44[/C][C]-0.12274[/C][C]-0.9507[/C][C]0.172775[/C][/ROW]
[ROW][C]45[/C][C]-0.053191[/C][C]-0.412[/C][C]0.340897[/C][/ROW]
[ROW][C]46[/C][C]-0.018297[/C][C]-0.1417[/C][C]0.443886[/C][/ROW]
[ROW][C]47[/C][C]-0.034226[/C][C]-0.2651[/C][C]0.395915[/C][/ROW]
[ROW][C]48[/C][C]0.04944[/C][C]0.383[/C][C]0.351552[/C][/ROW]
[/TABLE]
Source: https://freestatistics.org/blog/index.php?pk=&T=1

Globally Unique Identifier (entire table): ba.freestatistics.org/blog/index.php?pk=&T=1

As an alternative you can also use a QR Code:  

The GUIDs for individual cells are displayed in the table below:

Autocorrelation Function
Time lag kACF(k)T-STATP-value
10.6085254.71367e-06
20.4651293.60290.00032
30.1323641.02530.154671
4-0.189962-1.47140.073199
5-0.360566-2.79290.003499
6-0.462571-3.58310.000341
7-0.380069-2.9440.002301
8-0.303765-2.3530.010961
9-0.032177-0.24920.402014
100.1076470.83380.203842
110.1810571.40250.082965
120.3725612.88580.002709
130.1626391.25980.10631
140.0957980.7420.230477
15-0.065245-0.50540.307569
16-0.258734-2.00410.024787
17-0.329712-2.55390.006604
18-0.397801-3.08130.001555
19-0.298302-2.31060.012154
20-0.210537-1.63080.054085
210.0403820.31280.377759
220.205091.58860.058701
230.2562271.98470.025876
240.43363.35860.000683
250.2198921.70330.046846
260.1649421.27760.10315
270.0153340.11880.452925
28-0.120338-0.93210.177502
29-0.186257-1.44270.077147
30-0.208231-1.61290.056002
31-0.110456-0.85560.197814
32-0.075821-0.58730.279599
330.0898630.69610.244534
340.1601991.24090.109737
350.1853121.43540.07818
360.2597552.01210.024355
370.1390761.07730.142834
380.0789120.61130.271671
39-0.035535-0.27530.392034
40-0.113626-0.88010.191147
41-0.181332-1.40460.08265
42-0.191853-1.48610.071246
43-0.155404-1.20380.116707
44-0.12274-0.95070.172775
45-0.053191-0.4120.340897
46-0.018297-0.14170.443886
47-0.034226-0.26510.395915
480.049440.3830.351552


Partial Autocorrelation Function
Time lag kPACF(k)T-STATP-value
10.6085254.71367e-06
20.1505911.16650.12402
3-0.324484-2.51340.007329
4-0.391281-3.03090.001798
5-0.10672-0.82660.205855
6-0.010475-0.08110.467802
70.0994260.77020.222115
8-0.087346-0.67660.250638
90.1611251.24810.108427
100.0181190.14040.444426
11-0.179387-1.38950.084904
120.2637942.04330.022709
13-0.267816-2.07450.021166
14-0.161363-1.24990.108093
150.0598160.46330.3224
16-0.147065-1.13920.129582
17-0.046367-0.35920.36037
18-0.12865-0.99650.1615
19-0.030639-0.23730.406606
200.0965330.74770.228769
210.0021860.01690.493273
220.0919620.71230.23951
23-0.109444-0.84780.199973
240.0768030.59490.27707
25-0.132736-1.02820.153998
26-0.035783-0.27720.391299
270.1187510.91980.18067
280.0411850.3190.37541
29-0.062029-0.48050.316319
300.0482520.37380.354952
310.0354530.27460.392278
32-0.000721-0.00560.497782
33-0.065875-0.51030.305869
340.0350710.27170.393409
350.1264930.97980.165556
36-0.092776-0.71860.237575
370.0851560.65960.256012
380.0230350.17840.429495
39-0.070749-0.5480.292857
400.1333741.03310.152848
41-0.042549-0.32960.371431
420.0483550.37460.354656
43-0.097741-0.75710.225976
44-0.035558-0.27540.391965
45-0.051609-0.39980.345376
46-0.141351-1.09490.138968
47-0.015337-0.11880.452914
480.0855760.66290.254976

\begin{tabular}{lllllllll}
\hline
Partial Autocorrelation Function \tabularnewline
Time lag k & PACF(k) & T-STAT & P-value \tabularnewline
1 & 0.608525 & 4.7136 & 7e-06 \tabularnewline
2 & 0.150591 & 1.1665 & 0.12402 \tabularnewline
3 & -0.324484 & -2.5134 & 0.007329 \tabularnewline
4 & -0.391281 & -3.0309 & 0.001798 \tabularnewline
5 & -0.10672 & -0.8266 & 0.205855 \tabularnewline
6 & -0.010475 & -0.0811 & 0.467802 \tabularnewline
7 & 0.099426 & 0.7702 & 0.222115 \tabularnewline
8 & -0.087346 & -0.6766 & 0.250638 \tabularnewline
9 & 0.161125 & 1.2481 & 0.108427 \tabularnewline
10 & 0.018119 & 0.1404 & 0.444426 \tabularnewline
11 & -0.179387 & -1.3895 & 0.084904 \tabularnewline
12 & 0.263794 & 2.0433 & 0.022709 \tabularnewline
13 & -0.267816 & -2.0745 & 0.021166 \tabularnewline
14 & -0.161363 & -1.2499 & 0.108093 \tabularnewline
15 & 0.059816 & 0.4633 & 0.3224 \tabularnewline
16 & -0.147065 & -1.1392 & 0.129582 \tabularnewline
17 & -0.046367 & -0.3592 & 0.36037 \tabularnewline
18 & -0.12865 & -0.9965 & 0.1615 \tabularnewline
19 & -0.030639 & -0.2373 & 0.406606 \tabularnewline
20 & 0.096533 & 0.7477 & 0.228769 \tabularnewline
21 & 0.002186 & 0.0169 & 0.493273 \tabularnewline
22 & 0.091962 & 0.7123 & 0.23951 \tabularnewline
23 & -0.109444 & -0.8478 & 0.199973 \tabularnewline
24 & 0.076803 & 0.5949 & 0.27707 \tabularnewline
25 & -0.132736 & -1.0282 & 0.153998 \tabularnewline
26 & -0.035783 & -0.2772 & 0.391299 \tabularnewline
27 & 0.118751 & 0.9198 & 0.18067 \tabularnewline
28 & 0.041185 & 0.319 & 0.37541 \tabularnewline
29 & -0.062029 & -0.4805 & 0.316319 \tabularnewline
30 & 0.048252 & 0.3738 & 0.354952 \tabularnewline
31 & 0.035453 & 0.2746 & 0.392278 \tabularnewline
32 & -0.000721 & -0.0056 & 0.497782 \tabularnewline
33 & -0.065875 & -0.5103 & 0.305869 \tabularnewline
34 & 0.035071 & 0.2717 & 0.393409 \tabularnewline
35 & 0.126493 & 0.9798 & 0.165556 \tabularnewline
36 & -0.092776 & -0.7186 & 0.237575 \tabularnewline
37 & 0.085156 & 0.6596 & 0.256012 \tabularnewline
38 & 0.023035 & 0.1784 & 0.429495 \tabularnewline
39 & -0.070749 & -0.548 & 0.292857 \tabularnewline
40 & 0.133374 & 1.0331 & 0.152848 \tabularnewline
41 & -0.042549 & -0.3296 & 0.371431 \tabularnewline
42 & 0.048355 & 0.3746 & 0.354656 \tabularnewline
43 & -0.097741 & -0.7571 & 0.225976 \tabularnewline
44 & -0.035558 & -0.2754 & 0.391965 \tabularnewline
45 & -0.051609 & -0.3998 & 0.345376 \tabularnewline
46 & -0.141351 & -1.0949 & 0.138968 \tabularnewline
47 & -0.015337 & -0.1188 & 0.452914 \tabularnewline
48 & 0.085576 & 0.6629 & 0.254976 \tabularnewline
\hline
\end{tabular}
%Source: https://freestatistics.org/blog/index.php?pk=&T=2

[TABLE]
[ROW][C]Partial Autocorrelation Function[/C][/ROW]
[ROW][C]Time lag k[/C][C]PACF(k)[/C][C]T-STAT[/C][C]P-value[/C][/ROW]
[ROW][C]1[/C][C]0.608525[/C][C]4.7136[/C][C]7e-06[/C][/ROW]
[ROW][C]2[/C][C]0.150591[/C][C]1.1665[/C][C]0.12402[/C][/ROW]
[ROW][C]3[/C][C]-0.324484[/C][C]-2.5134[/C][C]0.007329[/C][/ROW]
[ROW][C]4[/C][C]-0.391281[/C][C]-3.0309[/C][C]0.001798[/C][/ROW]
[ROW][C]5[/C][C]-0.10672[/C][C]-0.8266[/C][C]0.205855[/C][/ROW]
[ROW][C]6[/C][C]-0.010475[/C][C]-0.0811[/C][C]0.467802[/C][/ROW]
[ROW][C]7[/C][C]0.099426[/C][C]0.7702[/C][C]0.222115[/C][/ROW]
[ROW][C]8[/C][C]-0.087346[/C][C]-0.6766[/C][C]0.250638[/C][/ROW]
[ROW][C]9[/C][C]0.161125[/C][C]1.2481[/C][C]0.108427[/C][/ROW]
[ROW][C]10[/C][C]0.018119[/C][C]0.1404[/C][C]0.444426[/C][/ROW]
[ROW][C]11[/C][C]-0.179387[/C][C]-1.3895[/C][C]0.084904[/C][/ROW]
[ROW][C]12[/C][C]0.263794[/C][C]2.0433[/C][C]0.022709[/C][/ROW]
[ROW][C]13[/C][C]-0.267816[/C][C]-2.0745[/C][C]0.021166[/C][/ROW]
[ROW][C]14[/C][C]-0.161363[/C][C]-1.2499[/C][C]0.108093[/C][/ROW]
[ROW][C]15[/C][C]0.059816[/C][C]0.4633[/C][C]0.3224[/C][/ROW]
[ROW][C]16[/C][C]-0.147065[/C][C]-1.1392[/C][C]0.129582[/C][/ROW]
[ROW][C]17[/C][C]-0.046367[/C][C]-0.3592[/C][C]0.36037[/C][/ROW]
[ROW][C]18[/C][C]-0.12865[/C][C]-0.9965[/C][C]0.1615[/C][/ROW]
[ROW][C]19[/C][C]-0.030639[/C][C]-0.2373[/C][C]0.406606[/C][/ROW]
[ROW][C]20[/C][C]0.096533[/C][C]0.7477[/C][C]0.228769[/C][/ROW]
[ROW][C]21[/C][C]0.002186[/C][C]0.0169[/C][C]0.493273[/C][/ROW]
[ROW][C]22[/C][C]0.091962[/C][C]0.7123[/C][C]0.23951[/C][/ROW]
[ROW][C]23[/C][C]-0.109444[/C][C]-0.8478[/C][C]0.199973[/C][/ROW]
[ROW][C]24[/C][C]0.076803[/C][C]0.5949[/C][C]0.27707[/C][/ROW]
[ROW][C]25[/C][C]-0.132736[/C][C]-1.0282[/C][C]0.153998[/C][/ROW]
[ROW][C]26[/C][C]-0.035783[/C][C]-0.2772[/C][C]0.391299[/C][/ROW]
[ROW][C]27[/C][C]0.118751[/C][C]0.9198[/C][C]0.18067[/C][/ROW]
[ROW][C]28[/C][C]0.041185[/C][C]0.319[/C][C]0.37541[/C][/ROW]
[ROW][C]29[/C][C]-0.062029[/C][C]-0.4805[/C][C]0.316319[/C][/ROW]
[ROW][C]30[/C][C]0.048252[/C][C]0.3738[/C][C]0.354952[/C][/ROW]
[ROW][C]31[/C][C]0.035453[/C][C]0.2746[/C][C]0.392278[/C][/ROW]
[ROW][C]32[/C][C]-0.000721[/C][C]-0.0056[/C][C]0.497782[/C][/ROW]
[ROW][C]33[/C][C]-0.065875[/C][C]-0.5103[/C][C]0.305869[/C][/ROW]
[ROW][C]34[/C][C]0.035071[/C][C]0.2717[/C][C]0.393409[/C][/ROW]
[ROW][C]35[/C][C]0.126493[/C][C]0.9798[/C][C]0.165556[/C][/ROW]
[ROW][C]36[/C][C]-0.092776[/C][C]-0.7186[/C][C]0.237575[/C][/ROW]
[ROW][C]37[/C][C]0.085156[/C][C]0.6596[/C][C]0.256012[/C][/ROW]
[ROW][C]38[/C][C]0.023035[/C][C]0.1784[/C][C]0.429495[/C][/ROW]
[ROW][C]39[/C][C]-0.070749[/C][C]-0.548[/C][C]0.292857[/C][/ROW]
[ROW][C]40[/C][C]0.133374[/C][C]1.0331[/C][C]0.152848[/C][/ROW]
[ROW][C]41[/C][C]-0.042549[/C][C]-0.3296[/C][C]0.371431[/C][/ROW]
[ROW][C]42[/C][C]0.048355[/C][C]0.3746[/C][C]0.354656[/C][/ROW]
[ROW][C]43[/C][C]-0.097741[/C][C]-0.7571[/C][C]0.225976[/C][/ROW]
[ROW][C]44[/C][C]-0.035558[/C][C]-0.2754[/C][C]0.391965[/C][/ROW]
[ROW][C]45[/C][C]-0.051609[/C][C]-0.3998[/C][C]0.345376[/C][/ROW]
[ROW][C]46[/C][C]-0.141351[/C][C]-1.0949[/C][C]0.138968[/C][/ROW]
[ROW][C]47[/C][C]-0.015337[/C][C]-0.1188[/C][C]0.452914[/C][/ROW]
[ROW][C]48[/C][C]0.085576[/C][C]0.6629[/C][C]0.254976[/C][/ROW]
[/TABLE]
Source: https://freestatistics.org/blog/index.php?pk=&T=2

Globally Unique Identifier (entire table): ba.freestatistics.org/blog/index.php?pk=&T=2

As an alternative you can also use a QR Code:  

The GUIDs for individual cells are displayed in the table below:

Partial Autocorrelation Function
Time lag kPACF(k)T-STATP-value
10.6085254.71367e-06
20.1505911.16650.12402
3-0.324484-2.51340.007329
4-0.391281-3.03090.001798
5-0.10672-0.82660.205855
6-0.010475-0.08110.467802
70.0994260.77020.222115
8-0.087346-0.67660.250638
90.1611251.24810.108427
100.0181190.14040.444426
11-0.179387-1.38950.084904
120.2637942.04330.022709
13-0.267816-2.07450.021166
14-0.161363-1.24990.108093
150.0598160.46330.3224
16-0.147065-1.13920.129582
17-0.046367-0.35920.36037
18-0.12865-0.99650.1615
19-0.030639-0.23730.406606
200.0965330.74770.228769
210.0021860.01690.493273
220.0919620.71230.23951
23-0.109444-0.84780.199973
240.0768030.59490.27707
25-0.132736-1.02820.153998
26-0.035783-0.27720.391299
270.1187510.91980.18067
280.0411850.3190.37541
29-0.062029-0.48050.316319
300.0482520.37380.354952
310.0354530.27460.392278
32-0.000721-0.00560.497782
33-0.065875-0.51030.305869
340.0350710.27170.393409
350.1264930.97980.165556
36-0.092776-0.71860.237575
370.0851560.65960.256012
380.0230350.17840.429495
39-0.070749-0.5480.292857
400.1333741.03310.152848
41-0.042549-0.32960.371431
420.0483550.37460.354656
43-0.097741-0.75710.225976
44-0.035558-0.27540.391965
45-0.051609-0.39980.345376
46-0.141351-1.09490.138968
47-0.015337-0.11880.452914
480.0855760.66290.254976


Parameters (Session):
par1 = 48 ; par2 = 1 ; par3 = 0 ; par4 = 0 ; par5 = 12 ; par6 = White Noise ; par7 = 0.95 ;
Parameters (R input):
par1 = 48 ; par2 = 1 ; par3 = 0 ; par4 = 0 ; par5 = 12 ; par6 = White Noise ; par7 = 0.95 ; par8 = ;
R code (references can be found in the software module):
if (par1 == 'Default') {
par1 = 10*log10(length(x))
} else {
par1 <- as.numeric(par1)
}
par2 <- as.numeric(par2)
par3 <- as.numeric(par3)
par4 <- as.numeric(par4)
par5 <- as.numeric(par5)
if (par6 == 'White Noise') par6 <- 'white' else par6 <- 'ma'
par7 <- as.numeric(par7)
if (par8 != '') par8 <- as.numeric(par8)
x <- na.omit(x)
ox <- x
if (par8 == '') {
if (par2 == 0) {
x <- log(x)
} else {
x <- (x ^ par2 - 1) / par2
}
} else {
x <- log(x,base=par8)
}
if (par3 > 0) x <- diff(x,lag=1,difference=par3)
if (par4 > 0) x <- diff(x,lag=par5,difference=par4)
bitmap(file='picts.png')
op <- par(mfrow=c(2,1))
plot(ox,type='l',main='Original Time Series',xlab='time',ylab='value')
if (par8=='') {
mytitle <- paste('Working Time Series (lambda=',par2,', d=',par3,', D=',par4,')',sep='')
mysub <- paste('(lambda=',par2,', d=',par3,', D=',par4,', CI=', par7, ', CI type=',par6,')',sep='')
} else {
mytitle <- paste('Working Time Series (base=',par8,', d=',par3,', D=',par4,')',sep='')
mysub <- paste('(base=',par8,', d=',par3,', D=',par4,', CI=', par7, ', CI type=',par6,')',sep='')
}
plot(x,type='l', main=mytitle,xlab='time',ylab='value')
par(op)
dev.off()
bitmap(file='pic1.png')
racf <- acf(x, par1, main='Autocorrelation', xlab='time lag', ylab='ACF', ci.type=par6, ci=par7, sub=mysub)
dev.off()
bitmap(file='pic2.png')
rpacf <- pacf(x,par1,main='Partial Autocorrelation',xlab='lags',ylab='PACF',sub=mysub)
dev.off()
(myacf <- c(racf$acf))
(mypacf <- c(rpacf$acf))
lengthx <- length(x)
sqrtn <- sqrt(lengthx)
load(file='createtable')
a<-table.start()
a<-table.row.start(a)
a<-table.element(a,'Autocorrelation Function',4,TRUE)
a<-table.row.end(a)
a<-table.row.start(a)
a<-table.element(a,'Time lag k',header=TRUE)
a<-table.element(a,hyperlink('basics.htm','ACF(k)','click here for more information about the Autocorrelation Function'),header=TRUE)
a<-table.element(a,'T-STAT',header=TRUE)
a<-table.element(a,'P-value',header=TRUE)
a<-table.row.end(a)
for (i in 2:(par1+1)) {
a<-table.row.start(a)
a<-table.element(a,i-1,header=TRUE)
a<-table.element(a,round(myacf[i],6))
mytstat <- myacf[i]*sqrtn
a<-table.element(a,round(mytstat,4))
a<-table.element(a,round(1-pt(abs(mytstat),lengthx),6))
a<-table.row.end(a)
}
a<-table.end(a)
table.save(a,file='mytable.tab')
a<-table.start()
a<-table.row.start(a)
a<-table.element(a,'Partial Autocorrelation Function',4,TRUE)
a<-table.row.end(a)
a<-table.row.start(a)
a<-table.element(a,'Time lag k',header=TRUE)
a<-table.element(a,hyperlink('basics.htm','PACF(k)','click here for more information about the Partial Autocorrelation Function'),header=TRUE)
a<-table.element(a,'T-STAT',header=TRUE)
a<-table.element(a,'P-value',header=TRUE)
a<-table.row.end(a)
for (i in 1:par1) {
a<-table.row.start(a)
a<-table.element(a,i,header=TRUE)
a<-table.element(a,round(mypacf[i],6))
mytstat <- mypacf[i]*sqrtn
a<-table.element(a,round(mytstat,4))
a<-table.element(a,round(1-pt(abs(mytstat),lengthx),6))
a<-table.row.end(a)
}
a<-table.end(a)
table.save(a,file='mytable1.tab')