Free Statistics

of Irreproducible Research!

Author's title

Author*Unverified author*
R Software Modulerwasp_autocorrelation.wasp
Title produced by software(Partial) Autocorrelation Function
Date of computationThu, 20 Oct 2016 18:38:12 +0100
Cite this page as followsStatistical Computations at FreeStatistics.org, Office for Research Development and Education, URL https://freestatistics.org/blog/index.php?v=date/2016/Oct/20/t1476985143zw5qwi85ugon262.htm/, Retrieved Sun, 05 May 2024 09:21:10 +0200
Statistical Computations at FreeStatistics.org, Office for Research Development and Education, URL https://freestatistics.org/blog/index.php?pk=, Retrieved Sun, 05 May 2024 09:21:10 +0200
QR Codes:

Original text written by user:
IsPrivate?No (this computation is public)
User-defined keywords
Estimated Impact0
Dataseries X:
467
475
470
442
433
427
410
406
429
425
431
408
454
459
441
420
416
400
401
398
442
458
476
447
511
514
513
511
498
490
495
486
530
539
555
548
615
634
645
634
630
635
642
637
675
679
676
660
716
730
717
694
670
641
626
604
630
634
635
619
674
664
653
635
614
595
580
570
608
617
591
565


Summary of computational transaction
Raw Inputview raw input (R code)
Raw Outputview raw output of R engine
Computing time1 seconds
R Server'Gwilym Jenkins' @ jenkins.wessa.net

\begin{tabular}{lllllllll}
\hline
Summary of computational transaction \tabularnewline
Raw Input & view raw input (R code)  \tabularnewline
Raw Output & view raw output of R engine  \tabularnewline
Computing time & 1 seconds \tabularnewline
R Server & 'Gwilym Jenkins' @ jenkins.wessa.net \tabularnewline
\hline
\end{tabular}
%Source: https://freestatistics.org/blog/index.php?pk=&T=0

[TABLE]
[ROW][C]Summary of computational transaction[/C][/ROW]
[ROW][C]Raw Input[/C][C]view raw input (R code) [/C][/ROW]
[ROW][C]Raw Output[/C][C]view raw output of R engine [/C][/ROW]
[ROW][C]Computing time[/C][C]1 seconds[/C][/ROW]
[ROW][C]R Server[/C][C]'Gwilym Jenkins' @ jenkins.wessa.net[/C][/ROW]
[/TABLE]
Source: https://freestatistics.org/blog/index.php?pk=&T=0

Globally Unique Identifier (entire table): ba.freestatistics.org/blog/index.php?pk=&T=0

As an alternative you can also use a QR Code:  

The GUIDs for individual cells are displayed in the table below:

Summary of computational transaction
Raw Inputview raw input (R code)
Raw Outputview raw output of R engine
Computing time1 seconds
R Server'Gwilym Jenkins' @ jenkins.wessa.net


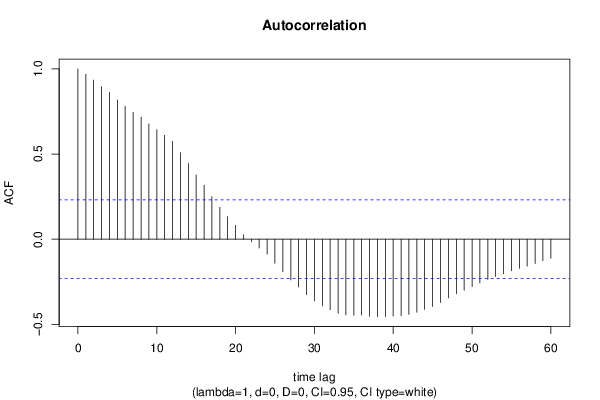
Autocorrelation Function
Time lag kACF(k)T-STATP-value
10.9680788.21440
20.9344257.92890
30.8964637.60670
40.8627747.32090
50.8180146.94110
60.7813336.62980
70.745276.32380
80.7168016.08230
90.6763795.73930
100.6431195.4570
110.6106885.18191e-06
120.5750814.87973e-06
130.5083844.31382.5e-05
140.4449063.77520.000163
150.3776543.20450.001009
160.3168312.68840.004457
170.2493352.11570.018916
180.1878661.59410.057647
190.1317211.11770.133708
200.0815510.6920.245587
210.0269180.22840.409988
22-0.015098-0.12810.44921
23-0.051262-0.4350.332441
24-0.087305-0.74080.230609
25-0.140146-1.18920.119139
26-0.190021-1.61240.055627
27-0.238792-2.02620.023224
28-0.279716-2.37350.010146
29-0.325071-2.75830.00368
30-0.36198-3.07150.001502
31-0.391339-3.32060.000706
32-0.413538-3.5090.00039
33-0.434277-3.6850.00022
34-0.444359-3.77050.000166
35-0.446001-3.78440.000158
36-0.444691-3.77330.000164
37-0.452138-3.83650.000133
38-0.454564-3.85710.000124
39-0.454249-3.85440.000125
40-0.450409-3.82180.000139
41-0.448595-3.80650.000147
42-0.441157-3.74330.000181
43-0.428444-3.63550.000259
44-0.411881-3.49490.000408
45-0.395373-3.35480.000635
46-0.371749-3.15440.001173
47-0.344497-2.92320.002314
48-0.320313-2.71790.004112
49-0.299667-2.54280.006574
50-0.2779-2.35810.010545
51-0.257414-2.18420.016102
52-0.236575-2.00740.02423
53-0.219278-1.86060.03344
54-0.203019-1.72270.04462
55-0.185408-1.57320.060023
56-0.171205-1.45270.075323
57-0.158021-1.34090.092091
58-0.142681-1.21070.114987
59-0.126017-1.06930.144255
60-0.111954-0.950.172654

\begin{tabular}{lllllllll}
\hline
Autocorrelation Function \tabularnewline
Time lag k & ACF(k) & T-STAT & P-value \tabularnewline
1 & 0.968078 & 8.2144 & 0 \tabularnewline
2 & 0.934425 & 7.9289 & 0 \tabularnewline
3 & 0.896463 & 7.6067 & 0 \tabularnewline
4 & 0.862774 & 7.3209 & 0 \tabularnewline
5 & 0.818014 & 6.9411 & 0 \tabularnewline
6 & 0.781333 & 6.6298 & 0 \tabularnewline
7 & 0.74527 & 6.3238 & 0 \tabularnewline
8 & 0.716801 & 6.0823 & 0 \tabularnewline
9 & 0.676379 & 5.7393 & 0 \tabularnewline
10 & 0.643119 & 5.457 & 0 \tabularnewline
11 & 0.610688 & 5.1819 & 1e-06 \tabularnewline
12 & 0.575081 & 4.8797 & 3e-06 \tabularnewline
13 & 0.508384 & 4.3138 & 2.5e-05 \tabularnewline
14 & 0.444906 & 3.7752 & 0.000163 \tabularnewline
15 & 0.377654 & 3.2045 & 0.001009 \tabularnewline
16 & 0.316831 & 2.6884 & 0.004457 \tabularnewline
17 & 0.249335 & 2.1157 & 0.018916 \tabularnewline
18 & 0.187866 & 1.5941 & 0.057647 \tabularnewline
19 & 0.131721 & 1.1177 & 0.133708 \tabularnewline
20 & 0.081551 & 0.692 & 0.245587 \tabularnewline
21 & 0.026918 & 0.2284 & 0.409988 \tabularnewline
22 & -0.015098 & -0.1281 & 0.44921 \tabularnewline
23 & -0.051262 & -0.435 & 0.332441 \tabularnewline
24 & -0.087305 & -0.7408 & 0.230609 \tabularnewline
25 & -0.140146 & -1.1892 & 0.119139 \tabularnewline
26 & -0.190021 & -1.6124 & 0.055627 \tabularnewline
27 & -0.238792 & -2.0262 & 0.023224 \tabularnewline
28 & -0.279716 & -2.3735 & 0.010146 \tabularnewline
29 & -0.325071 & -2.7583 & 0.00368 \tabularnewline
30 & -0.36198 & -3.0715 & 0.001502 \tabularnewline
31 & -0.391339 & -3.3206 & 0.000706 \tabularnewline
32 & -0.413538 & -3.509 & 0.00039 \tabularnewline
33 & -0.434277 & -3.685 & 0.00022 \tabularnewline
34 & -0.444359 & -3.7705 & 0.000166 \tabularnewline
35 & -0.446001 & -3.7844 & 0.000158 \tabularnewline
36 & -0.444691 & -3.7733 & 0.000164 \tabularnewline
37 & -0.452138 & -3.8365 & 0.000133 \tabularnewline
38 & -0.454564 & -3.8571 & 0.000124 \tabularnewline
39 & -0.454249 & -3.8544 & 0.000125 \tabularnewline
40 & -0.450409 & -3.8218 & 0.000139 \tabularnewline
41 & -0.448595 & -3.8065 & 0.000147 \tabularnewline
42 & -0.441157 & -3.7433 & 0.000181 \tabularnewline
43 & -0.428444 & -3.6355 & 0.000259 \tabularnewline
44 & -0.411881 & -3.4949 & 0.000408 \tabularnewline
45 & -0.395373 & -3.3548 & 0.000635 \tabularnewline
46 & -0.371749 & -3.1544 & 0.001173 \tabularnewline
47 & -0.344497 & -2.9232 & 0.002314 \tabularnewline
48 & -0.320313 & -2.7179 & 0.004112 \tabularnewline
49 & -0.299667 & -2.5428 & 0.006574 \tabularnewline
50 & -0.2779 & -2.3581 & 0.010545 \tabularnewline
51 & -0.257414 & -2.1842 & 0.016102 \tabularnewline
52 & -0.236575 & -2.0074 & 0.02423 \tabularnewline
53 & -0.219278 & -1.8606 & 0.03344 \tabularnewline
54 & -0.203019 & -1.7227 & 0.04462 \tabularnewline
55 & -0.185408 & -1.5732 & 0.060023 \tabularnewline
56 & -0.171205 & -1.4527 & 0.075323 \tabularnewline
57 & -0.158021 & -1.3409 & 0.092091 \tabularnewline
58 & -0.142681 & -1.2107 & 0.114987 \tabularnewline
59 & -0.126017 & -1.0693 & 0.144255 \tabularnewline
60 & -0.111954 & -0.95 & 0.172654 \tabularnewline
\hline
\end{tabular}
%Source: https://freestatistics.org/blog/index.php?pk=&T=1

[TABLE]
[ROW][C]Autocorrelation Function[/C][/ROW]
[ROW][C]Time lag k[/C][C]ACF(k)[/C][C]T-STAT[/C][C]P-value[/C][/ROW]
[ROW][C]1[/C][C]0.968078[/C][C]8.2144[/C][C]0[/C][/ROW]
[ROW][C]2[/C][C]0.934425[/C][C]7.9289[/C][C]0[/C][/ROW]
[ROW][C]3[/C][C]0.896463[/C][C]7.6067[/C][C]0[/C][/ROW]
[ROW][C]4[/C][C]0.862774[/C][C]7.3209[/C][C]0[/C][/ROW]
[ROW][C]5[/C][C]0.818014[/C][C]6.9411[/C][C]0[/C][/ROW]
[ROW][C]6[/C][C]0.781333[/C][C]6.6298[/C][C]0[/C][/ROW]
[ROW][C]7[/C][C]0.74527[/C][C]6.3238[/C][C]0[/C][/ROW]
[ROW][C]8[/C][C]0.716801[/C][C]6.0823[/C][C]0[/C][/ROW]
[ROW][C]9[/C][C]0.676379[/C][C]5.7393[/C][C]0[/C][/ROW]
[ROW][C]10[/C][C]0.643119[/C][C]5.457[/C][C]0[/C][/ROW]
[ROW][C]11[/C][C]0.610688[/C][C]5.1819[/C][C]1e-06[/C][/ROW]
[ROW][C]12[/C][C]0.575081[/C][C]4.8797[/C][C]3e-06[/C][/ROW]
[ROW][C]13[/C][C]0.508384[/C][C]4.3138[/C][C]2.5e-05[/C][/ROW]
[ROW][C]14[/C][C]0.444906[/C][C]3.7752[/C][C]0.000163[/C][/ROW]
[ROW][C]15[/C][C]0.377654[/C][C]3.2045[/C][C]0.001009[/C][/ROW]
[ROW][C]16[/C][C]0.316831[/C][C]2.6884[/C][C]0.004457[/C][/ROW]
[ROW][C]17[/C][C]0.249335[/C][C]2.1157[/C][C]0.018916[/C][/ROW]
[ROW][C]18[/C][C]0.187866[/C][C]1.5941[/C][C]0.057647[/C][/ROW]
[ROW][C]19[/C][C]0.131721[/C][C]1.1177[/C][C]0.133708[/C][/ROW]
[ROW][C]20[/C][C]0.081551[/C][C]0.692[/C][C]0.245587[/C][/ROW]
[ROW][C]21[/C][C]0.026918[/C][C]0.2284[/C][C]0.409988[/C][/ROW]
[ROW][C]22[/C][C]-0.015098[/C][C]-0.1281[/C][C]0.44921[/C][/ROW]
[ROW][C]23[/C][C]-0.051262[/C][C]-0.435[/C][C]0.332441[/C][/ROW]
[ROW][C]24[/C][C]-0.087305[/C][C]-0.7408[/C][C]0.230609[/C][/ROW]
[ROW][C]25[/C][C]-0.140146[/C][C]-1.1892[/C][C]0.119139[/C][/ROW]
[ROW][C]26[/C][C]-0.190021[/C][C]-1.6124[/C][C]0.055627[/C][/ROW]
[ROW][C]27[/C][C]-0.238792[/C][C]-2.0262[/C][C]0.023224[/C][/ROW]
[ROW][C]28[/C][C]-0.279716[/C][C]-2.3735[/C][C]0.010146[/C][/ROW]
[ROW][C]29[/C][C]-0.325071[/C][C]-2.7583[/C][C]0.00368[/C][/ROW]
[ROW][C]30[/C][C]-0.36198[/C][C]-3.0715[/C][C]0.001502[/C][/ROW]
[ROW][C]31[/C][C]-0.391339[/C][C]-3.3206[/C][C]0.000706[/C][/ROW]
[ROW][C]32[/C][C]-0.413538[/C][C]-3.509[/C][C]0.00039[/C][/ROW]
[ROW][C]33[/C][C]-0.434277[/C][C]-3.685[/C][C]0.00022[/C][/ROW]
[ROW][C]34[/C][C]-0.444359[/C][C]-3.7705[/C][C]0.000166[/C][/ROW]
[ROW][C]35[/C][C]-0.446001[/C][C]-3.7844[/C][C]0.000158[/C][/ROW]
[ROW][C]36[/C][C]-0.444691[/C][C]-3.7733[/C][C]0.000164[/C][/ROW]
[ROW][C]37[/C][C]-0.452138[/C][C]-3.8365[/C][C]0.000133[/C][/ROW]
[ROW][C]38[/C][C]-0.454564[/C][C]-3.8571[/C][C]0.000124[/C][/ROW]
[ROW][C]39[/C][C]-0.454249[/C][C]-3.8544[/C][C]0.000125[/C][/ROW]
[ROW][C]40[/C][C]-0.450409[/C][C]-3.8218[/C][C]0.000139[/C][/ROW]
[ROW][C]41[/C][C]-0.448595[/C][C]-3.8065[/C][C]0.000147[/C][/ROW]
[ROW][C]42[/C][C]-0.441157[/C][C]-3.7433[/C][C]0.000181[/C][/ROW]
[ROW][C]43[/C][C]-0.428444[/C][C]-3.6355[/C][C]0.000259[/C][/ROW]
[ROW][C]44[/C][C]-0.411881[/C][C]-3.4949[/C][C]0.000408[/C][/ROW]
[ROW][C]45[/C][C]-0.395373[/C][C]-3.3548[/C][C]0.000635[/C][/ROW]
[ROW][C]46[/C][C]-0.371749[/C][C]-3.1544[/C][C]0.001173[/C][/ROW]
[ROW][C]47[/C][C]-0.344497[/C][C]-2.9232[/C][C]0.002314[/C][/ROW]
[ROW][C]48[/C][C]-0.320313[/C][C]-2.7179[/C][C]0.004112[/C][/ROW]
[ROW][C]49[/C][C]-0.299667[/C][C]-2.5428[/C][C]0.006574[/C][/ROW]
[ROW][C]50[/C][C]-0.2779[/C][C]-2.3581[/C][C]0.010545[/C][/ROW]
[ROW][C]51[/C][C]-0.257414[/C][C]-2.1842[/C][C]0.016102[/C][/ROW]
[ROW][C]52[/C][C]-0.236575[/C][C]-2.0074[/C][C]0.02423[/C][/ROW]
[ROW][C]53[/C][C]-0.219278[/C][C]-1.8606[/C][C]0.03344[/C][/ROW]
[ROW][C]54[/C][C]-0.203019[/C][C]-1.7227[/C][C]0.04462[/C][/ROW]
[ROW][C]55[/C][C]-0.185408[/C][C]-1.5732[/C][C]0.060023[/C][/ROW]
[ROW][C]56[/C][C]-0.171205[/C][C]-1.4527[/C][C]0.075323[/C][/ROW]
[ROW][C]57[/C][C]-0.158021[/C][C]-1.3409[/C][C]0.092091[/C][/ROW]
[ROW][C]58[/C][C]-0.142681[/C][C]-1.2107[/C][C]0.114987[/C][/ROW]
[ROW][C]59[/C][C]-0.126017[/C][C]-1.0693[/C][C]0.144255[/C][/ROW]
[ROW][C]60[/C][C]-0.111954[/C][C]-0.95[/C][C]0.172654[/C][/ROW]
[/TABLE]
Source: https://freestatistics.org/blog/index.php?pk=&T=1

Globally Unique Identifier (entire table): ba.freestatistics.org/blog/index.php?pk=&T=1

As an alternative you can also use a QR Code:  

The GUIDs for individual cells are displayed in the table below:

Autocorrelation Function
Time lag kACF(k)T-STATP-value
10.9680788.21440
20.9344257.92890
30.8964637.60670
40.8627747.32090
50.8180146.94110
60.7813336.62980
70.745276.32380
80.7168016.08230
90.6763795.73930
100.6431195.4570
110.6106885.18191e-06
120.5750814.87973e-06
130.5083844.31382.5e-05
140.4449063.77520.000163
150.3776543.20450.001009
160.3168312.68840.004457
170.2493352.11570.018916
180.1878661.59410.057647
190.1317211.11770.133708
200.0815510.6920.245587
210.0269180.22840.409988
22-0.015098-0.12810.44921
23-0.051262-0.4350.332441
24-0.087305-0.74080.230609
25-0.140146-1.18920.119139
26-0.190021-1.61240.055627
27-0.238792-2.02620.023224
28-0.279716-2.37350.010146
29-0.325071-2.75830.00368
30-0.36198-3.07150.001502
31-0.391339-3.32060.000706
32-0.413538-3.5090.00039
33-0.434277-3.6850.00022
34-0.444359-3.77050.000166
35-0.446001-3.78440.000158
36-0.444691-3.77330.000164
37-0.452138-3.83650.000133
38-0.454564-3.85710.000124
39-0.454249-3.85440.000125
40-0.450409-3.82180.000139
41-0.448595-3.80650.000147
42-0.441157-3.74330.000181
43-0.428444-3.63550.000259
44-0.411881-3.49490.000408
45-0.395373-3.35480.000635
46-0.371749-3.15440.001173
47-0.344497-2.92320.002314
48-0.320313-2.71790.004112
49-0.299667-2.54280.006574
50-0.2779-2.35810.010545
51-0.257414-2.18420.016102
52-0.236575-2.00740.02423
53-0.219278-1.86060.03344
54-0.203019-1.72270.04462
55-0.185408-1.57320.060023
56-0.171205-1.45270.075323
57-0.158021-1.34090.092091
58-0.142681-1.21070.114987
59-0.126017-1.06930.144255
60-0.111954-0.950.172654


Partial Autocorrelation Function
Time lag kPACF(k)T-STATP-value
10.9680788.21440
2-0.043767-0.37140.355723
3-0.085397-0.72460.235518
40.0519320.44070.33039
5-0.195562-1.65940.050693
60.1124760.95440.171539
70.0039280.03330.486751
80.064680.54880.292411
9-0.182707-1.55030.062724
100.0676630.57410.283831
110.0200620.17020.432653
12-0.14276-1.21140.11486
13-0.471102-3.99747.7e-05
140.0065880.05590.477788
15-0.062653-0.53160.298311
160.0214380.18190.428082
17-0.025508-0.21640.414628
18-0.100275-0.85090.198833
190.03770.31990.374989
20-0.04574-0.38810.349536
210.0297270.25220.400787
220.0623750.52930.299123
230.0377960.32070.37468
24-0.016496-0.140.444536
25-0.107475-0.9120.182418
26-0.044861-0.38070.352288
270.0143020.12140.451874
280.0328440.27870.390642
29-0.031052-0.26350.396465
300.0032210.02730.489136
310.0125010.10610.45791
320.0391260.3320.370429
330.0394910.33510.369265
34-0.033948-0.28810.387063
350.0469570.39840.345741
360.0174070.14770.441496
370.0162120.13760.445483
380.0516310.43810.331313
39-0.007587-0.06440.474426
40-0.03573-0.30320.381313
410.0238370.20230.420139
42-0.013033-0.11060.456124
430.0114610.09730.461398
44-0.012272-0.10410.458676
45-0.028932-0.24550.403386
46-0.007998-0.06790.473041
47-0.084617-0.7180.237542
48-0.077924-0.66120.255295
490.0579460.49170.312219
50-0.042693-0.36230.359109
51-0.051565-0.43750.331514
52-0.010799-0.09160.463621
53-0.032453-0.27540.391908
54-0.067529-0.5730.284215
55-0.036334-0.30830.379372
56-0.086907-0.73740.231628
57-0.021623-0.18350.427471
58-0.037491-0.31810.375656
590.010720.0910.463888
600.0066450.05640.477595

\begin{tabular}{lllllllll}
\hline
Partial Autocorrelation Function \tabularnewline
Time lag k & PACF(k) & T-STAT & P-value \tabularnewline
1 & 0.968078 & 8.2144 & 0 \tabularnewline
2 & -0.043767 & -0.3714 & 0.355723 \tabularnewline
3 & -0.085397 & -0.7246 & 0.235518 \tabularnewline
4 & 0.051932 & 0.4407 & 0.33039 \tabularnewline
5 & -0.195562 & -1.6594 & 0.050693 \tabularnewline
6 & 0.112476 & 0.9544 & 0.171539 \tabularnewline
7 & 0.003928 & 0.0333 & 0.486751 \tabularnewline
8 & 0.06468 & 0.5488 & 0.292411 \tabularnewline
9 & -0.182707 & -1.5503 & 0.062724 \tabularnewline
10 & 0.067663 & 0.5741 & 0.283831 \tabularnewline
11 & 0.020062 & 0.1702 & 0.432653 \tabularnewline
12 & -0.14276 & -1.2114 & 0.11486 \tabularnewline
13 & -0.471102 & -3.9974 & 7.7e-05 \tabularnewline
14 & 0.006588 & 0.0559 & 0.477788 \tabularnewline
15 & -0.062653 & -0.5316 & 0.298311 \tabularnewline
16 & 0.021438 & 0.1819 & 0.428082 \tabularnewline
17 & -0.025508 & -0.2164 & 0.414628 \tabularnewline
18 & -0.100275 & -0.8509 & 0.198833 \tabularnewline
19 & 0.0377 & 0.3199 & 0.374989 \tabularnewline
20 & -0.04574 & -0.3881 & 0.349536 \tabularnewline
21 & 0.029727 & 0.2522 & 0.400787 \tabularnewline
22 & 0.062375 & 0.5293 & 0.299123 \tabularnewline
23 & 0.037796 & 0.3207 & 0.37468 \tabularnewline
24 & -0.016496 & -0.14 & 0.444536 \tabularnewline
25 & -0.107475 & -0.912 & 0.182418 \tabularnewline
26 & -0.044861 & -0.3807 & 0.352288 \tabularnewline
27 & 0.014302 & 0.1214 & 0.451874 \tabularnewline
28 & 0.032844 & 0.2787 & 0.390642 \tabularnewline
29 & -0.031052 & -0.2635 & 0.396465 \tabularnewline
30 & 0.003221 & 0.0273 & 0.489136 \tabularnewline
31 & 0.012501 & 0.1061 & 0.45791 \tabularnewline
32 & 0.039126 & 0.332 & 0.370429 \tabularnewline
33 & 0.039491 & 0.3351 & 0.369265 \tabularnewline
34 & -0.033948 & -0.2881 & 0.387063 \tabularnewline
35 & 0.046957 & 0.3984 & 0.345741 \tabularnewline
36 & 0.017407 & 0.1477 & 0.441496 \tabularnewline
37 & 0.016212 & 0.1376 & 0.445483 \tabularnewline
38 & 0.051631 & 0.4381 & 0.331313 \tabularnewline
39 & -0.007587 & -0.0644 & 0.474426 \tabularnewline
40 & -0.03573 & -0.3032 & 0.381313 \tabularnewline
41 & 0.023837 & 0.2023 & 0.420139 \tabularnewline
42 & -0.013033 & -0.1106 & 0.456124 \tabularnewline
43 & 0.011461 & 0.0973 & 0.461398 \tabularnewline
44 & -0.012272 & -0.1041 & 0.458676 \tabularnewline
45 & -0.028932 & -0.2455 & 0.403386 \tabularnewline
46 & -0.007998 & -0.0679 & 0.473041 \tabularnewline
47 & -0.084617 & -0.718 & 0.237542 \tabularnewline
48 & -0.077924 & -0.6612 & 0.255295 \tabularnewline
49 & 0.057946 & 0.4917 & 0.312219 \tabularnewline
50 & -0.042693 & -0.3623 & 0.359109 \tabularnewline
51 & -0.051565 & -0.4375 & 0.331514 \tabularnewline
52 & -0.010799 & -0.0916 & 0.463621 \tabularnewline
53 & -0.032453 & -0.2754 & 0.391908 \tabularnewline
54 & -0.067529 & -0.573 & 0.284215 \tabularnewline
55 & -0.036334 & -0.3083 & 0.379372 \tabularnewline
56 & -0.086907 & -0.7374 & 0.231628 \tabularnewline
57 & -0.021623 & -0.1835 & 0.427471 \tabularnewline
58 & -0.037491 & -0.3181 & 0.375656 \tabularnewline
59 & 0.01072 & 0.091 & 0.463888 \tabularnewline
60 & 0.006645 & 0.0564 & 0.477595 \tabularnewline
\hline
\end{tabular}
%Source: https://freestatistics.org/blog/index.php?pk=&T=2

[TABLE]
[ROW][C]Partial Autocorrelation Function[/C][/ROW]
[ROW][C]Time lag k[/C][C]PACF(k)[/C][C]T-STAT[/C][C]P-value[/C][/ROW]
[ROW][C]1[/C][C]0.968078[/C][C]8.2144[/C][C]0[/C][/ROW]
[ROW][C]2[/C][C]-0.043767[/C][C]-0.3714[/C][C]0.355723[/C][/ROW]
[ROW][C]3[/C][C]-0.085397[/C][C]-0.7246[/C][C]0.235518[/C][/ROW]
[ROW][C]4[/C][C]0.051932[/C][C]0.4407[/C][C]0.33039[/C][/ROW]
[ROW][C]5[/C][C]-0.195562[/C][C]-1.6594[/C][C]0.050693[/C][/ROW]
[ROW][C]6[/C][C]0.112476[/C][C]0.9544[/C][C]0.171539[/C][/ROW]
[ROW][C]7[/C][C]0.003928[/C][C]0.0333[/C][C]0.486751[/C][/ROW]
[ROW][C]8[/C][C]0.06468[/C][C]0.5488[/C][C]0.292411[/C][/ROW]
[ROW][C]9[/C][C]-0.182707[/C][C]-1.5503[/C][C]0.062724[/C][/ROW]
[ROW][C]10[/C][C]0.067663[/C][C]0.5741[/C][C]0.283831[/C][/ROW]
[ROW][C]11[/C][C]0.020062[/C][C]0.1702[/C][C]0.432653[/C][/ROW]
[ROW][C]12[/C][C]-0.14276[/C][C]-1.2114[/C][C]0.11486[/C][/ROW]
[ROW][C]13[/C][C]-0.471102[/C][C]-3.9974[/C][C]7.7e-05[/C][/ROW]
[ROW][C]14[/C][C]0.006588[/C][C]0.0559[/C][C]0.477788[/C][/ROW]
[ROW][C]15[/C][C]-0.062653[/C][C]-0.5316[/C][C]0.298311[/C][/ROW]
[ROW][C]16[/C][C]0.021438[/C][C]0.1819[/C][C]0.428082[/C][/ROW]
[ROW][C]17[/C][C]-0.025508[/C][C]-0.2164[/C][C]0.414628[/C][/ROW]
[ROW][C]18[/C][C]-0.100275[/C][C]-0.8509[/C][C]0.198833[/C][/ROW]
[ROW][C]19[/C][C]0.0377[/C][C]0.3199[/C][C]0.374989[/C][/ROW]
[ROW][C]20[/C][C]-0.04574[/C][C]-0.3881[/C][C]0.349536[/C][/ROW]
[ROW][C]21[/C][C]0.029727[/C][C]0.2522[/C][C]0.400787[/C][/ROW]
[ROW][C]22[/C][C]0.062375[/C][C]0.5293[/C][C]0.299123[/C][/ROW]
[ROW][C]23[/C][C]0.037796[/C][C]0.3207[/C][C]0.37468[/C][/ROW]
[ROW][C]24[/C][C]-0.016496[/C][C]-0.14[/C][C]0.444536[/C][/ROW]
[ROW][C]25[/C][C]-0.107475[/C][C]-0.912[/C][C]0.182418[/C][/ROW]
[ROW][C]26[/C][C]-0.044861[/C][C]-0.3807[/C][C]0.352288[/C][/ROW]
[ROW][C]27[/C][C]0.014302[/C][C]0.1214[/C][C]0.451874[/C][/ROW]
[ROW][C]28[/C][C]0.032844[/C][C]0.2787[/C][C]0.390642[/C][/ROW]
[ROW][C]29[/C][C]-0.031052[/C][C]-0.2635[/C][C]0.396465[/C][/ROW]
[ROW][C]30[/C][C]0.003221[/C][C]0.0273[/C][C]0.489136[/C][/ROW]
[ROW][C]31[/C][C]0.012501[/C][C]0.1061[/C][C]0.45791[/C][/ROW]
[ROW][C]32[/C][C]0.039126[/C][C]0.332[/C][C]0.370429[/C][/ROW]
[ROW][C]33[/C][C]0.039491[/C][C]0.3351[/C][C]0.369265[/C][/ROW]
[ROW][C]34[/C][C]-0.033948[/C][C]-0.2881[/C][C]0.387063[/C][/ROW]
[ROW][C]35[/C][C]0.046957[/C][C]0.3984[/C][C]0.345741[/C][/ROW]
[ROW][C]36[/C][C]0.017407[/C][C]0.1477[/C][C]0.441496[/C][/ROW]
[ROW][C]37[/C][C]0.016212[/C][C]0.1376[/C][C]0.445483[/C][/ROW]
[ROW][C]38[/C][C]0.051631[/C][C]0.4381[/C][C]0.331313[/C][/ROW]
[ROW][C]39[/C][C]-0.007587[/C][C]-0.0644[/C][C]0.474426[/C][/ROW]
[ROW][C]40[/C][C]-0.03573[/C][C]-0.3032[/C][C]0.381313[/C][/ROW]
[ROW][C]41[/C][C]0.023837[/C][C]0.2023[/C][C]0.420139[/C][/ROW]
[ROW][C]42[/C][C]-0.013033[/C][C]-0.1106[/C][C]0.456124[/C][/ROW]
[ROW][C]43[/C][C]0.011461[/C][C]0.0973[/C][C]0.461398[/C][/ROW]
[ROW][C]44[/C][C]-0.012272[/C][C]-0.1041[/C][C]0.458676[/C][/ROW]
[ROW][C]45[/C][C]-0.028932[/C][C]-0.2455[/C][C]0.403386[/C][/ROW]
[ROW][C]46[/C][C]-0.007998[/C][C]-0.0679[/C][C]0.473041[/C][/ROW]
[ROW][C]47[/C][C]-0.084617[/C][C]-0.718[/C][C]0.237542[/C][/ROW]
[ROW][C]48[/C][C]-0.077924[/C][C]-0.6612[/C][C]0.255295[/C][/ROW]
[ROW][C]49[/C][C]0.057946[/C][C]0.4917[/C][C]0.312219[/C][/ROW]
[ROW][C]50[/C][C]-0.042693[/C][C]-0.3623[/C][C]0.359109[/C][/ROW]
[ROW][C]51[/C][C]-0.051565[/C][C]-0.4375[/C][C]0.331514[/C][/ROW]
[ROW][C]52[/C][C]-0.010799[/C][C]-0.0916[/C][C]0.463621[/C][/ROW]
[ROW][C]53[/C][C]-0.032453[/C][C]-0.2754[/C][C]0.391908[/C][/ROW]
[ROW][C]54[/C][C]-0.067529[/C][C]-0.573[/C][C]0.284215[/C][/ROW]
[ROW][C]55[/C][C]-0.036334[/C][C]-0.3083[/C][C]0.379372[/C][/ROW]
[ROW][C]56[/C][C]-0.086907[/C][C]-0.7374[/C][C]0.231628[/C][/ROW]
[ROW][C]57[/C][C]-0.021623[/C][C]-0.1835[/C][C]0.427471[/C][/ROW]
[ROW][C]58[/C][C]-0.037491[/C][C]-0.3181[/C][C]0.375656[/C][/ROW]
[ROW][C]59[/C][C]0.01072[/C][C]0.091[/C][C]0.463888[/C][/ROW]
[ROW][C]60[/C][C]0.006645[/C][C]0.0564[/C][C]0.477595[/C][/ROW]
[/TABLE]
Source: https://freestatistics.org/blog/index.php?pk=&T=2

Globally Unique Identifier (entire table): ba.freestatistics.org/blog/index.php?pk=&T=2

As an alternative you can also use a QR Code:  

The GUIDs for individual cells are displayed in the table below:

Partial Autocorrelation Function
Time lag kPACF(k)T-STATP-value
10.9680788.21440
2-0.043767-0.37140.355723
3-0.085397-0.72460.235518
40.0519320.44070.33039
5-0.195562-1.65940.050693
60.1124760.95440.171539
70.0039280.03330.486751
80.064680.54880.292411
9-0.182707-1.55030.062724
100.0676630.57410.283831
110.0200620.17020.432653
12-0.14276-1.21140.11486
13-0.471102-3.99747.7e-05
140.0065880.05590.477788
15-0.062653-0.53160.298311
160.0214380.18190.428082
17-0.025508-0.21640.414628
18-0.100275-0.85090.198833
190.03770.31990.374989
20-0.04574-0.38810.349536
210.0297270.25220.400787
220.0623750.52930.299123
230.0377960.32070.37468
24-0.016496-0.140.444536
25-0.107475-0.9120.182418
26-0.044861-0.38070.352288
270.0143020.12140.451874
280.0328440.27870.390642
29-0.031052-0.26350.396465
300.0032210.02730.489136
310.0125010.10610.45791
320.0391260.3320.370429
330.0394910.33510.369265
34-0.033948-0.28810.387063
350.0469570.39840.345741
360.0174070.14770.441496
370.0162120.13760.445483
380.0516310.43810.331313
39-0.007587-0.06440.474426
40-0.03573-0.30320.381313
410.0238370.20230.420139
42-0.013033-0.11060.456124
430.0114610.09730.461398
44-0.012272-0.10410.458676
45-0.028932-0.24550.403386
46-0.007998-0.06790.473041
47-0.084617-0.7180.237542
48-0.077924-0.66120.255295
490.0579460.49170.312219
50-0.042693-0.36230.359109
51-0.051565-0.43750.331514
52-0.010799-0.09160.463621
53-0.032453-0.27540.391908
54-0.067529-0.5730.284215
55-0.036334-0.30830.379372
56-0.086907-0.73740.231628
57-0.021623-0.18350.427471
58-0.037491-0.31810.375656
590.010720.0910.463888
600.0066450.05640.477595


Parameters (Session):
par1 = 60 ; par2 = 1 ; par3 = 0 ; par4 = 0 ; par5 = 12 ; par6 = White Noise ; par7 = 0.95 ;
Parameters (R input):
par1 = 60 ; par2 = 1 ; par3 = 0 ; par4 = 0 ; par5 = 12 ; par6 = White Noise ; par7 = 0.95 ; par8 = ;
R code (references can be found in the software module):
if (par1 == 'Default') {
par1 = 10*log10(length(x))
} else {
par1 <- as.numeric(par1)
}
par2 <- as.numeric(par2)
par3 <- as.numeric(par3)
par4 <- as.numeric(par4)
par5 <- as.numeric(par5)
if (par6 == 'White Noise') par6 <- 'white' else par6 <- 'ma'
par7 <- as.numeric(par7)
if (par8 != '') par8 <- as.numeric(par8)
x <- na.omit(x)
ox <- x
if (par8 == '') {
if (par2 == 0) {
x <- log(x)
} else {
x <- (x ^ par2 - 1) / par2
}
} else {
x <- log(x,base=par8)
}
if (par3 > 0) x <- diff(x,lag=1,difference=par3)
if (par4 > 0) x <- diff(x,lag=par5,difference=par4)
bitmap(file='picts.png')
op <- par(mfrow=c(2,1))
plot(ox,type='l',main='Original Time Series',xlab='time',ylab='value')
if (par8=='') {
mytitle <- paste('Working Time Series (lambda=',par2,', d=',par3,', D=',par4,')',sep='')
mysub <- paste('(lambda=',par2,', d=',par3,', D=',par4,', CI=', par7, ', CI type=',par6,')',sep='')
} else {
mytitle <- paste('Working Time Series (base=',par8,', d=',par3,', D=',par4,')',sep='')
mysub <- paste('(base=',par8,', d=',par3,', D=',par4,', CI=', par7, ', CI type=',par6,')',sep='')
}
plot(x,type='l', main=mytitle,xlab='time',ylab='value')
par(op)
dev.off()
bitmap(file='pic1.png')
racf <- acf(x, par1, main='Autocorrelation', xlab='time lag', ylab='ACF', ci.type=par6, ci=par7, sub=mysub)
dev.off()
bitmap(file='pic2.png')
rpacf <- pacf(x,par1,main='Partial Autocorrelation',xlab='lags',ylab='PACF',sub=mysub)
dev.off()
(myacf <- c(racf$acf))
(mypacf <- c(rpacf$acf))
lengthx <- length(x)
sqrtn <- sqrt(lengthx)
load(file='createtable')
a<-table.start()
a<-table.row.start(a)
a<-table.element(a,'Autocorrelation Function',4,TRUE)
a<-table.row.end(a)
a<-table.row.start(a)
a<-table.element(a,'Time lag k',header=TRUE)
a<-table.element(a,hyperlink('basics.htm','ACF(k)','click here for more information about the Autocorrelation Function'),header=TRUE)
a<-table.element(a,'T-STAT',header=TRUE)
a<-table.element(a,'P-value',header=TRUE)
a<-table.row.end(a)
for (i in 2:(par1+1)) {
a<-table.row.start(a)
a<-table.element(a,i-1,header=TRUE)
a<-table.element(a,round(myacf[i],6))
mytstat <- myacf[i]*sqrtn
a<-table.element(a,round(mytstat,4))
a<-table.element(a,round(1-pt(abs(mytstat),lengthx),6))
a<-table.row.end(a)
}
a<-table.end(a)
table.save(a,file='mytable.tab')
a<-table.start()
a<-table.row.start(a)
a<-table.element(a,'Partial Autocorrelation Function',4,TRUE)
a<-table.row.end(a)
a<-table.row.start(a)
a<-table.element(a,'Time lag k',header=TRUE)
a<-table.element(a,hyperlink('basics.htm','PACF(k)','click here for more information about the Partial Autocorrelation Function'),header=TRUE)
a<-table.element(a,'T-STAT',header=TRUE)
a<-table.element(a,'P-value',header=TRUE)
a<-table.row.end(a)
for (i in 1:par1) {
a<-table.row.start(a)
a<-table.element(a,i,header=TRUE)
a<-table.element(a,round(mypacf[i],6))
mytstat <- mypacf[i]*sqrtn
a<-table.element(a,round(mytstat,4))
a<-table.element(a,round(1-pt(abs(mytstat),lengthx),6))
a<-table.row.end(a)
}
a<-table.end(a)
table.save(a,file='mytable1.tab')