Free Statistics

of Irreproducible Research!

Author's title

Author*Unverified author*
R Software Modulerwasp_autocorrelation.wasp
Title produced by software(Partial) Autocorrelation Function
Date of computationThu, 20 Oct 2016 19:28:33 +0100
Cite this page as followsStatistical Computations at FreeStatistics.org, Office for Research Development and Education, URL https://freestatistics.org/blog/index.php?v=date/2016/Oct/20/t1476988190xr59px0prcrik6u.htm/, Retrieved Sun, 05 May 2024 02:16:04 +0200
Statistical Computations at FreeStatistics.org, Office for Research Development and Education, URL https://freestatistics.org/blog/index.php?pk=, Retrieved Sun, 05 May 2024 02:16:04 +0200
QR Codes:

Original text written by user:
IsPrivate?No (this computation is public)
User-defined keywords
Estimated Impact0
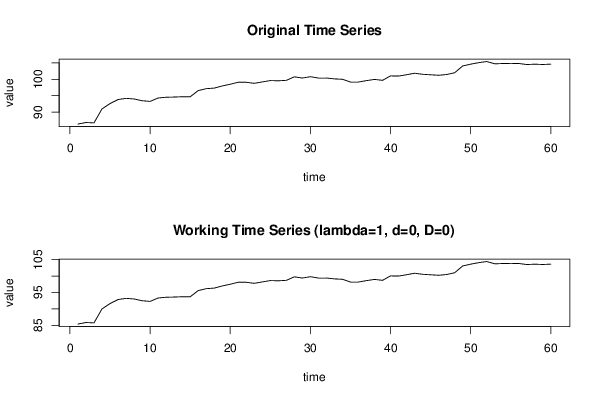
Dataseries X:
86,37
86,84
86,73
90,99
92,61
93,83
94,2
94,01
93,47
93,27
94,3
94,53
94,59
94,69
94,67
96,55
97,14
97,32
97,97
98,49
99,11
99,09
98,76
99,2
99,61
99,54
99,68
100,75
100,38
100,79
100,39
100,39
100,12
100
99,17
99,17
99,59
99,96
99,68
101,03
100,99
101,38
101,84
101,52
101,37
101,22
101,45
101,99
104,05
104,61
105,06
105,4
104,71
104,8
104,83
104,81
104,49
104,59
104,5
104,61


Summary of computational transaction
Raw Inputview raw input (R code)
Raw Outputview raw output of R engine
Computing time1 seconds
R Server'Sir Maurice George Kendall' @ kendall.wessa.net

\begin{tabular}{lllllllll}
\hline
Summary of computational transaction \tabularnewline
Raw Input & view raw input (R code)  \tabularnewline
Raw Output & view raw output of R engine  \tabularnewline
Computing time & 1 seconds \tabularnewline
R Server & 'Sir Maurice George Kendall' @ kendall.wessa.net \tabularnewline
\hline
\end{tabular}
%Source: https://freestatistics.org/blog/index.php?pk=&T=0

[TABLE]
[ROW][C]Summary of computational transaction[/C][/ROW]
[ROW][C]Raw Input[/C][C]view raw input (R code) [/C][/ROW]
[ROW][C]Raw Output[/C][C]view raw output of R engine [/C][/ROW]
[ROW][C]Computing time[/C][C]1 seconds[/C][/ROW]
[ROW][C]R Server[/C][C]'Sir Maurice George Kendall' @ kendall.wessa.net[/C][/ROW]
[/TABLE]
Source: https://freestatistics.org/blog/index.php?pk=&T=0

Globally Unique Identifier (entire table): ba.freestatistics.org/blog/index.php?pk=&T=0

As an alternative you can also use a QR Code:  

The GUIDs for individual cells are displayed in the table below:

Summary of computational transaction
Raw Inputview raw input (R code)
Raw Outputview raw output of R engine
Computing time1 seconds
R Server'Sir Maurice George Kendall' @ kendall.wessa.net


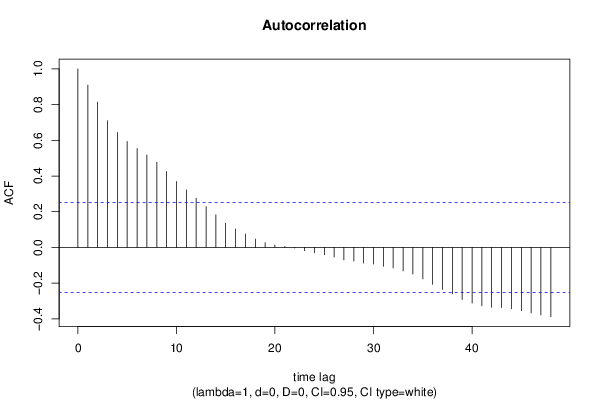
Autocorrelation Function
Time lag kACF(k)T-STATP-value
10.9095257.04520
20.8142656.30730
30.7093145.49430
40.6438734.98743e-06
50.5931464.59451.1e-05
60.5544284.29463.2e-05
70.5176874.018.5e-05
80.4768413.69360.00024
90.4257033.29750.000821
100.3692352.86010.00291
110.3217862.49250.007731
120.2755652.13450.018448
130.2284831.76980.040919
140.1823641.41260.081472
150.1351131.04660.149746
160.1034030.8010.213159
170.0755160.58490.28039
180.0465620.36070.359807
190.0265070.20530.419008
200.0136750.10590.457998
210.0047370.03670.485425
22-0.003013-0.02330.49073
23-0.018169-0.14070.444276
24-0.029689-0.230.409448
25-0.041649-0.32260.374054
26-0.053409-0.41370.340283
27-0.070132-0.54320.294489
28-0.076192-0.59020.278642
29-0.08707-0.67440.251311
30-0.093337-0.7230.236249
31-0.105683-0.81860.208121
32-0.115137-0.89180.188019
33-0.13159-1.01930.156079
34-0.148895-1.15330.126673
35-0.176421-1.36660.088433
36-0.206177-1.5970.057755
37-0.235755-1.82610.036402
38-0.260045-2.01430.024234
39-0.292235-2.26360.013613
40-0.312062-2.41720.009348
41-0.327497-2.53680.006903
42-0.335824-2.60130.00584
43-0.336792-2.60880.005726
44-0.343527-2.66090.004991
45-0.354538-2.74620.003973
46-0.366832-2.84150.003063
47-0.379274-2.93780.002342
48-0.388083-3.00610.00193

\begin{tabular}{lllllllll}
\hline
Autocorrelation Function \tabularnewline
Time lag k & ACF(k) & T-STAT & P-value \tabularnewline
1 & 0.909525 & 7.0452 & 0 \tabularnewline
2 & 0.814265 & 6.3073 & 0 \tabularnewline
3 & 0.709314 & 5.4943 & 0 \tabularnewline
4 & 0.643873 & 4.9874 & 3e-06 \tabularnewline
5 & 0.593146 & 4.5945 & 1.1e-05 \tabularnewline
6 & 0.554428 & 4.2946 & 3.2e-05 \tabularnewline
7 & 0.517687 & 4.01 & 8.5e-05 \tabularnewline
8 & 0.476841 & 3.6936 & 0.00024 \tabularnewline
9 & 0.425703 & 3.2975 & 0.000821 \tabularnewline
10 & 0.369235 & 2.8601 & 0.00291 \tabularnewline
11 & 0.321786 & 2.4925 & 0.007731 \tabularnewline
12 & 0.275565 & 2.1345 & 0.018448 \tabularnewline
13 & 0.228483 & 1.7698 & 0.040919 \tabularnewline
14 & 0.182364 & 1.4126 & 0.081472 \tabularnewline
15 & 0.135113 & 1.0466 & 0.149746 \tabularnewline
16 & 0.103403 & 0.801 & 0.213159 \tabularnewline
17 & 0.075516 & 0.5849 & 0.28039 \tabularnewline
18 & 0.046562 & 0.3607 & 0.359807 \tabularnewline
19 & 0.026507 & 0.2053 & 0.419008 \tabularnewline
20 & 0.013675 & 0.1059 & 0.457998 \tabularnewline
21 & 0.004737 & 0.0367 & 0.485425 \tabularnewline
22 & -0.003013 & -0.0233 & 0.49073 \tabularnewline
23 & -0.018169 & -0.1407 & 0.444276 \tabularnewline
24 & -0.029689 & -0.23 & 0.409448 \tabularnewline
25 & -0.041649 & -0.3226 & 0.374054 \tabularnewline
26 & -0.053409 & -0.4137 & 0.340283 \tabularnewline
27 & -0.070132 & -0.5432 & 0.294489 \tabularnewline
28 & -0.076192 & -0.5902 & 0.278642 \tabularnewline
29 & -0.08707 & -0.6744 & 0.251311 \tabularnewline
30 & -0.093337 & -0.723 & 0.236249 \tabularnewline
31 & -0.105683 & -0.8186 & 0.208121 \tabularnewline
32 & -0.115137 & -0.8918 & 0.188019 \tabularnewline
33 & -0.13159 & -1.0193 & 0.156079 \tabularnewline
34 & -0.148895 & -1.1533 & 0.126673 \tabularnewline
35 & -0.176421 & -1.3666 & 0.088433 \tabularnewline
36 & -0.206177 & -1.597 & 0.057755 \tabularnewline
37 & -0.235755 & -1.8261 & 0.036402 \tabularnewline
38 & -0.260045 & -2.0143 & 0.024234 \tabularnewline
39 & -0.292235 & -2.2636 & 0.013613 \tabularnewline
40 & -0.312062 & -2.4172 & 0.009348 \tabularnewline
41 & -0.327497 & -2.5368 & 0.006903 \tabularnewline
42 & -0.335824 & -2.6013 & 0.00584 \tabularnewline
43 & -0.336792 & -2.6088 & 0.005726 \tabularnewline
44 & -0.343527 & -2.6609 & 0.004991 \tabularnewline
45 & -0.354538 & -2.7462 & 0.003973 \tabularnewline
46 & -0.366832 & -2.8415 & 0.003063 \tabularnewline
47 & -0.379274 & -2.9378 & 0.002342 \tabularnewline
48 & -0.388083 & -3.0061 & 0.00193 \tabularnewline
\hline
\end{tabular}
%Source: https://freestatistics.org/blog/index.php?pk=&T=1

[TABLE]
[ROW][C]Autocorrelation Function[/C][/ROW]
[ROW][C]Time lag k[/C][C]ACF(k)[/C][C]T-STAT[/C][C]P-value[/C][/ROW]
[ROW][C]1[/C][C]0.909525[/C][C]7.0452[/C][C]0[/C][/ROW]
[ROW][C]2[/C][C]0.814265[/C][C]6.3073[/C][C]0[/C][/ROW]
[ROW][C]3[/C][C]0.709314[/C][C]5.4943[/C][C]0[/C][/ROW]
[ROW][C]4[/C][C]0.643873[/C][C]4.9874[/C][C]3e-06[/C][/ROW]
[ROW][C]5[/C][C]0.593146[/C][C]4.5945[/C][C]1.1e-05[/C][/ROW]
[ROW][C]6[/C][C]0.554428[/C][C]4.2946[/C][C]3.2e-05[/C][/ROW]
[ROW][C]7[/C][C]0.517687[/C][C]4.01[/C][C]8.5e-05[/C][/ROW]
[ROW][C]8[/C][C]0.476841[/C][C]3.6936[/C][C]0.00024[/C][/ROW]
[ROW][C]9[/C][C]0.425703[/C][C]3.2975[/C][C]0.000821[/C][/ROW]
[ROW][C]10[/C][C]0.369235[/C][C]2.8601[/C][C]0.00291[/C][/ROW]
[ROW][C]11[/C][C]0.321786[/C][C]2.4925[/C][C]0.007731[/C][/ROW]
[ROW][C]12[/C][C]0.275565[/C][C]2.1345[/C][C]0.018448[/C][/ROW]
[ROW][C]13[/C][C]0.228483[/C][C]1.7698[/C][C]0.040919[/C][/ROW]
[ROW][C]14[/C][C]0.182364[/C][C]1.4126[/C][C]0.081472[/C][/ROW]
[ROW][C]15[/C][C]0.135113[/C][C]1.0466[/C][C]0.149746[/C][/ROW]
[ROW][C]16[/C][C]0.103403[/C][C]0.801[/C][C]0.213159[/C][/ROW]
[ROW][C]17[/C][C]0.075516[/C][C]0.5849[/C][C]0.28039[/C][/ROW]
[ROW][C]18[/C][C]0.046562[/C][C]0.3607[/C][C]0.359807[/C][/ROW]
[ROW][C]19[/C][C]0.026507[/C][C]0.2053[/C][C]0.419008[/C][/ROW]
[ROW][C]20[/C][C]0.013675[/C][C]0.1059[/C][C]0.457998[/C][/ROW]
[ROW][C]21[/C][C]0.004737[/C][C]0.0367[/C][C]0.485425[/C][/ROW]
[ROW][C]22[/C][C]-0.003013[/C][C]-0.0233[/C][C]0.49073[/C][/ROW]
[ROW][C]23[/C][C]-0.018169[/C][C]-0.1407[/C][C]0.444276[/C][/ROW]
[ROW][C]24[/C][C]-0.029689[/C][C]-0.23[/C][C]0.409448[/C][/ROW]
[ROW][C]25[/C][C]-0.041649[/C][C]-0.3226[/C][C]0.374054[/C][/ROW]
[ROW][C]26[/C][C]-0.053409[/C][C]-0.4137[/C][C]0.340283[/C][/ROW]
[ROW][C]27[/C][C]-0.070132[/C][C]-0.5432[/C][C]0.294489[/C][/ROW]
[ROW][C]28[/C][C]-0.076192[/C][C]-0.5902[/C][C]0.278642[/C][/ROW]
[ROW][C]29[/C][C]-0.08707[/C][C]-0.6744[/C][C]0.251311[/C][/ROW]
[ROW][C]30[/C][C]-0.093337[/C][C]-0.723[/C][C]0.236249[/C][/ROW]
[ROW][C]31[/C][C]-0.105683[/C][C]-0.8186[/C][C]0.208121[/C][/ROW]
[ROW][C]32[/C][C]-0.115137[/C][C]-0.8918[/C][C]0.188019[/C][/ROW]
[ROW][C]33[/C][C]-0.13159[/C][C]-1.0193[/C][C]0.156079[/C][/ROW]
[ROW][C]34[/C][C]-0.148895[/C][C]-1.1533[/C][C]0.126673[/C][/ROW]
[ROW][C]35[/C][C]-0.176421[/C][C]-1.3666[/C][C]0.088433[/C][/ROW]
[ROW][C]36[/C][C]-0.206177[/C][C]-1.597[/C][C]0.057755[/C][/ROW]
[ROW][C]37[/C][C]-0.235755[/C][C]-1.8261[/C][C]0.036402[/C][/ROW]
[ROW][C]38[/C][C]-0.260045[/C][C]-2.0143[/C][C]0.024234[/C][/ROW]
[ROW][C]39[/C][C]-0.292235[/C][C]-2.2636[/C][C]0.013613[/C][/ROW]
[ROW][C]40[/C][C]-0.312062[/C][C]-2.4172[/C][C]0.009348[/C][/ROW]
[ROW][C]41[/C][C]-0.327497[/C][C]-2.5368[/C][C]0.006903[/C][/ROW]
[ROW][C]42[/C][C]-0.335824[/C][C]-2.6013[/C][C]0.00584[/C][/ROW]
[ROW][C]43[/C][C]-0.336792[/C][C]-2.6088[/C][C]0.005726[/C][/ROW]
[ROW][C]44[/C][C]-0.343527[/C][C]-2.6609[/C][C]0.004991[/C][/ROW]
[ROW][C]45[/C][C]-0.354538[/C][C]-2.7462[/C][C]0.003973[/C][/ROW]
[ROW][C]46[/C][C]-0.366832[/C][C]-2.8415[/C][C]0.003063[/C][/ROW]
[ROW][C]47[/C][C]-0.379274[/C][C]-2.9378[/C][C]0.002342[/C][/ROW]
[ROW][C]48[/C][C]-0.388083[/C][C]-3.0061[/C][C]0.00193[/C][/ROW]
[/TABLE]
Source: https://freestatistics.org/blog/index.php?pk=&T=1

Globally Unique Identifier (entire table): ba.freestatistics.org/blog/index.php?pk=&T=1

As an alternative you can also use a QR Code:  

The GUIDs for individual cells are displayed in the table below:

Autocorrelation Function
Time lag kACF(k)T-STATP-value
10.9095257.04520
20.8142656.30730
30.7093145.49430
40.6438734.98743e-06
50.5931464.59451.1e-05
60.5544284.29463.2e-05
70.5176874.018.5e-05
80.4768413.69360.00024
90.4257033.29750.000821
100.3692352.86010.00291
110.3217862.49250.007731
120.2755652.13450.018448
130.2284831.76980.040919
140.1823641.41260.081472
150.1351131.04660.149746
160.1034030.8010.213159
170.0755160.58490.28039
180.0465620.36070.359807
190.0265070.20530.419008
200.0136750.10590.457998
210.0047370.03670.485425
22-0.003013-0.02330.49073
23-0.018169-0.14070.444276
24-0.029689-0.230.409448
25-0.041649-0.32260.374054
26-0.053409-0.41370.340283
27-0.070132-0.54320.294489
28-0.076192-0.59020.278642
29-0.08707-0.67440.251311
30-0.093337-0.7230.236249
31-0.105683-0.81860.208121
32-0.115137-0.89180.188019
33-0.13159-1.01930.156079
34-0.148895-1.15330.126673
35-0.176421-1.36660.088433
36-0.206177-1.5970.057755
37-0.235755-1.82610.036402
38-0.260045-2.01430.024234
39-0.292235-2.26360.013613
40-0.312062-2.41720.009348
41-0.327497-2.53680.006903
42-0.335824-2.60130.00584
43-0.336792-2.60880.005726
44-0.343527-2.66090.004991
45-0.354538-2.74620.003973
46-0.366832-2.84150.003063
47-0.379274-2.93780.002342
48-0.388083-3.00610.00193


Partial Autocorrelation Function
Time lag kPACF(k)T-STATP-value
10.9095257.04520
2-0.075078-0.58160.281523
3-0.108258-0.83860.202521
40.1735561.34440.091947
50.0363610.28170.38959
60.0042780.03310.486837
70.0173210.13420.446859
8-0.027991-0.21680.414544
9-0.067228-0.52070.30223
10-0.0436-0.33770.368375
110.0253160.19610.422598
12-0.047304-0.36640.357673
13-0.065565-0.50790.306706
14-0.016197-0.12550.450289
15-0.044313-0.34320.366307
160.0474350.36740.357294
17-0.006849-0.05310.478932
18-0.054897-0.42520.336095
190.0504170.39050.348764
200.0344240.26660.395328
21-0.003705-0.02870.488599
220.0103460.08010.468195
23-0.041741-0.32330.373786
240.0113220.08770.465204
25-0.009797-0.07590.469882
26-0.022959-0.17780.429725
27-0.048732-0.37750.353575
280.0318160.24640.403088
29-0.046285-0.35850.360604
30-0.012023-0.09310.463056
31-0.024766-0.19180.424258
32-0.009247-0.07160.47157
33-0.06646-0.51480.304294
34-0.023101-0.17890.429293
35-0.068159-0.5280.299739
36-0.064305-0.49810.310115
37-0.031357-0.24290.404458
38-0.02477-0.19190.424248
39-0.107058-0.82930.20512
400.0337710.26160.397268
41-0.00651-0.05040.479975
42-0.032026-0.24810.402464
430.0465850.36080.359741
44-0.052416-0.4060.343089
45-0.056946-0.44110.330362
46-0.002547-0.01970.492161
47-0.031632-0.2450.403639
48-0.034417-0.26660.395348

\begin{tabular}{lllllllll}
\hline
Partial Autocorrelation Function \tabularnewline
Time lag k & PACF(k) & T-STAT & P-value \tabularnewline
1 & 0.909525 & 7.0452 & 0 \tabularnewline
2 & -0.075078 & -0.5816 & 0.281523 \tabularnewline
3 & -0.108258 & -0.8386 & 0.202521 \tabularnewline
4 & 0.173556 & 1.3444 & 0.091947 \tabularnewline
5 & 0.036361 & 0.2817 & 0.38959 \tabularnewline
6 & 0.004278 & 0.0331 & 0.486837 \tabularnewline
7 & 0.017321 & 0.1342 & 0.446859 \tabularnewline
8 & -0.027991 & -0.2168 & 0.414544 \tabularnewline
9 & -0.067228 & -0.5207 & 0.30223 \tabularnewline
10 & -0.0436 & -0.3377 & 0.368375 \tabularnewline
11 & 0.025316 & 0.1961 & 0.422598 \tabularnewline
12 & -0.047304 & -0.3664 & 0.357673 \tabularnewline
13 & -0.065565 & -0.5079 & 0.306706 \tabularnewline
14 & -0.016197 & -0.1255 & 0.450289 \tabularnewline
15 & -0.044313 & -0.3432 & 0.366307 \tabularnewline
16 & 0.047435 & 0.3674 & 0.357294 \tabularnewline
17 & -0.006849 & -0.0531 & 0.478932 \tabularnewline
18 & -0.054897 & -0.4252 & 0.336095 \tabularnewline
19 & 0.050417 & 0.3905 & 0.348764 \tabularnewline
20 & 0.034424 & 0.2666 & 0.395328 \tabularnewline
21 & -0.003705 & -0.0287 & 0.488599 \tabularnewline
22 & 0.010346 & 0.0801 & 0.468195 \tabularnewline
23 & -0.041741 & -0.3233 & 0.373786 \tabularnewline
24 & 0.011322 & 0.0877 & 0.465204 \tabularnewline
25 & -0.009797 & -0.0759 & 0.469882 \tabularnewline
26 & -0.022959 & -0.1778 & 0.429725 \tabularnewline
27 & -0.048732 & -0.3775 & 0.353575 \tabularnewline
28 & 0.031816 & 0.2464 & 0.403088 \tabularnewline
29 & -0.046285 & -0.3585 & 0.360604 \tabularnewline
30 & -0.012023 & -0.0931 & 0.463056 \tabularnewline
31 & -0.024766 & -0.1918 & 0.424258 \tabularnewline
32 & -0.009247 & -0.0716 & 0.47157 \tabularnewline
33 & -0.06646 & -0.5148 & 0.304294 \tabularnewline
34 & -0.023101 & -0.1789 & 0.429293 \tabularnewline
35 & -0.068159 & -0.528 & 0.299739 \tabularnewline
36 & -0.064305 & -0.4981 & 0.310115 \tabularnewline
37 & -0.031357 & -0.2429 & 0.404458 \tabularnewline
38 & -0.02477 & -0.1919 & 0.424248 \tabularnewline
39 & -0.107058 & -0.8293 & 0.20512 \tabularnewline
40 & 0.033771 & 0.2616 & 0.397268 \tabularnewline
41 & -0.00651 & -0.0504 & 0.479975 \tabularnewline
42 & -0.032026 & -0.2481 & 0.402464 \tabularnewline
43 & 0.046585 & 0.3608 & 0.359741 \tabularnewline
44 & -0.052416 & -0.406 & 0.343089 \tabularnewline
45 & -0.056946 & -0.4411 & 0.330362 \tabularnewline
46 & -0.002547 & -0.0197 & 0.492161 \tabularnewline
47 & -0.031632 & -0.245 & 0.403639 \tabularnewline
48 & -0.034417 & -0.2666 & 0.395348 \tabularnewline
\hline
\end{tabular}
%Source: https://freestatistics.org/blog/index.php?pk=&T=2

[TABLE]
[ROW][C]Partial Autocorrelation Function[/C][/ROW]
[ROW][C]Time lag k[/C][C]PACF(k)[/C][C]T-STAT[/C][C]P-value[/C][/ROW]
[ROW][C]1[/C][C]0.909525[/C][C]7.0452[/C][C]0[/C][/ROW]
[ROW][C]2[/C][C]-0.075078[/C][C]-0.5816[/C][C]0.281523[/C][/ROW]
[ROW][C]3[/C][C]-0.108258[/C][C]-0.8386[/C][C]0.202521[/C][/ROW]
[ROW][C]4[/C][C]0.173556[/C][C]1.3444[/C][C]0.091947[/C][/ROW]
[ROW][C]5[/C][C]0.036361[/C][C]0.2817[/C][C]0.38959[/C][/ROW]
[ROW][C]6[/C][C]0.004278[/C][C]0.0331[/C][C]0.486837[/C][/ROW]
[ROW][C]7[/C][C]0.017321[/C][C]0.1342[/C][C]0.446859[/C][/ROW]
[ROW][C]8[/C][C]-0.027991[/C][C]-0.2168[/C][C]0.414544[/C][/ROW]
[ROW][C]9[/C][C]-0.067228[/C][C]-0.5207[/C][C]0.30223[/C][/ROW]
[ROW][C]10[/C][C]-0.0436[/C][C]-0.3377[/C][C]0.368375[/C][/ROW]
[ROW][C]11[/C][C]0.025316[/C][C]0.1961[/C][C]0.422598[/C][/ROW]
[ROW][C]12[/C][C]-0.047304[/C][C]-0.3664[/C][C]0.357673[/C][/ROW]
[ROW][C]13[/C][C]-0.065565[/C][C]-0.5079[/C][C]0.306706[/C][/ROW]
[ROW][C]14[/C][C]-0.016197[/C][C]-0.1255[/C][C]0.450289[/C][/ROW]
[ROW][C]15[/C][C]-0.044313[/C][C]-0.3432[/C][C]0.366307[/C][/ROW]
[ROW][C]16[/C][C]0.047435[/C][C]0.3674[/C][C]0.357294[/C][/ROW]
[ROW][C]17[/C][C]-0.006849[/C][C]-0.0531[/C][C]0.478932[/C][/ROW]
[ROW][C]18[/C][C]-0.054897[/C][C]-0.4252[/C][C]0.336095[/C][/ROW]
[ROW][C]19[/C][C]0.050417[/C][C]0.3905[/C][C]0.348764[/C][/ROW]
[ROW][C]20[/C][C]0.034424[/C][C]0.2666[/C][C]0.395328[/C][/ROW]
[ROW][C]21[/C][C]-0.003705[/C][C]-0.0287[/C][C]0.488599[/C][/ROW]
[ROW][C]22[/C][C]0.010346[/C][C]0.0801[/C][C]0.468195[/C][/ROW]
[ROW][C]23[/C][C]-0.041741[/C][C]-0.3233[/C][C]0.373786[/C][/ROW]
[ROW][C]24[/C][C]0.011322[/C][C]0.0877[/C][C]0.465204[/C][/ROW]
[ROW][C]25[/C][C]-0.009797[/C][C]-0.0759[/C][C]0.469882[/C][/ROW]
[ROW][C]26[/C][C]-0.022959[/C][C]-0.1778[/C][C]0.429725[/C][/ROW]
[ROW][C]27[/C][C]-0.048732[/C][C]-0.3775[/C][C]0.353575[/C][/ROW]
[ROW][C]28[/C][C]0.031816[/C][C]0.2464[/C][C]0.403088[/C][/ROW]
[ROW][C]29[/C][C]-0.046285[/C][C]-0.3585[/C][C]0.360604[/C][/ROW]
[ROW][C]30[/C][C]-0.012023[/C][C]-0.0931[/C][C]0.463056[/C][/ROW]
[ROW][C]31[/C][C]-0.024766[/C][C]-0.1918[/C][C]0.424258[/C][/ROW]
[ROW][C]32[/C][C]-0.009247[/C][C]-0.0716[/C][C]0.47157[/C][/ROW]
[ROW][C]33[/C][C]-0.06646[/C][C]-0.5148[/C][C]0.304294[/C][/ROW]
[ROW][C]34[/C][C]-0.023101[/C][C]-0.1789[/C][C]0.429293[/C][/ROW]
[ROW][C]35[/C][C]-0.068159[/C][C]-0.528[/C][C]0.299739[/C][/ROW]
[ROW][C]36[/C][C]-0.064305[/C][C]-0.4981[/C][C]0.310115[/C][/ROW]
[ROW][C]37[/C][C]-0.031357[/C][C]-0.2429[/C][C]0.404458[/C][/ROW]
[ROW][C]38[/C][C]-0.02477[/C][C]-0.1919[/C][C]0.424248[/C][/ROW]
[ROW][C]39[/C][C]-0.107058[/C][C]-0.8293[/C][C]0.20512[/C][/ROW]
[ROW][C]40[/C][C]0.033771[/C][C]0.2616[/C][C]0.397268[/C][/ROW]
[ROW][C]41[/C][C]-0.00651[/C][C]-0.0504[/C][C]0.479975[/C][/ROW]
[ROW][C]42[/C][C]-0.032026[/C][C]-0.2481[/C][C]0.402464[/C][/ROW]
[ROW][C]43[/C][C]0.046585[/C][C]0.3608[/C][C]0.359741[/C][/ROW]
[ROW][C]44[/C][C]-0.052416[/C][C]-0.406[/C][C]0.343089[/C][/ROW]
[ROW][C]45[/C][C]-0.056946[/C][C]-0.4411[/C][C]0.330362[/C][/ROW]
[ROW][C]46[/C][C]-0.002547[/C][C]-0.0197[/C][C]0.492161[/C][/ROW]
[ROW][C]47[/C][C]-0.031632[/C][C]-0.245[/C][C]0.403639[/C][/ROW]
[ROW][C]48[/C][C]-0.034417[/C][C]-0.2666[/C][C]0.395348[/C][/ROW]
[/TABLE]
Source: https://freestatistics.org/blog/index.php?pk=&T=2

Globally Unique Identifier (entire table): ba.freestatistics.org/blog/index.php?pk=&T=2

As an alternative you can also use a QR Code:  

The GUIDs for individual cells are displayed in the table below:

Partial Autocorrelation Function
Time lag kPACF(k)T-STATP-value
10.9095257.04520
2-0.075078-0.58160.281523
3-0.108258-0.83860.202521
40.1735561.34440.091947
50.0363610.28170.38959
60.0042780.03310.486837
70.0173210.13420.446859
8-0.027991-0.21680.414544
9-0.067228-0.52070.30223
10-0.0436-0.33770.368375
110.0253160.19610.422598
12-0.047304-0.36640.357673
13-0.065565-0.50790.306706
14-0.016197-0.12550.450289
15-0.044313-0.34320.366307
160.0474350.36740.357294
17-0.006849-0.05310.478932
18-0.054897-0.42520.336095
190.0504170.39050.348764
200.0344240.26660.395328
21-0.003705-0.02870.488599
220.0103460.08010.468195
23-0.041741-0.32330.373786
240.0113220.08770.465204
25-0.009797-0.07590.469882
26-0.022959-0.17780.429725
27-0.048732-0.37750.353575
280.0318160.24640.403088
29-0.046285-0.35850.360604
30-0.012023-0.09310.463056
31-0.024766-0.19180.424258
32-0.009247-0.07160.47157
33-0.06646-0.51480.304294
34-0.023101-0.17890.429293
35-0.068159-0.5280.299739
36-0.064305-0.49810.310115
37-0.031357-0.24290.404458
38-0.02477-0.19190.424248
39-0.107058-0.82930.20512
400.0337710.26160.397268
41-0.00651-0.05040.479975
42-0.032026-0.24810.402464
430.0465850.36080.359741
44-0.052416-0.4060.343089
45-0.056946-0.44110.330362
46-0.002547-0.01970.492161
47-0.031632-0.2450.403639
48-0.034417-0.26660.395348


Parameters (Session):
par1 = 48 ; par2 = 1 ; par3 = 0 ; par4 = 0 ; par5 = 12 ; par6 = White Noise ; par7 = 0.95 ;
Parameters (R input):
par1 = 48 ; par2 = 1 ; par3 = 0 ; par4 = 0 ; par5 = 12 ; par6 = White Noise ; par7 = 0.95 ; par8 = ;
R code (references can be found in the software module):
if (par1 == 'Default') {
par1 = 10*log10(length(x))
} else {
par1 <- as.numeric(par1)
}
par2 <- as.numeric(par2)
par3 <- as.numeric(par3)
par4 <- as.numeric(par4)
par5 <- as.numeric(par5)
if (par6 == 'White Noise') par6 <- 'white' else par6 <- 'ma'
par7 <- as.numeric(par7)
if (par8 != '') par8 <- as.numeric(par8)
x <- na.omit(x)
ox <- x
if (par8 == '') {
if (par2 == 0) {
x <- log(x)
} else {
x <- (x ^ par2 - 1) / par2
}
} else {
x <- log(x,base=par8)
}
if (par3 > 0) x <- diff(x,lag=1,difference=par3)
if (par4 > 0) x <- diff(x,lag=par5,difference=par4)
bitmap(file='picts.png')
op <- par(mfrow=c(2,1))
plot(ox,type='l',main='Original Time Series',xlab='time',ylab='value')
if (par8=='') {
mytitle <- paste('Working Time Series (lambda=',par2,', d=',par3,', D=',par4,')',sep='')
mysub <- paste('(lambda=',par2,', d=',par3,', D=',par4,', CI=', par7, ', CI type=',par6,')',sep='')
} else {
mytitle <- paste('Working Time Series (base=',par8,', d=',par3,', D=',par4,')',sep='')
mysub <- paste('(base=',par8,', d=',par3,', D=',par4,', CI=', par7, ', CI type=',par6,')',sep='')
}
plot(x,type='l', main=mytitle,xlab='time',ylab='value')
par(op)
dev.off()
bitmap(file='pic1.png')
racf <- acf(x, par1, main='Autocorrelation', xlab='time lag', ylab='ACF', ci.type=par6, ci=par7, sub=mysub)
dev.off()
bitmap(file='pic2.png')
rpacf <- pacf(x,par1,main='Partial Autocorrelation',xlab='lags',ylab='PACF',sub=mysub)
dev.off()
(myacf <- c(racf$acf))
(mypacf <- c(rpacf$acf))
lengthx <- length(x)
sqrtn <- sqrt(lengthx)
load(file='createtable')
a<-table.start()
a<-table.row.start(a)
a<-table.element(a,'Autocorrelation Function',4,TRUE)
a<-table.row.end(a)
a<-table.row.start(a)
a<-table.element(a,'Time lag k',header=TRUE)
a<-table.element(a,hyperlink('basics.htm','ACF(k)','click here for more information about the Autocorrelation Function'),header=TRUE)
a<-table.element(a,'T-STAT',header=TRUE)
a<-table.element(a,'P-value',header=TRUE)
a<-table.row.end(a)
for (i in 2:(par1+1)) {
a<-table.row.start(a)
a<-table.element(a,i-1,header=TRUE)
a<-table.element(a,round(myacf[i],6))
mytstat <- myacf[i]*sqrtn
a<-table.element(a,round(mytstat,4))
a<-table.element(a,round(1-pt(abs(mytstat),lengthx),6))
a<-table.row.end(a)
}
a<-table.end(a)
table.save(a,file='mytable.tab')
a<-table.start()
a<-table.row.start(a)
a<-table.element(a,'Partial Autocorrelation Function',4,TRUE)
a<-table.row.end(a)
a<-table.row.start(a)
a<-table.element(a,'Time lag k',header=TRUE)
a<-table.element(a,hyperlink('basics.htm','PACF(k)','click here for more information about the Partial Autocorrelation Function'),header=TRUE)
a<-table.element(a,'T-STAT',header=TRUE)
a<-table.element(a,'P-value',header=TRUE)
a<-table.row.end(a)
for (i in 1:par1) {
a<-table.row.start(a)
a<-table.element(a,i,header=TRUE)
a<-table.element(a,round(mypacf[i],6))
mytstat <- mypacf[i]*sqrtn
a<-table.element(a,round(mytstat,4))
a<-table.element(a,round(1-pt(abs(mytstat),lengthx),6))
a<-table.row.end(a)
}
a<-table.end(a)
table.save(a,file='mytable1.tab')