Free Statistics

of Irreproducible Research!

Author's title

Author*Unverified author*
R Software Modulerwasp_autocorrelation.wasp
Title produced by software(Partial) Autocorrelation Function
Date of computationThu, 20 Oct 2016 21:36:30 +0100
Cite this page as followsStatistical Computations at FreeStatistics.org, Office for Research Development and Education, URL https://freestatistics.org/blog/index.php?v=date/2016/Oct/20/t14769959059aj4ux4xmnyo8hx.htm/, Retrieved Sun, 05 May 2024 09:40:39 +0200
Statistical Computations at FreeStatistics.org, Office for Research Development and Education, URL https://freestatistics.org/blog/index.php?pk=, Retrieved Sun, 05 May 2024 09:40:39 +0200
QR Codes:

Original text written by user:
IsPrivate?No (this computation is public)
User-defined keywords
Estimated Impact0
Dataseries X:
18347.7
19372.7
22263.8
19422.9
21268.6
20310
19256
17535.9
19857.4
19628.4
19727.5
18112.2
18889.3
20516.1
22317
19768.8
20015.8
20260.5
19434.3
17910
19134.4
20880.1
19680
17493.4
19155.9
19151
21318.2
20601.3
20496.8
19834.4
20997.6
17111.1
20752.3
21600.7
19939.5
18854.1
19697.4
19865
20930.3
20873.8
20007.5
20584.9
20604.1
16956.2
21731.2
21784.8
19280.6
17912.3
17904.8
19507.1
21188.7
20405.9
19214.4
21839.1
20030.6
16596.6
19996.3
20776.6
19003.1
18620.8


Summary of computational transaction
Raw Inputview raw input (R code)
Raw Outputview raw output of R engine
Computing time2 seconds
R Server'Sir Maurice George Kendall' @ kendall.wessa.net

\begin{tabular}{lllllllll}
\hline
Summary of computational transaction \tabularnewline
Raw Input & view raw input (R code)  \tabularnewline
Raw Output & view raw output of R engine  \tabularnewline
Computing time & 2 seconds \tabularnewline
R Server & 'Sir Maurice George Kendall' @ kendall.wessa.net \tabularnewline
\hline
\end{tabular}
%Source: https://freestatistics.org/blog/index.php?pk=&T=0

[TABLE]
[ROW][C]Summary of computational transaction[/C][/ROW]
[ROW][C]Raw Input[/C][C]view raw input (R code) [/C][/ROW]
[ROW][C]Raw Output[/C][C]view raw output of R engine [/C][/ROW]
[ROW][C]Computing time[/C][C]2 seconds[/C][/ROW]
[ROW][C]R Server[/C][C]'Sir Maurice George Kendall' @ kendall.wessa.net[/C][/ROW]
[/TABLE]
Source: https://freestatistics.org/blog/index.php?pk=&T=0

Globally Unique Identifier (entire table): ba.freestatistics.org/blog/index.php?pk=&T=0

As an alternative you can also use a QR Code:  

The GUIDs for individual cells are displayed in the table below:

Summary of computational transaction
Raw Inputview raw input (R code)
Raw Outputview raw output of R engine
Computing time2 seconds
R Server'Sir Maurice George Kendall' @ kendall.wessa.net


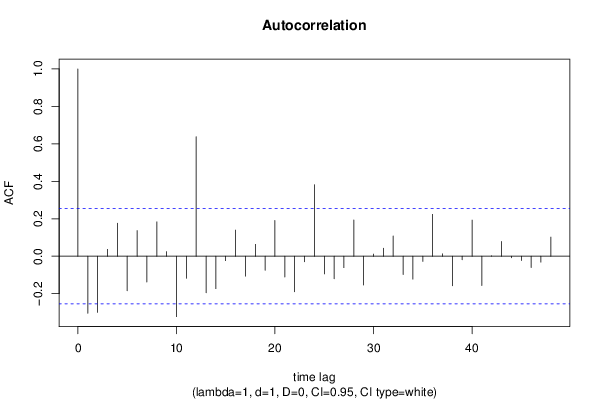
Autocorrelation Function
Time lag kACF(k)T-STATP-value
1-0.30485-2.34160.011299
2-0.300176-2.30570.01233
30.0364360.27990.390278
40.1764281.35520.090265
5-0.184095-1.41410.0813
60.1366551.04970.149076
7-0.137926-1.05940.14686
80.1832831.40780.082216
90.0246650.18950.425193
10-0.322795-2.47940.008018
11-0.118171-0.90770.183867
120.6383044.90294e-06
13-0.195501-1.50170.069258
14-0.173242-1.33070.094205
15-0.023564-0.1810.428493
160.13921.06920.144664
17-0.106591-0.81870.208114
180.0634230.48720.313974
19-0.075302-0.57840.282595
200.1909721.46690.073859
21-0.111038-0.85290.198581
22-0.189583-1.45620.075317
23-0.029624-0.22750.410394
240.3815762.93090.002401
25-0.094432-0.72530.235554
26-0.120598-0.92630.179024
27-0.061081-0.46920.320339
280.1937261.4880.071033
29-0.154009-1.1830.120783
300.0112270.08620.465786
310.0428660.32930.371562
320.1079450.82910.205183
33-0.097728-0.75070.22792
34-0.122369-0.93990.175542
35-0.027814-0.21360.41578
360.2235841.71740.045577
370.0124140.09540.462179
38-0.157461-1.20950.115652
39-0.018882-0.1450.442588
400.1928641.48140.071908
41-0.156523-1.20230.11703
420.000980.00750.497008
430.0785920.60370.274187
44-0.00804-0.06180.475483
45-0.023389-0.17970.429018
46-0.059914-0.46020.323528
47-0.031798-0.24420.403943
480.1021080.78430.218

\begin{tabular}{lllllllll}
\hline
Autocorrelation Function \tabularnewline
Time lag k & ACF(k) & T-STAT & P-value \tabularnewline
1 & -0.30485 & -2.3416 & 0.011299 \tabularnewline
2 & -0.300176 & -2.3057 & 0.01233 \tabularnewline
3 & 0.036436 & 0.2799 & 0.390278 \tabularnewline
4 & 0.176428 & 1.3552 & 0.090265 \tabularnewline
5 & -0.184095 & -1.4141 & 0.0813 \tabularnewline
6 & 0.136655 & 1.0497 & 0.149076 \tabularnewline
7 & -0.137926 & -1.0594 & 0.14686 \tabularnewline
8 & 0.183283 & 1.4078 & 0.082216 \tabularnewline
9 & 0.024665 & 0.1895 & 0.425193 \tabularnewline
10 & -0.322795 & -2.4794 & 0.008018 \tabularnewline
11 & -0.118171 & -0.9077 & 0.183867 \tabularnewline
12 & 0.638304 & 4.9029 & 4e-06 \tabularnewline
13 & -0.195501 & -1.5017 & 0.069258 \tabularnewline
14 & -0.173242 & -1.3307 & 0.094205 \tabularnewline
15 & -0.023564 & -0.181 & 0.428493 \tabularnewline
16 & 0.1392 & 1.0692 & 0.144664 \tabularnewline
17 & -0.106591 & -0.8187 & 0.208114 \tabularnewline
18 & 0.063423 & 0.4872 & 0.313974 \tabularnewline
19 & -0.075302 & -0.5784 & 0.282595 \tabularnewline
20 & 0.190972 & 1.4669 & 0.073859 \tabularnewline
21 & -0.111038 & -0.8529 & 0.198581 \tabularnewline
22 & -0.189583 & -1.4562 & 0.075317 \tabularnewline
23 & -0.029624 & -0.2275 & 0.410394 \tabularnewline
24 & 0.381576 & 2.9309 & 0.002401 \tabularnewline
25 & -0.094432 & -0.7253 & 0.235554 \tabularnewline
26 & -0.120598 & -0.9263 & 0.179024 \tabularnewline
27 & -0.061081 & -0.4692 & 0.320339 \tabularnewline
28 & 0.193726 & 1.488 & 0.071033 \tabularnewline
29 & -0.154009 & -1.183 & 0.120783 \tabularnewline
30 & 0.011227 & 0.0862 & 0.465786 \tabularnewline
31 & 0.042866 & 0.3293 & 0.371562 \tabularnewline
32 & 0.107945 & 0.8291 & 0.205183 \tabularnewline
33 & -0.097728 & -0.7507 & 0.22792 \tabularnewline
34 & -0.122369 & -0.9399 & 0.175542 \tabularnewline
35 & -0.027814 & -0.2136 & 0.41578 \tabularnewline
36 & 0.223584 & 1.7174 & 0.045577 \tabularnewline
37 & 0.012414 & 0.0954 & 0.462179 \tabularnewline
38 & -0.157461 & -1.2095 & 0.115652 \tabularnewline
39 & -0.018882 & -0.145 & 0.442588 \tabularnewline
40 & 0.192864 & 1.4814 & 0.071908 \tabularnewline
41 & -0.156523 & -1.2023 & 0.11703 \tabularnewline
42 & 0.00098 & 0.0075 & 0.497008 \tabularnewline
43 & 0.078592 & 0.6037 & 0.274187 \tabularnewline
44 & -0.00804 & -0.0618 & 0.475483 \tabularnewline
45 & -0.023389 & -0.1797 & 0.429018 \tabularnewline
46 & -0.059914 & -0.4602 & 0.323528 \tabularnewline
47 & -0.031798 & -0.2442 & 0.403943 \tabularnewline
48 & 0.102108 & 0.7843 & 0.218 \tabularnewline
\hline
\end{tabular}
%Source: https://freestatistics.org/blog/index.php?pk=&T=1

[TABLE]
[ROW][C]Autocorrelation Function[/C][/ROW]
[ROW][C]Time lag k[/C][C]ACF(k)[/C][C]T-STAT[/C][C]P-value[/C][/ROW]
[ROW][C]1[/C][C]-0.30485[/C][C]-2.3416[/C][C]0.011299[/C][/ROW]
[ROW][C]2[/C][C]-0.300176[/C][C]-2.3057[/C][C]0.01233[/C][/ROW]
[ROW][C]3[/C][C]0.036436[/C][C]0.2799[/C][C]0.390278[/C][/ROW]
[ROW][C]4[/C][C]0.176428[/C][C]1.3552[/C][C]0.090265[/C][/ROW]
[ROW][C]5[/C][C]-0.184095[/C][C]-1.4141[/C][C]0.0813[/C][/ROW]
[ROW][C]6[/C][C]0.136655[/C][C]1.0497[/C][C]0.149076[/C][/ROW]
[ROW][C]7[/C][C]-0.137926[/C][C]-1.0594[/C][C]0.14686[/C][/ROW]
[ROW][C]8[/C][C]0.183283[/C][C]1.4078[/C][C]0.082216[/C][/ROW]
[ROW][C]9[/C][C]0.024665[/C][C]0.1895[/C][C]0.425193[/C][/ROW]
[ROW][C]10[/C][C]-0.322795[/C][C]-2.4794[/C][C]0.008018[/C][/ROW]
[ROW][C]11[/C][C]-0.118171[/C][C]-0.9077[/C][C]0.183867[/C][/ROW]
[ROW][C]12[/C][C]0.638304[/C][C]4.9029[/C][C]4e-06[/C][/ROW]
[ROW][C]13[/C][C]-0.195501[/C][C]-1.5017[/C][C]0.069258[/C][/ROW]
[ROW][C]14[/C][C]-0.173242[/C][C]-1.3307[/C][C]0.094205[/C][/ROW]
[ROW][C]15[/C][C]-0.023564[/C][C]-0.181[/C][C]0.428493[/C][/ROW]
[ROW][C]16[/C][C]0.1392[/C][C]1.0692[/C][C]0.144664[/C][/ROW]
[ROW][C]17[/C][C]-0.106591[/C][C]-0.8187[/C][C]0.208114[/C][/ROW]
[ROW][C]18[/C][C]0.063423[/C][C]0.4872[/C][C]0.313974[/C][/ROW]
[ROW][C]19[/C][C]-0.075302[/C][C]-0.5784[/C][C]0.282595[/C][/ROW]
[ROW][C]20[/C][C]0.190972[/C][C]1.4669[/C][C]0.073859[/C][/ROW]
[ROW][C]21[/C][C]-0.111038[/C][C]-0.8529[/C][C]0.198581[/C][/ROW]
[ROW][C]22[/C][C]-0.189583[/C][C]-1.4562[/C][C]0.075317[/C][/ROW]
[ROW][C]23[/C][C]-0.029624[/C][C]-0.2275[/C][C]0.410394[/C][/ROW]
[ROW][C]24[/C][C]0.381576[/C][C]2.9309[/C][C]0.002401[/C][/ROW]
[ROW][C]25[/C][C]-0.094432[/C][C]-0.7253[/C][C]0.235554[/C][/ROW]
[ROW][C]26[/C][C]-0.120598[/C][C]-0.9263[/C][C]0.179024[/C][/ROW]
[ROW][C]27[/C][C]-0.061081[/C][C]-0.4692[/C][C]0.320339[/C][/ROW]
[ROW][C]28[/C][C]0.193726[/C][C]1.488[/C][C]0.071033[/C][/ROW]
[ROW][C]29[/C][C]-0.154009[/C][C]-1.183[/C][C]0.120783[/C][/ROW]
[ROW][C]30[/C][C]0.011227[/C][C]0.0862[/C][C]0.465786[/C][/ROW]
[ROW][C]31[/C][C]0.042866[/C][C]0.3293[/C][C]0.371562[/C][/ROW]
[ROW][C]32[/C][C]0.107945[/C][C]0.8291[/C][C]0.205183[/C][/ROW]
[ROW][C]33[/C][C]-0.097728[/C][C]-0.7507[/C][C]0.22792[/C][/ROW]
[ROW][C]34[/C][C]-0.122369[/C][C]-0.9399[/C][C]0.175542[/C][/ROW]
[ROW][C]35[/C][C]-0.027814[/C][C]-0.2136[/C][C]0.41578[/C][/ROW]
[ROW][C]36[/C][C]0.223584[/C][C]1.7174[/C][C]0.045577[/C][/ROW]
[ROW][C]37[/C][C]0.012414[/C][C]0.0954[/C][C]0.462179[/C][/ROW]
[ROW][C]38[/C][C]-0.157461[/C][C]-1.2095[/C][C]0.115652[/C][/ROW]
[ROW][C]39[/C][C]-0.018882[/C][C]-0.145[/C][C]0.442588[/C][/ROW]
[ROW][C]40[/C][C]0.192864[/C][C]1.4814[/C][C]0.071908[/C][/ROW]
[ROW][C]41[/C][C]-0.156523[/C][C]-1.2023[/C][C]0.11703[/C][/ROW]
[ROW][C]42[/C][C]0.00098[/C][C]0.0075[/C][C]0.497008[/C][/ROW]
[ROW][C]43[/C][C]0.078592[/C][C]0.6037[/C][C]0.274187[/C][/ROW]
[ROW][C]44[/C][C]-0.00804[/C][C]-0.0618[/C][C]0.475483[/C][/ROW]
[ROW][C]45[/C][C]-0.023389[/C][C]-0.1797[/C][C]0.429018[/C][/ROW]
[ROW][C]46[/C][C]-0.059914[/C][C]-0.4602[/C][C]0.323528[/C][/ROW]
[ROW][C]47[/C][C]-0.031798[/C][C]-0.2442[/C][C]0.403943[/C][/ROW]
[ROW][C]48[/C][C]0.102108[/C][C]0.7843[/C][C]0.218[/C][/ROW]
[/TABLE]
Source: https://freestatistics.org/blog/index.php?pk=&T=1

Globally Unique Identifier (entire table): ba.freestatistics.org/blog/index.php?pk=&T=1

As an alternative you can also use a QR Code:  

The GUIDs for individual cells are displayed in the table below:

Autocorrelation Function
Time lag kACF(k)T-STATP-value
1-0.30485-2.34160.011299
2-0.300176-2.30570.01233
30.0364360.27990.390278
40.1764281.35520.090265
5-0.184095-1.41410.0813
60.1366551.04970.149076
7-0.137926-1.05940.14686
80.1832831.40780.082216
90.0246650.18950.425193
10-0.322795-2.47940.008018
11-0.118171-0.90770.183867
120.6383044.90294e-06
13-0.195501-1.50170.069258
14-0.173242-1.33070.094205
15-0.023564-0.1810.428493
160.13921.06920.144664
17-0.106591-0.81870.208114
180.0634230.48720.313974
19-0.075302-0.57840.282595
200.1909721.46690.073859
21-0.111038-0.85290.198581
22-0.189583-1.45620.075317
23-0.029624-0.22750.410394
240.3815762.93090.002401
25-0.094432-0.72530.235554
26-0.120598-0.92630.179024
27-0.061081-0.46920.320339
280.1937261.4880.071033
29-0.154009-1.1830.120783
300.0112270.08620.465786
310.0428660.32930.371562
320.1079450.82910.205183
33-0.097728-0.75070.22792
34-0.122369-0.93990.175542
35-0.027814-0.21360.41578
360.2235841.71740.045577
370.0124140.09540.462179
38-0.157461-1.20950.115652
39-0.018882-0.1450.442588
400.1928641.48140.071908
41-0.156523-1.20230.11703
420.000980.00750.497008
430.0785920.60370.274187
44-0.00804-0.06180.475483
45-0.023389-0.17970.429018
46-0.059914-0.46020.323528
47-0.031798-0.24420.403943
480.1021080.78430.218


Partial Autocorrelation Function
Time lag kPACF(k)T-STATP-value
1-0.30485-2.34160.011299
2-0.433385-3.32890.000753
3-0.307925-2.36520.010663
4-0.100683-0.77340.221199
5-0.296286-2.27580.013251
6-0.006879-0.05280.47902
7-0.283894-2.18060.016605
80.0808480.6210.268494
90.1314451.00970.158393
10-0.31795-2.44220.008806
11-0.490407-3.76690.000192
120.1450221.11390.134912
130.0533950.41010.341596
140.1932281.48420.071538
15-0.023996-0.18430.427198
160.0114390.08790.465141
170.0605480.46510.321793
180.0219080.16830.433471
190.1236050.94940.173138
200.0872210.670.25275
21-0.153699-1.18060.121253
22-0.016002-0.12290.451297
23-0.049414-0.37960.352819
24-0.011674-0.08970.464427
250.0389220.2990.383008
26-0.091455-0.70250.242572
27-0.053076-0.40770.34249
280.1341291.03030.153546
29-0.020985-0.16120.436248
300.0155810.11970.452573
31-0.007236-0.05560.47793
32-0.103383-0.79410.215159
330.167431.28610.101724
340.0228870.17580.430527
350.0530880.40780.342457
36-0.074084-0.56910.285741
37-0.051794-0.39780.346093
380.0180860.13890.444992
39-0.019374-0.14880.441104
400.0051630.03970.48425
410.0186020.14290.443434
42-0.003728-0.02860.488627
430.1122740.86240.195982
44-0.104305-0.80120.21312
45-0.042762-0.32850.371863
46-0.020696-0.1590.437118
470.0605330.4650.321834
48-0.031716-0.24360.404186

\begin{tabular}{lllllllll}
\hline
Partial Autocorrelation Function \tabularnewline
Time lag k & PACF(k) & T-STAT & P-value \tabularnewline
1 & -0.30485 & -2.3416 & 0.011299 \tabularnewline
2 & -0.433385 & -3.3289 & 0.000753 \tabularnewline
3 & -0.307925 & -2.3652 & 0.010663 \tabularnewline
4 & -0.100683 & -0.7734 & 0.221199 \tabularnewline
5 & -0.296286 & -2.2758 & 0.013251 \tabularnewline
6 & -0.006879 & -0.0528 & 0.47902 \tabularnewline
7 & -0.283894 & -2.1806 & 0.016605 \tabularnewline
8 & 0.080848 & 0.621 & 0.268494 \tabularnewline
9 & 0.131445 & 1.0097 & 0.158393 \tabularnewline
10 & -0.31795 & -2.4422 & 0.008806 \tabularnewline
11 & -0.490407 & -3.7669 & 0.000192 \tabularnewline
12 & 0.145022 & 1.1139 & 0.134912 \tabularnewline
13 & 0.053395 & 0.4101 & 0.341596 \tabularnewline
14 & 0.193228 & 1.4842 & 0.071538 \tabularnewline
15 & -0.023996 & -0.1843 & 0.427198 \tabularnewline
16 & 0.011439 & 0.0879 & 0.465141 \tabularnewline
17 & 0.060548 & 0.4651 & 0.321793 \tabularnewline
18 & 0.021908 & 0.1683 & 0.433471 \tabularnewline
19 & 0.123605 & 0.9494 & 0.173138 \tabularnewline
20 & 0.087221 & 0.67 & 0.25275 \tabularnewline
21 & -0.153699 & -1.1806 & 0.121253 \tabularnewline
22 & -0.016002 & -0.1229 & 0.451297 \tabularnewline
23 & -0.049414 & -0.3796 & 0.352819 \tabularnewline
24 & -0.011674 & -0.0897 & 0.464427 \tabularnewline
25 & 0.038922 & 0.299 & 0.383008 \tabularnewline
26 & -0.091455 & -0.7025 & 0.242572 \tabularnewline
27 & -0.053076 & -0.4077 & 0.34249 \tabularnewline
28 & 0.134129 & 1.0303 & 0.153546 \tabularnewline
29 & -0.020985 & -0.1612 & 0.436248 \tabularnewline
30 & 0.015581 & 0.1197 & 0.452573 \tabularnewline
31 & -0.007236 & -0.0556 & 0.47793 \tabularnewline
32 & -0.103383 & -0.7941 & 0.215159 \tabularnewline
33 & 0.16743 & 1.2861 & 0.101724 \tabularnewline
34 & 0.022887 & 0.1758 & 0.430527 \tabularnewline
35 & 0.053088 & 0.4078 & 0.342457 \tabularnewline
36 & -0.074084 & -0.5691 & 0.285741 \tabularnewline
37 & -0.051794 & -0.3978 & 0.346093 \tabularnewline
38 & 0.018086 & 0.1389 & 0.444992 \tabularnewline
39 & -0.019374 & -0.1488 & 0.441104 \tabularnewline
40 & 0.005163 & 0.0397 & 0.48425 \tabularnewline
41 & 0.018602 & 0.1429 & 0.443434 \tabularnewline
42 & -0.003728 & -0.0286 & 0.488627 \tabularnewline
43 & 0.112274 & 0.8624 & 0.195982 \tabularnewline
44 & -0.104305 & -0.8012 & 0.21312 \tabularnewline
45 & -0.042762 & -0.3285 & 0.371863 \tabularnewline
46 & -0.020696 & -0.159 & 0.437118 \tabularnewline
47 & 0.060533 & 0.465 & 0.321834 \tabularnewline
48 & -0.031716 & -0.2436 & 0.404186 \tabularnewline
\hline
\end{tabular}
%Source: https://freestatistics.org/blog/index.php?pk=&T=2

[TABLE]
[ROW][C]Partial Autocorrelation Function[/C][/ROW]
[ROW][C]Time lag k[/C][C]PACF(k)[/C][C]T-STAT[/C][C]P-value[/C][/ROW]
[ROW][C]1[/C][C]-0.30485[/C][C]-2.3416[/C][C]0.011299[/C][/ROW]
[ROW][C]2[/C][C]-0.433385[/C][C]-3.3289[/C][C]0.000753[/C][/ROW]
[ROW][C]3[/C][C]-0.307925[/C][C]-2.3652[/C][C]0.010663[/C][/ROW]
[ROW][C]4[/C][C]-0.100683[/C][C]-0.7734[/C][C]0.221199[/C][/ROW]
[ROW][C]5[/C][C]-0.296286[/C][C]-2.2758[/C][C]0.013251[/C][/ROW]
[ROW][C]6[/C][C]-0.006879[/C][C]-0.0528[/C][C]0.47902[/C][/ROW]
[ROW][C]7[/C][C]-0.283894[/C][C]-2.1806[/C][C]0.016605[/C][/ROW]
[ROW][C]8[/C][C]0.080848[/C][C]0.621[/C][C]0.268494[/C][/ROW]
[ROW][C]9[/C][C]0.131445[/C][C]1.0097[/C][C]0.158393[/C][/ROW]
[ROW][C]10[/C][C]-0.31795[/C][C]-2.4422[/C][C]0.008806[/C][/ROW]
[ROW][C]11[/C][C]-0.490407[/C][C]-3.7669[/C][C]0.000192[/C][/ROW]
[ROW][C]12[/C][C]0.145022[/C][C]1.1139[/C][C]0.134912[/C][/ROW]
[ROW][C]13[/C][C]0.053395[/C][C]0.4101[/C][C]0.341596[/C][/ROW]
[ROW][C]14[/C][C]0.193228[/C][C]1.4842[/C][C]0.071538[/C][/ROW]
[ROW][C]15[/C][C]-0.023996[/C][C]-0.1843[/C][C]0.427198[/C][/ROW]
[ROW][C]16[/C][C]0.011439[/C][C]0.0879[/C][C]0.465141[/C][/ROW]
[ROW][C]17[/C][C]0.060548[/C][C]0.4651[/C][C]0.321793[/C][/ROW]
[ROW][C]18[/C][C]0.021908[/C][C]0.1683[/C][C]0.433471[/C][/ROW]
[ROW][C]19[/C][C]0.123605[/C][C]0.9494[/C][C]0.173138[/C][/ROW]
[ROW][C]20[/C][C]0.087221[/C][C]0.67[/C][C]0.25275[/C][/ROW]
[ROW][C]21[/C][C]-0.153699[/C][C]-1.1806[/C][C]0.121253[/C][/ROW]
[ROW][C]22[/C][C]-0.016002[/C][C]-0.1229[/C][C]0.451297[/C][/ROW]
[ROW][C]23[/C][C]-0.049414[/C][C]-0.3796[/C][C]0.352819[/C][/ROW]
[ROW][C]24[/C][C]-0.011674[/C][C]-0.0897[/C][C]0.464427[/C][/ROW]
[ROW][C]25[/C][C]0.038922[/C][C]0.299[/C][C]0.383008[/C][/ROW]
[ROW][C]26[/C][C]-0.091455[/C][C]-0.7025[/C][C]0.242572[/C][/ROW]
[ROW][C]27[/C][C]-0.053076[/C][C]-0.4077[/C][C]0.34249[/C][/ROW]
[ROW][C]28[/C][C]0.134129[/C][C]1.0303[/C][C]0.153546[/C][/ROW]
[ROW][C]29[/C][C]-0.020985[/C][C]-0.1612[/C][C]0.436248[/C][/ROW]
[ROW][C]30[/C][C]0.015581[/C][C]0.1197[/C][C]0.452573[/C][/ROW]
[ROW][C]31[/C][C]-0.007236[/C][C]-0.0556[/C][C]0.47793[/C][/ROW]
[ROW][C]32[/C][C]-0.103383[/C][C]-0.7941[/C][C]0.215159[/C][/ROW]
[ROW][C]33[/C][C]0.16743[/C][C]1.2861[/C][C]0.101724[/C][/ROW]
[ROW][C]34[/C][C]0.022887[/C][C]0.1758[/C][C]0.430527[/C][/ROW]
[ROW][C]35[/C][C]0.053088[/C][C]0.4078[/C][C]0.342457[/C][/ROW]
[ROW][C]36[/C][C]-0.074084[/C][C]-0.5691[/C][C]0.285741[/C][/ROW]
[ROW][C]37[/C][C]-0.051794[/C][C]-0.3978[/C][C]0.346093[/C][/ROW]
[ROW][C]38[/C][C]0.018086[/C][C]0.1389[/C][C]0.444992[/C][/ROW]
[ROW][C]39[/C][C]-0.019374[/C][C]-0.1488[/C][C]0.441104[/C][/ROW]
[ROW][C]40[/C][C]0.005163[/C][C]0.0397[/C][C]0.48425[/C][/ROW]
[ROW][C]41[/C][C]0.018602[/C][C]0.1429[/C][C]0.443434[/C][/ROW]
[ROW][C]42[/C][C]-0.003728[/C][C]-0.0286[/C][C]0.488627[/C][/ROW]
[ROW][C]43[/C][C]0.112274[/C][C]0.8624[/C][C]0.195982[/C][/ROW]
[ROW][C]44[/C][C]-0.104305[/C][C]-0.8012[/C][C]0.21312[/C][/ROW]
[ROW][C]45[/C][C]-0.042762[/C][C]-0.3285[/C][C]0.371863[/C][/ROW]
[ROW][C]46[/C][C]-0.020696[/C][C]-0.159[/C][C]0.437118[/C][/ROW]
[ROW][C]47[/C][C]0.060533[/C][C]0.465[/C][C]0.321834[/C][/ROW]
[ROW][C]48[/C][C]-0.031716[/C][C]-0.2436[/C][C]0.404186[/C][/ROW]
[/TABLE]
Source: https://freestatistics.org/blog/index.php?pk=&T=2

Globally Unique Identifier (entire table): ba.freestatistics.org/blog/index.php?pk=&T=2

As an alternative you can also use a QR Code:  

The GUIDs for individual cells are displayed in the table below:

Partial Autocorrelation Function
Time lag kPACF(k)T-STATP-value
1-0.30485-2.34160.011299
2-0.433385-3.32890.000753
3-0.307925-2.36520.010663
4-0.100683-0.77340.221199
5-0.296286-2.27580.013251
6-0.006879-0.05280.47902
7-0.283894-2.18060.016605
80.0808480.6210.268494
90.1314451.00970.158393
10-0.31795-2.44220.008806
11-0.490407-3.76690.000192
120.1450221.11390.134912
130.0533950.41010.341596
140.1932281.48420.071538
15-0.023996-0.18430.427198
160.0114390.08790.465141
170.0605480.46510.321793
180.0219080.16830.433471
190.1236050.94940.173138
200.0872210.670.25275
21-0.153699-1.18060.121253
22-0.016002-0.12290.451297
23-0.049414-0.37960.352819
24-0.011674-0.08970.464427
250.0389220.2990.383008
26-0.091455-0.70250.242572
27-0.053076-0.40770.34249
280.1341291.03030.153546
29-0.020985-0.16120.436248
300.0155810.11970.452573
31-0.007236-0.05560.47793
32-0.103383-0.79410.215159
330.167431.28610.101724
340.0228870.17580.430527
350.0530880.40780.342457
36-0.074084-0.56910.285741
37-0.051794-0.39780.346093
380.0180860.13890.444992
39-0.019374-0.14880.441104
400.0051630.03970.48425
410.0186020.14290.443434
42-0.003728-0.02860.488627
430.1122740.86240.195982
44-0.104305-0.80120.21312
45-0.042762-0.32850.371863
46-0.020696-0.1590.437118
470.0605330.4650.321834
48-0.031716-0.24360.404186


Parameters (Session):
par1 = 48 ; par2 = 1 ; par3 = 1 ; par4 = 0 ; par5 = 12 ; par6 = White Noise ; par7 = 0.95 ;
Parameters (R input):
par1 = 48 ; par2 = 1 ; par3 = 1 ; par4 = 0 ; par5 = 12 ; par6 = White Noise ; par7 = 0.95 ; par8 = ;
R code (references can be found in the software module):
par8 <- ''
par7 <- '0.95'
par6 <- 'White Noise'
par5 <- '12'
par4 <- '0'
par3 <- '0'
par2 <- '1'
par1 <- '48'
if (par1 == 'Default') {
par1 = 10*log10(length(x))
} else {
par1 <- as.numeric(par1)
}
par2 <- as.numeric(par2)
par3 <- as.numeric(par3)
par4 <- as.numeric(par4)
par5 <- as.numeric(par5)
if (par6 == 'White Noise') par6 <- 'white' else par6 <- 'ma'
par7 <- as.numeric(par7)
if (par8 != '') par8 <- as.numeric(par8)
x <- na.omit(x)
ox <- x
if (par8 == '') {
if (par2 == 0) {
x <- log(x)
} else {
x <- (x ^ par2 - 1) / par2
}
} else {
x <- log(x,base=par8)
}
if (par3 > 0) x <- diff(x,lag=1,difference=par3)
if (par4 > 0) x <- diff(x,lag=par5,difference=par4)
bitmap(file='picts.png')
op <- par(mfrow=c(2,1))
plot(ox,type='l',main='Original Time Series',xlab='time',ylab='value')
if (par8=='') {
mytitle <- paste('Working Time Series (lambda=',par2,', d=',par3,', D=',par4,')',sep='')
mysub <- paste('(lambda=',par2,', d=',par3,', D=',par4,', CI=', par7, ', CI type=',par6,')',sep='')
} else {
mytitle <- paste('Working Time Series (base=',par8,', d=',par3,', D=',par4,')',sep='')
mysub <- paste('(base=',par8,', d=',par3,', D=',par4,', CI=', par7, ', CI type=',par6,')',sep='')
}
plot(x,type='l', main=mytitle,xlab='time',ylab='value')
par(op)
dev.off()
bitmap(file='pic1.png')
racf <- acf(x, par1, main='Autocorrelation', xlab='time lag', ylab='ACF', ci.type=par6, ci=par7, sub=mysub)
dev.off()
bitmap(file='pic2.png')
rpacf <- pacf(x,par1,main='Partial Autocorrelation',xlab='lags',ylab='PACF',sub=mysub)
dev.off()
(myacf <- c(racf$acf))
(mypacf <- c(rpacf$acf))
lengthx <- length(x)
sqrtn <- sqrt(lengthx)
load(file='createtable')
a<-table.start()
a<-table.row.start(a)
a<-table.element(a,'Autocorrelation Function',4,TRUE)
a<-table.row.end(a)
a<-table.row.start(a)
a<-table.element(a,'Time lag k',header=TRUE)
a<-table.element(a,hyperlink('basics.htm','ACF(k)','click here for more information about the Autocorrelation Function'),header=TRUE)
a<-table.element(a,'T-STAT',header=TRUE)
a<-table.element(a,'P-value',header=TRUE)
a<-table.row.end(a)
for (i in 2:(par1+1)) {
a<-table.row.start(a)
a<-table.element(a,i-1,header=TRUE)
a<-table.element(a,round(myacf[i],6))
mytstat <- myacf[i]*sqrtn
a<-table.element(a,round(mytstat,4))
a<-table.element(a,round(1-pt(abs(mytstat),lengthx),6))
a<-table.row.end(a)
}
a<-table.end(a)
table.save(a,file='mytable.tab')
a<-table.start()
a<-table.row.start(a)
a<-table.element(a,'Partial Autocorrelation Function',4,TRUE)
a<-table.row.end(a)
a<-table.row.start(a)
a<-table.element(a,'Time lag k',header=TRUE)
a<-table.element(a,hyperlink('basics.htm','PACF(k)','click here for more information about the Partial Autocorrelation Function'),header=TRUE)
a<-table.element(a,'T-STAT',header=TRUE)
a<-table.element(a,'P-value',header=TRUE)
a<-table.row.end(a)
for (i in 1:par1) {
a<-table.row.start(a)
a<-table.element(a,i,header=TRUE)
a<-table.element(a,round(mypacf[i],6))
mytstat <- mypacf[i]*sqrtn
a<-table.element(a,round(mytstat,4))
a<-table.element(a,round(1-pt(abs(mytstat),lengthx),6))
a<-table.row.end(a)
}
a<-table.end(a)
table.save(a,file='mytable1.tab')