Free Statistics

of Irreproducible Research!

Author's title

Author*Unverified author*
R Software Modulerwasp_autocorrelation.wasp
Title produced by software(Partial) Autocorrelation Function
Date of computationThu, 20 Oct 2016 22:08:54 +0100
Cite this page as followsStatistical Computations at FreeStatistics.org, Office for Research Development and Education, URL https://freestatistics.org/blog/index.php?v=date/2016/Oct/20/t147699777271oo1204y4ucs8r.htm/, Retrieved Sat, 04 May 2024 23:38:07 +0200
Statistical Computations at FreeStatistics.org, Office for Research Development and Education, URL https://freestatistics.org/blog/index.php?pk=, Retrieved Sat, 04 May 2024 23:38:07 +0200
QR Codes:

Original text written by user:
IsPrivate?No (this computation is public)
User-defined keywords
Estimated Impact0
Dataseries X:
1,336
1,3649
1,3999
1,4442
1,4349
1,4388
1,4264
1,4343
1,377
1,3706
1,3556
1,3179
1,2905
1,3224
1,3201
1,3162
1,2789
1,2526
1,2288
1,24
1,2856
1,2974
1,2828
1,3119
1,3288
1,3359
1,2964
1,3026
1,2982
1,3189
1,308
1,331
1,3348
1,3635
1,3493
1,3704
1,361
1,3658
1,3823
1,3812
1,3732
1,3592
1,3539
1,3316
1,2901
1,2673
1,2472
1,2331
1,1621
1,135
1,0838
1,0779
1,115
1,1213
1,0996
1,1139
1,1221
1,1235
1,0736
1,0877


Summary of computational transaction
Raw Inputview raw input (R code)
Raw Outputview raw output of R engine
Computing time1 seconds
R Server'Gertrude Mary Cox' @ cox.wessa.net

\begin{tabular}{lllllllll}
\hline
Summary of computational transaction \tabularnewline
Raw Input & view raw input (R code)  \tabularnewline
Raw Output & view raw output of R engine  \tabularnewline
Computing time & 1 seconds \tabularnewline
R Server & 'Gertrude Mary Cox' @ cox.wessa.net \tabularnewline
\hline
\end{tabular}
%Source: https://freestatistics.org/blog/index.php?pk=&T=0

[TABLE]
[ROW][C]Summary of computational transaction[/C][/ROW]
[ROW][C]Raw Input[/C][C]view raw input (R code) [/C][/ROW]
[ROW][C]Raw Output[/C][C]view raw output of R engine [/C][/ROW]
[ROW][C]Computing time[/C][C]1 seconds[/C][/ROW]
[ROW][C]R Server[/C][C]'Gertrude Mary Cox' @ cox.wessa.net[/C][/ROW]
[/TABLE]
Source: https://freestatistics.org/blog/index.php?pk=&T=0

Globally Unique Identifier (entire table): ba.freestatistics.org/blog/index.php?pk=&T=0

As an alternative you can also use a QR Code:  

The GUIDs for individual cells are displayed in the table below:

Summary of computational transaction
Raw Inputview raw input (R code)
Raw Outputview raw output of R engine
Computing time1 seconds
R Server'Gertrude Mary Cox' @ cox.wessa.net


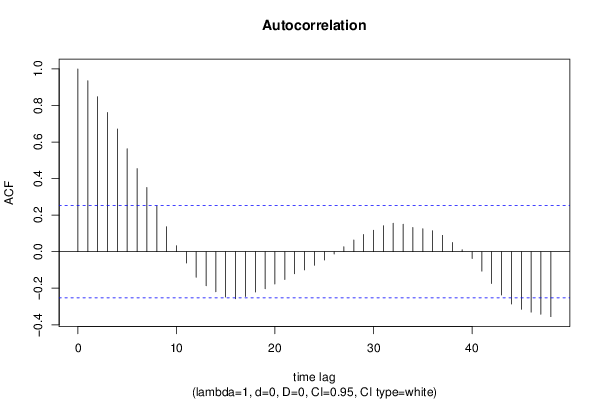
Autocorrelation Function
Time lag kACF(k)T-STATP-value
10.9351097.24330
20.8478996.56780
30.7618965.90160
40.6712565.19951e-06
50.5633324.36352.6e-05
60.4544143.51990.000415
70.3516752.72410.004217
80.2496531.93380.028929
90.1366781.05870.146989
100.0326890.25320.400487
11-0.062337-0.48290.315476
12-0.139623-1.08150.141898
13-0.186199-1.44230.077211
14-0.21971-1.70190.046979
15-0.248389-1.9240.02955
16-0.258114-1.99930.025053
17-0.245729-1.90340.030894
18-0.220557-1.70840.046363
19-0.202569-1.56910.060942
20-0.176731-1.3690.088058
21-0.152496-1.18120.121086
22-0.120552-0.93380.177077
23-0.099882-0.77370.221078
24-0.074134-0.57420.283977
25-0.04569-0.35390.362321
26-0.012544-0.09720.461459
270.0274160.21240.416271
280.0642930.4980.310149
290.0942530.73010.234091
300.1171250.90720.183954
310.1420091.10.137864
320.1552921.20290.116873
330.1500461.16230.124867
340.132721.0280.154027
350.1255390.97240.167372
360.1142970.88530.189755
370.0891160.69030.246336
380.0498210.38590.350465
390.0108650.08420.466606
40-0.037393-0.28960.386544
41-0.106418-0.82430.206515
42-0.174062-1.34830.091318
43-0.237493-1.83960.035387
44-0.286481-2.21910.015138
45-0.315111-2.44080.008811
46-0.330911-2.56320.006448
47-0.342468-2.65270.005101
48-0.355666-2.7550.00388

\begin{tabular}{lllllllll}
\hline
Autocorrelation Function \tabularnewline
Time lag k & ACF(k) & T-STAT & P-value \tabularnewline
1 & 0.935109 & 7.2433 & 0 \tabularnewline
2 & 0.847899 & 6.5678 & 0 \tabularnewline
3 & 0.761896 & 5.9016 & 0 \tabularnewline
4 & 0.671256 & 5.1995 & 1e-06 \tabularnewline
5 & 0.563332 & 4.3635 & 2.6e-05 \tabularnewline
6 & 0.454414 & 3.5199 & 0.000415 \tabularnewline
7 & 0.351675 & 2.7241 & 0.004217 \tabularnewline
8 & 0.249653 & 1.9338 & 0.028929 \tabularnewline
9 & 0.136678 & 1.0587 & 0.146989 \tabularnewline
10 & 0.032689 & 0.2532 & 0.400487 \tabularnewline
11 & -0.062337 & -0.4829 & 0.315476 \tabularnewline
12 & -0.139623 & -1.0815 & 0.141898 \tabularnewline
13 & -0.186199 & -1.4423 & 0.077211 \tabularnewline
14 & -0.21971 & -1.7019 & 0.046979 \tabularnewline
15 & -0.248389 & -1.924 & 0.02955 \tabularnewline
16 & -0.258114 & -1.9993 & 0.025053 \tabularnewline
17 & -0.245729 & -1.9034 & 0.030894 \tabularnewline
18 & -0.220557 & -1.7084 & 0.046363 \tabularnewline
19 & -0.202569 & -1.5691 & 0.060942 \tabularnewline
20 & -0.176731 & -1.369 & 0.088058 \tabularnewline
21 & -0.152496 & -1.1812 & 0.121086 \tabularnewline
22 & -0.120552 & -0.9338 & 0.177077 \tabularnewline
23 & -0.099882 & -0.7737 & 0.221078 \tabularnewline
24 & -0.074134 & -0.5742 & 0.283977 \tabularnewline
25 & -0.04569 & -0.3539 & 0.362321 \tabularnewline
26 & -0.012544 & -0.0972 & 0.461459 \tabularnewline
27 & 0.027416 & 0.2124 & 0.416271 \tabularnewline
28 & 0.064293 & 0.498 & 0.310149 \tabularnewline
29 & 0.094253 & 0.7301 & 0.234091 \tabularnewline
30 & 0.117125 & 0.9072 & 0.183954 \tabularnewline
31 & 0.142009 & 1.1 & 0.137864 \tabularnewline
32 & 0.155292 & 1.2029 & 0.116873 \tabularnewline
33 & 0.150046 & 1.1623 & 0.124867 \tabularnewline
34 & 0.13272 & 1.028 & 0.154027 \tabularnewline
35 & 0.125539 & 0.9724 & 0.167372 \tabularnewline
36 & 0.114297 & 0.8853 & 0.189755 \tabularnewline
37 & 0.089116 & 0.6903 & 0.246336 \tabularnewline
38 & 0.049821 & 0.3859 & 0.350465 \tabularnewline
39 & 0.010865 & 0.0842 & 0.466606 \tabularnewline
40 & -0.037393 & -0.2896 & 0.386544 \tabularnewline
41 & -0.106418 & -0.8243 & 0.206515 \tabularnewline
42 & -0.174062 & -1.3483 & 0.091318 \tabularnewline
43 & -0.237493 & -1.8396 & 0.035387 \tabularnewline
44 & -0.286481 & -2.2191 & 0.015138 \tabularnewline
45 & -0.315111 & -2.4408 & 0.008811 \tabularnewline
46 & -0.330911 & -2.5632 & 0.006448 \tabularnewline
47 & -0.342468 & -2.6527 & 0.005101 \tabularnewline
48 & -0.355666 & -2.755 & 0.00388 \tabularnewline
\hline
\end{tabular}
%Source: https://freestatistics.org/blog/index.php?pk=&T=1

[TABLE]
[ROW][C]Autocorrelation Function[/C][/ROW]
[ROW][C]Time lag k[/C][C]ACF(k)[/C][C]T-STAT[/C][C]P-value[/C][/ROW]
[ROW][C]1[/C][C]0.935109[/C][C]7.2433[/C][C]0[/C][/ROW]
[ROW][C]2[/C][C]0.847899[/C][C]6.5678[/C][C]0[/C][/ROW]
[ROW][C]3[/C][C]0.761896[/C][C]5.9016[/C][C]0[/C][/ROW]
[ROW][C]4[/C][C]0.671256[/C][C]5.1995[/C][C]1e-06[/C][/ROW]
[ROW][C]5[/C][C]0.563332[/C][C]4.3635[/C][C]2.6e-05[/C][/ROW]
[ROW][C]6[/C][C]0.454414[/C][C]3.5199[/C][C]0.000415[/C][/ROW]
[ROW][C]7[/C][C]0.351675[/C][C]2.7241[/C][C]0.004217[/C][/ROW]
[ROW][C]8[/C][C]0.249653[/C][C]1.9338[/C][C]0.028929[/C][/ROW]
[ROW][C]9[/C][C]0.136678[/C][C]1.0587[/C][C]0.146989[/C][/ROW]
[ROW][C]10[/C][C]0.032689[/C][C]0.2532[/C][C]0.400487[/C][/ROW]
[ROW][C]11[/C][C]-0.062337[/C][C]-0.4829[/C][C]0.315476[/C][/ROW]
[ROW][C]12[/C][C]-0.139623[/C][C]-1.0815[/C][C]0.141898[/C][/ROW]
[ROW][C]13[/C][C]-0.186199[/C][C]-1.4423[/C][C]0.077211[/C][/ROW]
[ROW][C]14[/C][C]-0.21971[/C][C]-1.7019[/C][C]0.046979[/C][/ROW]
[ROW][C]15[/C][C]-0.248389[/C][C]-1.924[/C][C]0.02955[/C][/ROW]
[ROW][C]16[/C][C]-0.258114[/C][C]-1.9993[/C][C]0.025053[/C][/ROW]
[ROW][C]17[/C][C]-0.245729[/C][C]-1.9034[/C][C]0.030894[/C][/ROW]
[ROW][C]18[/C][C]-0.220557[/C][C]-1.7084[/C][C]0.046363[/C][/ROW]
[ROW][C]19[/C][C]-0.202569[/C][C]-1.5691[/C][C]0.060942[/C][/ROW]
[ROW][C]20[/C][C]-0.176731[/C][C]-1.369[/C][C]0.088058[/C][/ROW]
[ROW][C]21[/C][C]-0.152496[/C][C]-1.1812[/C][C]0.121086[/C][/ROW]
[ROW][C]22[/C][C]-0.120552[/C][C]-0.9338[/C][C]0.177077[/C][/ROW]
[ROW][C]23[/C][C]-0.099882[/C][C]-0.7737[/C][C]0.221078[/C][/ROW]
[ROW][C]24[/C][C]-0.074134[/C][C]-0.5742[/C][C]0.283977[/C][/ROW]
[ROW][C]25[/C][C]-0.04569[/C][C]-0.3539[/C][C]0.362321[/C][/ROW]
[ROW][C]26[/C][C]-0.012544[/C][C]-0.0972[/C][C]0.461459[/C][/ROW]
[ROW][C]27[/C][C]0.027416[/C][C]0.2124[/C][C]0.416271[/C][/ROW]
[ROW][C]28[/C][C]0.064293[/C][C]0.498[/C][C]0.310149[/C][/ROW]
[ROW][C]29[/C][C]0.094253[/C][C]0.7301[/C][C]0.234091[/C][/ROW]
[ROW][C]30[/C][C]0.117125[/C][C]0.9072[/C][C]0.183954[/C][/ROW]
[ROW][C]31[/C][C]0.142009[/C][C]1.1[/C][C]0.137864[/C][/ROW]
[ROW][C]32[/C][C]0.155292[/C][C]1.2029[/C][C]0.116873[/C][/ROW]
[ROW][C]33[/C][C]0.150046[/C][C]1.1623[/C][C]0.124867[/C][/ROW]
[ROW][C]34[/C][C]0.13272[/C][C]1.028[/C][C]0.154027[/C][/ROW]
[ROW][C]35[/C][C]0.125539[/C][C]0.9724[/C][C]0.167372[/C][/ROW]
[ROW][C]36[/C][C]0.114297[/C][C]0.8853[/C][C]0.189755[/C][/ROW]
[ROW][C]37[/C][C]0.089116[/C][C]0.6903[/C][C]0.246336[/C][/ROW]
[ROW][C]38[/C][C]0.049821[/C][C]0.3859[/C][C]0.350465[/C][/ROW]
[ROW][C]39[/C][C]0.010865[/C][C]0.0842[/C][C]0.466606[/C][/ROW]
[ROW][C]40[/C][C]-0.037393[/C][C]-0.2896[/C][C]0.386544[/C][/ROW]
[ROW][C]41[/C][C]-0.106418[/C][C]-0.8243[/C][C]0.206515[/C][/ROW]
[ROW][C]42[/C][C]-0.174062[/C][C]-1.3483[/C][C]0.091318[/C][/ROW]
[ROW][C]43[/C][C]-0.237493[/C][C]-1.8396[/C][C]0.035387[/C][/ROW]
[ROW][C]44[/C][C]-0.286481[/C][C]-2.2191[/C][C]0.015138[/C][/ROW]
[ROW][C]45[/C][C]-0.315111[/C][C]-2.4408[/C][C]0.008811[/C][/ROW]
[ROW][C]46[/C][C]-0.330911[/C][C]-2.5632[/C][C]0.006448[/C][/ROW]
[ROW][C]47[/C][C]-0.342468[/C][C]-2.6527[/C][C]0.005101[/C][/ROW]
[ROW][C]48[/C][C]-0.355666[/C][C]-2.755[/C][C]0.00388[/C][/ROW]
[/TABLE]
Source: https://freestatistics.org/blog/index.php?pk=&T=1

Globally Unique Identifier (entire table): ba.freestatistics.org/blog/index.php?pk=&T=1

As an alternative you can also use a QR Code:  

The GUIDs for individual cells are displayed in the table below:

Autocorrelation Function
Time lag kACF(k)T-STATP-value
10.9351097.24330
20.8478996.56780
30.7618965.90160
40.6712565.19951e-06
50.5633324.36352.6e-05
60.4544143.51990.000415
70.3516752.72410.004217
80.2496531.93380.028929
90.1366781.05870.146989
100.0326890.25320.400487
11-0.062337-0.48290.315476
12-0.139623-1.08150.141898
13-0.186199-1.44230.077211
14-0.21971-1.70190.046979
15-0.248389-1.9240.02955
16-0.258114-1.99930.025053
17-0.245729-1.90340.030894
18-0.220557-1.70840.046363
19-0.202569-1.56910.060942
20-0.176731-1.3690.088058
21-0.152496-1.18120.121086
22-0.120552-0.93380.177077
23-0.099882-0.77370.221078
24-0.074134-0.57420.283977
25-0.04569-0.35390.362321
26-0.012544-0.09720.461459
270.0274160.21240.416271
280.0642930.4980.310149
290.0942530.73010.234091
300.1171250.90720.183954
310.1420091.10.137864
320.1552921.20290.116873
330.1500461.16230.124867
340.132721.0280.154027
350.1255390.97240.167372
360.1142970.88530.189755
370.0891160.69030.246336
380.0498210.38590.350465
390.0108650.08420.466606
40-0.037393-0.28960.386544
41-0.106418-0.82430.206515
42-0.174062-1.34830.091318
43-0.237493-1.83960.035387
44-0.286481-2.21910.015138
45-0.315111-2.44080.008811
46-0.330911-2.56320.006448
47-0.342468-2.65270.005101
48-0.355666-2.7550.00388


Partial Autocorrelation Function
Time lag kPACF(k)T-STATP-value
10.9351097.24330
2-0.211274-1.63650.053483
3-0.007769-0.06020.476108
4-0.096121-0.74450.229726
5-0.185067-1.43350.078449
6-0.037254-0.28860.386953
7-0.035265-0.27320.392833
8-0.078866-0.61090.271788
9-0.159594-1.23620.110599
100.0002910.00230.499105
11-0.066389-0.51420.304485
120.0479350.37130.355859
130.1645681.27470.103658
14-0.041948-0.32490.373183
15-0.044287-0.3430.366382
160.0757570.58680.279765
170.0611440.47360.318745
180.0290480.2250.411369
19-0.095247-0.73780.231763
200.0117020.09060.46404
21-0.138395-1.0720.144006
220.0853680.66130.255488
23-0.102196-0.79160.215853
240.066940.51850.303002
250.0290610.22510.411332
260.0414490.32110.37464
270.134291.04020.151209
280.0058890.04560.481883
290.0574260.44480.329026
30-0.060082-0.46540.321668
310.0641350.49680.310576
32-0.103839-0.80430.21219
33-0.117286-0.90850.183626
34-0.070066-0.54270.294662
350.0358670.27780.391051
36-0.020553-0.15920.437023
37-0.044512-0.34480.36573
38-0.076418-0.59190.278061
390.0341660.26460.396094
40-0.10176-0.78820.216832
41-0.099078-0.76750.22291
42-0.000162-0.00130.499502
43-0.036461-0.28240.389294
440.0367980.2850.3883
450.0944770.73180.233564
460.025950.2010.420687
47-0.043726-0.33870.36801
48-0.082337-0.63780.263022

\begin{tabular}{lllllllll}
\hline
Partial Autocorrelation Function \tabularnewline
Time lag k & PACF(k) & T-STAT & P-value \tabularnewline
1 & 0.935109 & 7.2433 & 0 \tabularnewline
2 & -0.211274 & -1.6365 & 0.053483 \tabularnewline
3 & -0.007769 & -0.0602 & 0.476108 \tabularnewline
4 & -0.096121 & -0.7445 & 0.229726 \tabularnewline
5 & -0.185067 & -1.4335 & 0.078449 \tabularnewline
6 & -0.037254 & -0.2886 & 0.386953 \tabularnewline
7 & -0.035265 & -0.2732 & 0.392833 \tabularnewline
8 & -0.078866 & -0.6109 & 0.271788 \tabularnewline
9 & -0.159594 & -1.2362 & 0.110599 \tabularnewline
10 & 0.000291 & 0.0023 & 0.499105 \tabularnewline
11 & -0.066389 & -0.5142 & 0.304485 \tabularnewline
12 & 0.047935 & 0.3713 & 0.355859 \tabularnewline
13 & 0.164568 & 1.2747 & 0.103658 \tabularnewline
14 & -0.041948 & -0.3249 & 0.373183 \tabularnewline
15 & -0.044287 & -0.343 & 0.366382 \tabularnewline
16 & 0.075757 & 0.5868 & 0.279765 \tabularnewline
17 & 0.061144 & 0.4736 & 0.318745 \tabularnewline
18 & 0.029048 & 0.225 & 0.411369 \tabularnewline
19 & -0.095247 & -0.7378 & 0.231763 \tabularnewline
20 & 0.011702 & 0.0906 & 0.46404 \tabularnewline
21 & -0.138395 & -1.072 & 0.144006 \tabularnewline
22 & 0.085368 & 0.6613 & 0.255488 \tabularnewline
23 & -0.102196 & -0.7916 & 0.215853 \tabularnewline
24 & 0.06694 & 0.5185 & 0.303002 \tabularnewline
25 & 0.029061 & 0.2251 & 0.411332 \tabularnewline
26 & 0.041449 & 0.3211 & 0.37464 \tabularnewline
27 & 0.13429 & 1.0402 & 0.151209 \tabularnewline
28 & 0.005889 & 0.0456 & 0.481883 \tabularnewline
29 & 0.057426 & 0.4448 & 0.329026 \tabularnewline
30 & -0.060082 & -0.4654 & 0.321668 \tabularnewline
31 & 0.064135 & 0.4968 & 0.310576 \tabularnewline
32 & -0.103839 & -0.8043 & 0.21219 \tabularnewline
33 & -0.117286 & -0.9085 & 0.183626 \tabularnewline
34 & -0.070066 & -0.5427 & 0.294662 \tabularnewline
35 & 0.035867 & 0.2778 & 0.391051 \tabularnewline
36 & -0.020553 & -0.1592 & 0.437023 \tabularnewline
37 & -0.044512 & -0.3448 & 0.36573 \tabularnewline
38 & -0.076418 & -0.5919 & 0.278061 \tabularnewline
39 & 0.034166 & 0.2646 & 0.396094 \tabularnewline
40 & -0.10176 & -0.7882 & 0.216832 \tabularnewline
41 & -0.099078 & -0.7675 & 0.22291 \tabularnewline
42 & -0.000162 & -0.0013 & 0.499502 \tabularnewline
43 & -0.036461 & -0.2824 & 0.389294 \tabularnewline
44 & 0.036798 & 0.285 & 0.3883 \tabularnewline
45 & 0.094477 & 0.7318 & 0.233564 \tabularnewline
46 & 0.02595 & 0.201 & 0.420687 \tabularnewline
47 & -0.043726 & -0.3387 & 0.36801 \tabularnewline
48 & -0.082337 & -0.6378 & 0.263022 \tabularnewline
\hline
\end{tabular}
%Source: https://freestatistics.org/blog/index.php?pk=&T=2

[TABLE]
[ROW][C]Partial Autocorrelation Function[/C][/ROW]
[ROW][C]Time lag k[/C][C]PACF(k)[/C][C]T-STAT[/C][C]P-value[/C][/ROW]
[ROW][C]1[/C][C]0.935109[/C][C]7.2433[/C][C]0[/C][/ROW]
[ROW][C]2[/C][C]-0.211274[/C][C]-1.6365[/C][C]0.053483[/C][/ROW]
[ROW][C]3[/C][C]-0.007769[/C][C]-0.0602[/C][C]0.476108[/C][/ROW]
[ROW][C]4[/C][C]-0.096121[/C][C]-0.7445[/C][C]0.229726[/C][/ROW]
[ROW][C]5[/C][C]-0.185067[/C][C]-1.4335[/C][C]0.078449[/C][/ROW]
[ROW][C]6[/C][C]-0.037254[/C][C]-0.2886[/C][C]0.386953[/C][/ROW]
[ROW][C]7[/C][C]-0.035265[/C][C]-0.2732[/C][C]0.392833[/C][/ROW]
[ROW][C]8[/C][C]-0.078866[/C][C]-0.6109[/C][C]0.271788[/C][/ROW]
[ROW][C]9[/C][C]-0.159594[/C][C]-1.2362[/C][C]0.110599[/C][/ROW]
[ROW][C]10[/C][C]0.000291[/C][C]0.0023[/C][C]0.499105[/C][/ROW]
[ROW][C]11[/C][C]-0.066389[/C][C]-0.5142[/C][C]0.304485[/C][/ROW]
[ROW][C]12[/C][C]0.047935[/C][C]0.3713[/C][C]0.355859[/C][/ROW]
[ROW][C]13[/C][C]0.164568[/C][C]1.2747[/C][C]0.103658[/C][/ROW]
[ROW][C]14[/C][C]-0.041948[/C][C]-0.3249[/C][C]0.373183[/C][/ROW]
[ROW][C]15[/C][C]-0.044287[/C][C]-0.343[/C][C]0.366382[/C][/ROW]
[ROW][C]16[/C][C]0.075757[/C][C]0.5868[/C][C]0.279765[/C][/ROW]
[ROW][C]17[/C][C]0.061144[/C][C]0.4736[/C][C]0.318745[/C][/ROW]
[ROW][C]18[/C][C]0.029048[/C][C]0.225[/C][C]0.411369[/C][/ROW]
[ROW][C]19[/C][C]-0.095247[/C][C]-0.7378[/C][C]0.231763[/C][/ROW]
[ROW][C]20[/C][C]0.011702[/C][C]0.0906[/C][C]0.46404[/C][/ROW]
[ROW][C]21[/C][C]-0.138395[/C][C]-1.072[/C][C]0.144006[/C][/ROW]
[ROW][C]22[/C][C]0.085368[/C][C]0.6613[/C][C]0.255488[/C][/ROW]
[ROW][C]23[/C][C]-0.102196[/C][C]-0.7916[/C][C]0.215853[/C][/ROW]
[ROW][C]24[/C][C]0.06694[/C][C]0.5185[/C][C]0.303002[/C][/ROW]
[ROW][C]25[/C][C]0.029061[/C][C]0.2251[/C][C]0.411332[/C][/ROW]
[ROW][C]26[/C][C]0.041449[/C][C]0.3211[/C][C]0.37464[/C][/ROW]
[ROW][C]27[/C][C]0.13429[/C][C]1.0402[/C][C]0.151209[/C][/ROW]
[ROW][C]28[/C][C]0.005889[/C][C]0.0456[/C][C]0.481883[/C][/ROW]
[ROW][C]29[/C][C]0.057426[/C][C]0.4448[/C][C]0.329026[/C][/ROW]
[ROW][C]30[/C][C]-0.060082[/C][C]-0.4654[/C][C]0.321668[/C][/ROW]
[ROW][C]31[/C][C]0.064135[/C][C]0.4968[/C][C]0.310576[/C][/ROW]
[ROW][C]32[/C][C]-0.103839[/C][C]-0.8043[/C][C]0.21219[/C][/ROW]
[ROW][C]33[/C][C]-0.117286[/C][C]-0.9085[/C][C]0.183626[/C][/ROW]
[ROW][C]34[/C][C]-0.070066[/C][C]-0.5427[/C][C]0.294662[/C][/ROW]
[ROW][C]35[/C][C]0.035867[/C][C]0.2778[/C][C]0.391051[/C][/ROW]
[ROW][C]36[/C][C]-0.020553[/C][C]-0.1592[/C][C]0.437023[/C][/ROW]
[ROW][C]37[/C][C]-0.044512[/C][C]-0.3448[/C][C]0.36573[/C][/ROW]
[ROW][C]38[/C][C]-0.076418[/C][C]-0.5919[/C][C]0.278061[/C][/ROW]
[ROW][C]39[/C][C]0.034166[/C][C]0.2646[/C][C]0.396094[/C][/ROW]
[ROW][C]40[/C][C]-0.10176[/C][C]-0.7882[/C][C]0.216832[/C][/ROW]
[ROW][C]41[/C][C]-0.099078[/C][C]-0.7675[/C][C]0.22291[/C][/ROW]
[ROW][C]42[/C][C]-0.000162[/C][C]-0.0013[/C][C]0.499502[/C][/ROW]
[ROW][C]43[/C][C]-0.036461[/C][C]-0.2824[/C][C]0.389294[/C][/ROW]
[ROW][C]44[/C][C]0.036798[/C][C]0.285[/C][C]0.3883[/C][/ROW]
[ROW][C]45[/C][C]0.094477[/C][C]0.7318[/C][C]0.233564[/C][/ROW]
[ROW][C]46[/C][C]0.02595[/C][C]0.201[/C][C]0.420687[/C][/ROW]
[ROW][C]47[/C][C]-0.043726[/C][C]-0.3387[/C][C]0.36801[/C][/ROW]
[ROW][C]48[/C][C]-0.082337[/C][C]-0.6378[/C][C]0.263022[/C][/ROW]
[/TABLE]
Source: https://freestatistics.org/blog/index.php?pk=&T=2

Globally Unique Identifier (entire table): ba.freestatistics.org/blog/index.php?pk=&T=2

As an alternative you can also use a QR Code:  

The GUIDs for individual cells are displayed in the table below:

Partial Autocorrelation Function
Time lag kPACF(k)T-STATP-value
10.9351097.24330
2-0.211274-1.63650.053483
3-0.007769-0.06020.476108
4-0.096121-0.74450.229726
5-0.185067-1.43350.078449
6-0.037254-0.28860.386953
7-0.035265-0.27320.392833
8-0.078866-0.61090.271788
9-0.159594-1.23620.110599
100.0002910.00230.499105
11-0.066389-0.51420.304485
120.0479350.37130.355859
130.1645681.27470.103658
14-0.041948-0.32490.373183
15-0.044287-0.3430.366382
160.0757570.58680.279765
170.0611440.47360.318745
180.0290480.2250.411369
19-0.095247-0.73780.231763
200.0117020.09060.46404
21-0.138395-1.0720.144006
220.0853680.66130.255488
23-0.102196-0.79160.215853
240.066940.51850.303002
250.0290610.22510.411332
260.0414490.32110.37464
270.134291.04020.151209
280.0058890.04560.481883
290.0574260.44480.329026
30-0.060082-0.46540.321668
310.0641350.49680.310576
32-0.103839-0.80430.21219
33-0.117286-0.90850.183626
34-0.070066-0.54270.294662
350.0358670.27780.391051
36-0.020553-0.15920.437023
37-0.044512-0.34480.36573
38-0.076418-0.59190.278061
390.0341660.26460.396094
40-0.10176-0.78820.216832
41-0.099078-0.76750.22291
42-0.000162-0.00130.499502
43-0.036461-0.28240.389294
440.0367980.2850.3883
450.0944770.73180.233564
460.025950.2010.420687
47-0.043726-0.33870.36801
48-0.082337-0.63780.263022


Parameters (Session):
par1 = 48 ; par2 = 1 ; par3 = 0 ; par4 = 0 ; par5 = 12 ; par6 = White Noise ; par7 = 0.95 ;
Parameters (R input):
par1 = 48 ; par2 = 1 ; par3 = 0 ; par4 = 0 ; par5 = 12 ; par6 = White Noise ; par7 = 0.95 ; par8 = ;
R code (references can be found in the software module):
if (par1 == 'Default') {
par1 = 10*log10(length(x))
} else {
par1 <- as.numeric(par1)
}
par2 <- as.numeric(par2)
par3 <- as.numeric(par3)
par4 <- as.numeric(par4)
par5 <- as.numeric(par5)
if (par6 == 'White Noise') par6 <- 'white' else par6 <- 'ma'
par7 <- as.numeric(par7)
if (par8 != '') par8 <- as.numeric(par8)
x <- na.omit(x)
ox <- x
if (par8 == '') {
if (par2 == 0) {
x <- log(x)
} else {
x <- (x ^ par2 - 1) / par2
}
} else {
x <- log(x,base=par8)
}
if (par3 > 0) x <- diff(x,lag=1,difference=par3)
if (par4 > 0) x <- diff(x,lag=par5,difference=par4)
bitmap(file='picts.png')
op <- par(mfrow=c(2,1))
plot(ox,type='l',main='Original Time Series',xlab='time',ylab='value')
if (par8=='') {
mytitle <- paste('Working Time Series (lambda=',par2,', d=',par3,', D=',par4,')',sep='')
mysub <- paste('(lambda=',par2,', d=',par3,', D=',par4,', CI=', par7, ', CI type=',par6,')',sep='')
} else {
mytitle <- paste('Working Time Series (base=',par8,', d=',par3,', D=',par4,')',sep='')
mysub <- paste('(base=',par8,', d=',par3,', D=',par4,', CI=', par7, ', CI type=',par6,')',sep='')
}
plot(x,type='l', main=mytitle,xlab='time',ylab='value')
par(op)
dev.off()
bitmap(file='pic1.png')
racf <- acf(x, par1, main='Autocorrelation', xlab='time lag', ylab='ACF', ci.type=par6, ci=par7, sub=mysub)
dev.off()
bitmap(file='pic2.png')
rpacf <- pacf(x,par1,main='Partial Autocorrelation',xlab='lags',ylab='PACF',sub=mysub)
dev.off()
(myacf <- c(racf$acf))
(mypacf <- c(rpacf$acf))
lengthx <- length(x)
sqrtn <- sqrt(lengthx)
load(file='createtable')
a<-table.start()
a<-table.row.start(a)
a<-table.element(a,'Autocorrelation Function',4,TRUE)
a<-table.row.end(a)
a<-table.row.start(a)
a<-table.element(a,'Time lag k',header=TRUE)
a<-table.element(a,hyperlink('basics.htm','ACF(k)','click here for more information about the Autocorrelation Function'),header=TRUE)
a<-table.element(a,'T-STAT',header=TRUE)
a<-table.element(a,'P-value',header=TRUE)
a<-table.row.end(a)
for (i in 2:(par1+1)) {
a<-table.row.start(a)
a<-table.element(a,i-1,header=TRUE)
a<-table.element(a,round(myacf[i],6))
mytstat <- myacf[i]*sqrtn
a<-table.element(a,round(mytstat,4))
a<-table.element(a,round(1-pt(abs(mytstat),lengthx),6))
a<-table.row.end(a)
}
a<-table.end(a)
table.save(a,file='mytable.tab')
a<-table.start()
a<-table.row.start(a)
a<-table.element(a,'Partial Autocorrelation Function',4,TRUE)
a<-table.row.end(a)
a<-table.row.start(a)
a<-table.element(a,'Time lag k',header=TRUE)
a<-table.element(a,hyperlink('basics.htm','PACF(k)','click here for more information about the Partial Autocorrelation Function'),header=TRUE)
a<-table.element(a,'T-STAT',header=TRUE)
a<-table.element(a,'P-value',header=TRUE)
a<-table.row.end(a)
for (i in 1:par1) {
a<-table.row.start(a)
a<-table.element(a,i,header=TRUE)
a<-table.element(a,round(mypacf[i],6))
mytstat <- mypacf[i]*sqrtn
a<-table.element(a,round(mytstat,4))
a<-table.element(a,round(1-pt(abs(mytstat),lengthx),6))
a<-table.row.end(a)
}
a<-table.end(a)
table.save(a,file='mytable1.tab')