Free Statistics

of Irreproducible Research!

Author's title

Author*Unverified author*
R Software Modulerwasp_univariatedataseries.wasp
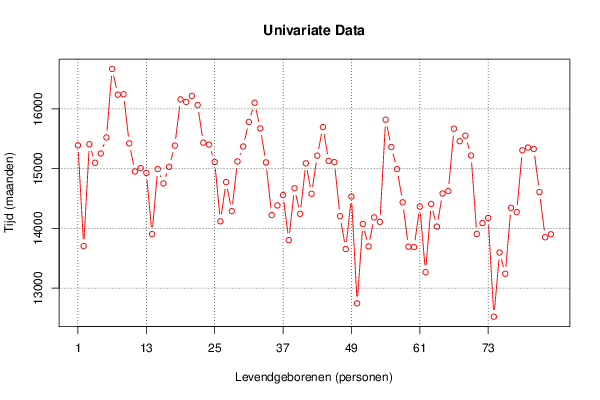
Title produced by softwareUnivariate Data Series
Date of computationMon, 19 Sep 2016 15:27:09 +0100
Cite this page as followsStatistical Computations at FreeStatistics.org, Office for Research Development and Education, URL https://freestatistics.org/blog/index.php?v=date/2016/Sep/19/t1474295254ezhjcb4ao1rswmo.htm/, Retrieved Tue, 30 Apr 2024 06:51:53 +0200
Statistical Computations at FreeStatistics.org, Office for Research Development and Education, URL https://freestatistics.org/blog/index.php?pk=, Retrieved Tue, 30 Apr 2024 06:51:53 +0200
QR Codes:

Original text written by user:
IsPrivate?No (this computation is public)
User-defined keywords
Estimated Impact0
Dataseries X:
15391
13704
15409
15098
15254
15522
16669
16238
16246
15424
14952
15008
14929
13905
14994
14753
15031
15386
16160
16116
16219
16064
15436
15404
15112
14119
14775
14289
15121
15371
15782
16104
15674
15105
14223
14385
14558
13804
14672
14244
15089
14580
15218
15696
15129
15110
14204
13655
14534
12746
14074
13699
14184
14110
15820
15362
14993
14437
13694
13688
14366
13267
14409
14031
14584
14626
15669
15460
15552
15220
13907
14090
14176
12523
13597
13241
14345
14273
15308
15353
15330
14610
13852
13902


Summary of computational transaction
Raw Inputview raw input (R code)
Raw Outputview raw output of R engine
Computing time0 seconds
R Server'Gwilym Jenkins' @ jenkins.wessa.net

\begin{tabular}{lllllllll}
\hline
Summary of computational transaction \tabularnewline
Raw Input & view raw input (R code)  \tabularnewline
Raw Output & view raw output of R engine  \tabularnewline
Computing time & 0 seconds \tabularnewline
R Server & 'Gwilym Jenkins' @ jenkins.wessa.net \tabularnewline
\hline
\end{tabular}
%Source: https://freestatistics.org/blog/index.php?pk=&T=0

[TABLE]
[ROW][C]Summary of computational transaction[/C][/ROW]
[ROW][C]Raw Input[/C][C]view raw input (R code) [/C][/ROW]
[ROW][C]Raw Output[/C][C]view raw output of R engine [/C][/ROW]
[ROW][C]Computing time[/C][C]0 seconds[/C][/ROW]
[ROW][C]R Server[/C][C]'Gwilym Jenkins' @ jenkins.wessa.net[/C][/ROW]
[/TABLE]
Source: https://freestatistics.org/blog/index.php?pk=&T=0

Globally Unique Identifier (entire table): ba.freestatistics.org/blog/index.php?pk=&T=0

As an alternative you can also use a QR Code:  

The GUIDs for individual cells are displayed in the table below:

Summary of computational transaction
Raw Inputview raw input (R code)
Raw Outputview raw output of R engine
Computing time0 seconds
R Server'Gwilym Jenkins' @ jenkins.wessa.net


Univariate Dataseries
Name of dataseriesAantal levendgeborenen
Sourcecbs.nl
DescriptionAantal levendgeborenen in 2009 tot 2015
Number of observations84

\begin{tabular}{lllllllll}
\hline
Univariate Dataseries \tabularnewline
Name of dataseries & Aantal levendgeborenen \tabularnewline
Source & cbs.nl \tabularnewline
Description & Aantal levendgeborenen in 2009 tot 2015  \tabularnewline
Number of observations & 84 \tabularnewline
\hline
\end{tabular}
%Source: https://freestatistics.org/blog/index.php?pk=&T=1

[TABLE]
[ROW][C]Univariate Dataseries[/C][/ROW]
[ROW][C]Name of dataseries[/C][C]Aantal levendgeborenen[/C][/ROW]
[ROW][C]Source[/C][C]cbs.nl[/C][/ROW]
[ROW][C]Description[/C][C]Aantal levendgeborenen in 2009 tot 2015 [/C][/ROW]
[ROW][C]Number of observations[/C][C]84[/C][/ROW]
[/TABLE]
Source: https://freestatistics.org/blog/index.php?pk=&T=1

Globally Unique Identifier (entire table): ba.freestatistics.org/blog/index.php?pk=&T=1

As an alternative you can also use a QR Code:  

The GUIDs for individual cells are displayed in the table below:

Univariate Dataseries
Name of dataseriesAantal levendgeborenen
Sourcecbs.nl
DescriptionAantal levendgeborenen in 2009 tot 2015
Number of observations84


Parameters (Session):
par1 = Aantal levendgeborenen ; par2 = cbs.nl ; par3 = Aantal levendgeborenen in 2009 tot 2015 ; par4 = 12 ;
Parameters (R input):
par1 = Aantal levendgeborenen ; par2 = cbs.nl ; par3 = Aantal levendgeborenen in 2009 tot 2015 ; par4 = 12 ;
R code (references can be found in the software module):
par4 <- '12'
par3 <- 'Aantal levendgeborenen in 2009 tot 2015 '
par2 <- 'cbs.nl'
par1 <- 'Aantal levendgeborenen'
if (par4 != 'No season') {
par4 <- as.numeric(par4)
if (par4 < 4) par4 <- 12
}
summary(x)
n <- length(x)
bitmap(file='test1.png')
if (par4=='No season') {
plot(x,col=2,type='b',main=main,xlab=xlab,ylab=ylab,xaxt='n')
axis(1,at=seq(1,n,10))
}
if (par4!='No season') {
plot(x,col=2,type='b',main=main,xlab=xlab,ylab=ylab,xaxt='n')
axis(1,at=seq(1,n,par4))
grid(nx=0,ny=NULL,col='black')
abline(v=seq(1,n,par4),col='black',lty='dotted')
}
dev.off()
load(file='createtable')
a<-table.start()
a<-table.row.start(a)
a<-table.element(a,'Univariate Dataseries',2,TRUE)
a<-table.row.end(a)
a<-table.row.start(a)
a<-table.element(a,'Name of dataseries',header=TRUE)
a<-table.element(a,par1)
a<-table.row.end(a)
a<-table.row.start(a)
a<-table.element(a,'Source',header=TRUE)
a<-table.element(a,par2)
a<-table.row.end(a)
a<-table.row.start(a)
a<-table.element(a,'Description',header=TRUE)
a<-table.element(a,par3)
a<-table.row.end(a)
a<-table.row.start(a)
a<-table.element(a,'Number of observations',header=TRUE)
a<-table.element(a,length(x))
a<-table.row.end(a)
a<-table.end(a)
table.save(a,file='mytable.tab')