Free Statistics

of Irreproducible Research!

Author's title

Author*Unverified author*
R Software Modulerwasp_univariatedataseries.wasp
Title produced by softwareUnivariate Data Series
Date of computationWed, 21 Sep 2016 16:27:14 +0100
Cite this page as followsStatistical Computations at FreeStatistics.org, Office for Research Development and Education, URL https://freestatistics.org/blog/index.php?v=date/2016/Sep/21/t1474471778wwnmj7ztxdixr98.htm/, Retrieved Wed, 08 May 2024 11:54:08 +0200
Statistical Computations at FreeStatistics.org, Office for Research Development and Education, URL https://freestatistics.org/blog/index.php?pk=, Retrieved Wed, 08 May 2024 11:54:08 +0200
QR Codes:

Original text written by user:
IsPrivate?No (this computation is public)
User-defined keywords
Estimated Impact0
Dataseries X:
12200
10644
12044
11338
11292
10612
10995
10686
10635
11285
11475
12535
12490
12511
12799
11876
11602
11062
11055
10855
10704
11510
11663
12686
13516
12539
13811
12354
11441
10814
11261
10788
10326
11490
11029
11876
12198
11142
12008
11258
11367
10596
11721
11199
10972
11635
11725
13402
14955
13183
13673
12195
11811
11138
11590
11174
11250
12235
11612
12318


Summary of computational transaction
Raw Inputview raw input (R code)
Raw Outputview raw output of R engine
Computing time1 seconds
R Server'Sir Maurice George Kendall' @ kendall.wessa.net

\begin{tabular}{lllllllll}
\hline
Summary of computational transaction \tabularnewline
Raw Input & view raw input (R code)  \tabularnewline
Raw Output & view raw output of R engine  \tabularnewline
Computing time & 1 seconds \tabularnewline
R Server & 'Sir Maurice George Kendall' @ kendall.wessa.net \tabularnewline
\hline
\end{tabular}
%Source: https://freestatistics.org/blog/index.php?pk=&T=0

[TABLE]
[ROW][C]Summary of computational transaction[/C][/ROW]
[ROW][C]Raw Input[/C][C]view raw input (R code) [/C][/ROW]
[ROW][C]Raw Output[/C][C]view raw output of R engine [/C][/ROW]
[ROW][C]Computing time[/C][C]1 seconds[/C][/ROW]
[ROW][C]R Server[/C][C]'Sir Maurice George Kendall' @ kendall.wessa.net[/C][/ROW]
[/TABLE]
Source: https://freestatistics.org/blog/index.php?pk=&T=0

Globally Unique Identifier (entire table): ba.freestatistics.org/blog/index.php?pk=&T=0

As an alternative you can also use a QR Code:  

The GUIDs for individual cells are displayed in the table below:

Summary of computational transaction
Raw Inputview raw input (R code)
Raw Outputview raw output of R engine
Computing time1 seconds
R Server'Sir Maurice George Kendall' @ kendall.wessa.net


Univariate Dataseries
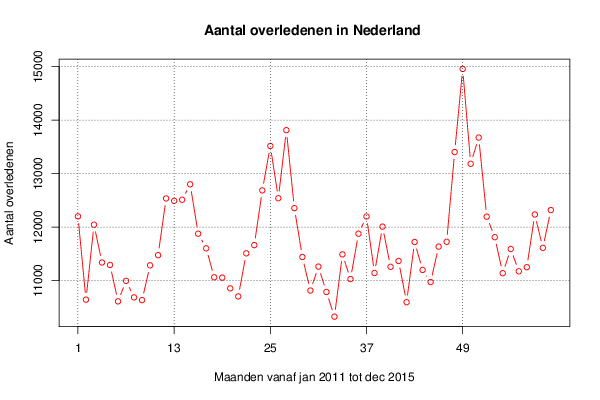
Name of dataseriesAantal overledenen in Nederland
Sourcecbs
DescriptionAantal overledenen in Nedrland vanaf 2011 tot 2015 (uitgedrukt per maand)
Number of observations60

\begin{tabular}{lllllllll}
\hline
Univariate Dataseries \tabularnewline
Name of dataseries & Aantal overledenen in Nederland \tabularnewline
Source & cbs \tabularnewline
Description & Aantal overledenen in Nedrland vanaf 2011 tot 2015 (uitgedrukt per maand) \tabularnewline
Number of observations & 60 \tabularnewline
\hline
\end{tabular}
%Source: https://freestatistics.org/blog/index.php?pk=&T=1

[TABLE]
[ROW][C]Univariate Dataseries[/C][/ROW]
[ROW][C]Name of dataseries[/C][C]Aantal overledenen in Nederland[/C][/ROW]
[ROW][C]Source[/C][C]cbs[/C][/ROW]
[ROW][C]Description[/C][C]Aantal overledenen in Nedrland vanaf 2011 tot 2015 (uitgedrukt per maand)[/C][/ROW]
[ROW][C]Number of observations[/C][C]60[/C][/ROW]
[/TABLE]
Source: https://freestatistics.org/blog/index.php?pk=&T=1

Globally Unique Identifier (entire table): ba.freestatistics.org/blog/index.php?pk=&T=1

As an alternative you can also use a QR Code:  

The GUIDs for individual cells are displayed in the table below:

Univariate Dataseries
Name of dataseriesAantal overledenen in Nederland
Sourcecbs
DescriptionAantal overledenen in Nedrland vanaf 2011 tot 2015 (uitgedrukt per maand)
Number of observations60


Parameters (Session):
par1 = Aantal overledenen in Nederland ; par2 = cbs ; par3 = Aantal overledenen in Nedrland vanaf 2011 tot 2015 (uitgedrukt per maand) ; par4 = 12 ;
Parameters (R input):
par1 = Aantal overledenen in Nederland ; par2 = cbs ; par3 = Aantal overledenen in Nedrland vanaf 2011 tot 2015 (uitgedrukt per maand) ; par4 = 12 ;
R code (references can be found in the software module):
par4 <- '12'
par3 <- 'Aantal overledenen in Nedrland vanaf 2011 tot 2015 (uitgedrukt per maand)'
par2 <- 'cbs'
par1 <- 'Aantal overledenen in Nederland'
if (par4 != 'No season') {
par4 <- as.numeric(par4)
if (par4 < 4) par4 <- 12
}
summary(x)
n <- length(x)
bitmap(file='test1.png')
if (par4=='No season') {
plot(x,col=2,type='b',main=main,xlab=xlab,ylab=ylab,xaxt='n')
axis(1,at=seq(1,n,10))
}
if (par4!='No season') {
plot(x,col=2,type='b',main=main,xlab=xlab,ylab=ylab,xaxt='n')
axis(1,at=seq(1,n,par4))
grid(nx=0,ny=NULL,col='black')
abline(v=seq(1,n,par4),col='black',lty='dotted')
}
dev.off()
load(file='createtable')
a<-table.start()
a<-table.row.start(a)
a<-table.element(a,'Univariate Dataseries',2,TRUE)
a<-table.row.end(a)
a<-table.row.start(a)
a<-table.element(a,'Name of dataseries',header=TRUE)
a<-table.element(a,par1)
a<-table.row.end(a)
a<-table.row.start(a)
a<-table.element(a,'Source',header=TRUE)
a<-table.element(a,par2)
a<-table.row.end(a)
a<-table.row.start(a)
a<-table.element(a,'Description',header=TRUE)
a<-table.element(a,par3)
a<-table.row.end(a)
a<-table.row.start(a)
a<-table.element(a,'Number of observations',header=TRUE)
a<-table.element(a,length(x))
a<-table.row.end(a)
a<-table.end(a)
table.save(a,file='mytable.tab')