Free Statistics
of Irreproducible Research!
Description of Statistical Computation | |||||||||||||||||||||||||||||||||||||||||
|---|---|---|---|---|---|---|---|---|---|---|---|---|---|---|---|---|---|---|---|---|---|---|---|---|---|---|---|---|---|---|---|---|---|---|---|---|---|---|---|---|---|
| Author's title | |||||||||||||||||||||||||||||||||||||||||
| Author | *Unverified author* | ||||||||||||||||||||||||||||||||||||||||
| R Software Module | rwasp_univariatedataseries.wasp | ||||||||||||||||||||||||||||||||||||||||
| Title produced by software | Univariate Data Series | ||||||||||||||||||||||||||||||||||||||||
| Date of computation | Sun, 25 Sep 2016 15:00:06 +0100 | ||||||||||||||||||||||||||||||||||||||||
| Cite this page as follows | Statistical Computations at FreeStatistics.org, Office for Research Development and Education, URL https://freestatistics.org/blog/index.php?v=date/2016/Sep/25/t14748121394dsup4suede4q7d.htm/, Retrieved Mon, 29 Apr 2024 20:33:24 +0200 | ||||||||||||||||||||||||||||||||||||||||
| Statistical Computations at FreeStatistics.org, Office for Research Development and Education, URL https://freestatistics.org/blog/index.php?pk=, Retrieved Mon, 29 Apr 2024 20:33:24 +0200 | |||||||||||||||||||||||||||||||||||||||||
| QR Codes: | |||||||||||||||||||||||||||||||||||||||||
|
| |||||||||||||||||||||||||||||||||||||||||
| Original text written by user: | |||||||||||||||||||||||||||||||||||||||||
| IsPrivate? | No (this computation is public) | ||||||||||||||||||||||||||||||||||||||||
| User-defined keywords | |||||||||||||||||||||||||||||||||||||||||
| Estimated Impact | 0 | ||||||||||||||||||||||||||||||||||||||||
Tree of Dependent Computations | |||||||||||||||||||||||||||||||||||||||||
Dataset | |||||||||||||||||||||||||||||||||||||||||
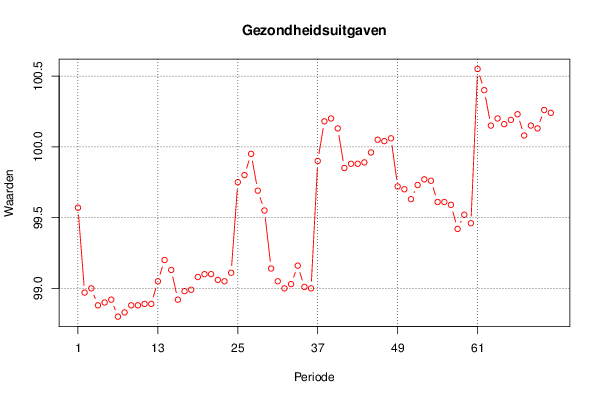
| Dataseries X: | |||||||||||||||||||||||||||||||||||||||||
99,57 98,97 99 98,88 98,9 98,92 98,8 98,83 98,88 98,88 98,89 98,89 99,05 99,2 99,13 98,92 98,98 98,99 99,08 99,1 99,1 99,06 99,05 99,11 99,75 99,8 99,95 99,69 99,55 99,14 99,05 99 99,03 99,16 99,01 99 99,9 100,18 100,2 100,13 99,85 99,88 99,88 99,89 99,96 100,05 100,04 100,06 99,72 99,7 99,63 99,73 99,77 99,76 99,61 99,61 99,59 99,42 99,52 99,46 100,55 100,4 100,15 100,2 100,16 100,19 100,23 100,08 100,15 100,13 100,26 100,24 | |||||||||||||||||||||||||||||||||||||||||
Tables (Output of Computation) | |||||||||||||||||||||||||||||||||||||||||
| |||||||||||||||||||||||||||||||||||||||||
Figures (Output of Computation) | |||||||||||||||||||||||||||||||||||||||||
Input Parameters & R Code | |||||||||||||||||||||||||||||||||||||||||
| Parameters (Session): | |||||||||||||||||||||||||||||||||||||||||
| par1 = Indexcijfers gezondheidsuitgaven ; par2 = NBB ; par3 = indexcijfers van de gezondheidsuitgaven in maanden van de periode 2010 tot 2015 ; par4 = 12 ; | |||||||||||||||||||||||||||||||||||||||||
| Parameters (R input): | |||||||||||||||||||||||||||||||||||||||||
| par1 = Indexcijfers gezondheidsuitgaven ; par2 = NBB ; par3 = indexcijfers van de gezondheidsuitgaven in maanden van de periode 2010 tot 2015 ; par4 = 12 ; | |||||||||||||||||||||||||||||||||||||||||
| R code (references can be found in the software module): | |||||||||||||||||||||||||||||||||||||||||
if (par4 != 'No season') { | |||||||||||||||||||||||||||||||||||||||||