Free Statistics

of Irreproducible Research!

Author's title

Author*Unverified author*
R Software Modulerwasp_histogram.wasp
Title produced by softwareHistogram
Date of computationMon, 26 Sep 2016 22:40:13 +0100
Cite this page as followsStatistical Computations at FreeStatistics.org, Office for Research Development and Education, URL https://freestatistics.org/blog/index.php?v=date/2016/Sep/26/t1474926050mrdmmxllitq9djq.htm/, Retrieved Thu, 09 May 2024 04:20:09 +0200
Statistical Computations at FreeStatistics.org, Office for Research Development and Education, URL https://freestatistics.org/blog/index.php?pk=, Retrieved Thu, 09 May 2024 04:20:09 +0200
QR Codes:

Original text written by user:
IsPrivate?No (this computation is public)
User-defined keywords
Estimated Impact0
Dataseries X:
8203476
8205586
8209197
8210899
8213427
8216286
8219951
8222904
8228652
8235192
8239730
8242556
8243482
8246483
8250539
8253158
8254803
8257440
8260524
8262642
8269045
8276541
8279969
8282336
8282871
8283273
8285849
8286974
8288019
8289646
8290866
8291787
8297340
8304056
8306959
8308098
8307339
8308772
8310421
8311363
8311926
8313781
8315731
8317691
8323013
8329897
8332639
8334485
8334385
8337055
8340482
8343066
8345517
8347964
8350453
8351952
8357487
8365236
8369371
8372420
8372858
8374861
8377729
8379637
8381851
8384251
8386614
8388680
8395572
8404511
8409838
8414637


Summary of computational transaction
Raw Inputview raw input (R code)
Raw Outputview raw output of R engine
Computing time0 seconds
R Server'Sir Ronald Aylmer Fisher' @ fisher.wessa.net

\begin{tabular}{lllllllll}
\hline
Summary of computational transaction \tabularnewline
Raw Input & view raw input (R code)  \tabularnewline
Raw Output & view raw output of R engine  \tabularnewline
Computing time & 0 seconds \tabularnewline
R Server & 'Sir Ronald Aylmer Fisher' @ fisher.wessa.net \tabularnewline
\hline
\end{tabular}
%Source: https://freestatistics.org/blog/index.php?pk=&T=0

[TABLE]
[ROW][C]Summary of computational transaction[/C][/ROW]
[ROW][C]Raw Input[/C][C]view raw input (R code) [/C][/ROW]
[ROW][C]Raw Output[/C][C]view raw output of R engine [/C][/ROW]
[ROW][C]Computing time[/C][C]0 seconds[/C][/ROW]
[ROW][C]R Server[/C][C]'Sir Ronald Aylmer Fisher' @ fisher.wessa.net[/C][/ROW]
[/TABLE]
Source: https://freestatistics.org/blog/index.php?pk=&T=0

Globally Unique Identifier (entire table): ba.freestatistics.org/blog/index.php?pk=&T=0

As an alternative you can also use a QR Code:  

The GUIDs for individual cells are displayed in the table below:

Summary of computational transaction
Raw Inputview raw input (R code)
Raw Outputview raw output of R engine
Computing time0 seconds
R Server'Sir Ronald Aylmer Fisher' @ fisher.wessa.net


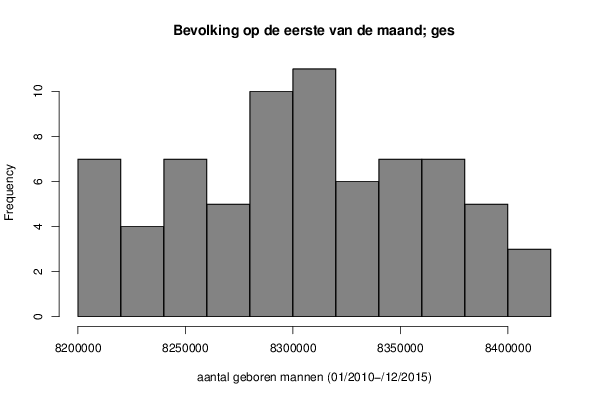
Frequency Table (Histogram)
BinsMidpointAbs. FrequencyRel. FrequencyCumul. Rel. Freq.Density
[8200000,8220000[821000070.0972220.0972225e-06
[8220000,8240000[823000040.0555560.1527783e-06
[8240000,8260000[825000070.0972220.255e-06
[8260000,8280000[827000050.0694440.3194443e-06
[8280000,8300000[8290000100.1388890.4583337e-06
[8300000,8320000[8310000110.1527780.6111118e-06
[8320000,8340000[833000060.0833330.6944444e-06
[8340000,8360000[835000070.0972220.7916675e-06
[8360000,8380000[837000070.0972220.8888895e-06
[8380000,8400000[839000050.0694440.9583333e-06
[8400000,8420000]841000030.04166712e-06

\begin{tabular}{lllllllll}
\hline
Frequency Table (Histogram) \tabularnewline
Bins & Midpoint & Abs. Frequency & Rel. Frequency & Cumul. Rel. Freq. & Density \tabularnewline
[8200000,8220000[ & 8210000 & 7 & 0.097222 & 0.097222 & 5e-06 \tabularnewline
[8220000,8240000[ & 8230000 & 4 & 0.055556 & 0.152778 & 3e-06 \tabularnewline
[8240000,8260000[ & 8250000 & 7 & 0.097222 & 0.25 & 5e-06 \tabularnewline
[8260000,8280000[ & 8270000 & 5 & 0.069444 & 0.319444 & 3e-06 \tabularnewline
[8280000,8300000[ & 8290000 & 10 & 0.138889 & 0.458333 & 7e-06 \tabularnewline
[8300000,8320000[ & 8310000 & 11 & 0.152778 & 0.611111 & 8e-06 \tabularnewline
[8320000,8340000[ & 8330000 & 6 & 0.083333 & 0.694444 & 4e-06 \tabularnewline
[8340000,8360000[ & 8350000 & 7 & 0.097222 & 0.791667 & 5e-06 \tabularnewline
[8360000,8380000[ & 8370000 & 7 & 0.097222 & 0.888889 & 5e-06 \tabularnewline
[8380000,8400000[ & 8390000 & 5 & 0.069444 & 0.958333 & 3e-06 \tabularnewline
[8400000,8420000] & 8410000 & 3 & 0.041667 & 1 & 2e-06 \tabularnewline
\hline
\end{tabular}
%Source: https://freestatistics.org/blog/index.php?pk=&T=1

[TABLE]
[ROW][C]Frequency Table (Histogram)[/C][/ROW]
[ROW][C]Bins[/C][C]Midpoint[/C][C]Abs. Frequency[/C][C]Rel. Frequency[/C][C]Cumul. Rel. Freq.[/C][C]Density[/C][/ROW]
[ROW][C][8200000,8220000[[/C][C]8210000[/C][C]7[/C][C]0.097222[/C][C]0.097222[/C][C]5e-06[/C][/ROW]
[ROW][C][8220000,8240000[[/C][C]8230000[/C][C]4[/C][C]0.055556[/C][C]0.152778[/C][C]3e-06[/C][/ROW]
[ROW][C][8240000,8260000[[/C][C]8250000[/C][C]7[/C][C]0.097222[/C][C]0.25[/C][C]5e-06[/C][/ROW]
[ROW][C][8260000,8280000[[/C][C]8270000[/C][C]5[/C][C]0.069444[/C][C]0.319444[/C][C]3e-06[/C][/ROW]
[ROW][C][8280000,8300000[[/C][C]8290000[/C][C]10[/C][C]0.138889[/C][C]0.458333[/C][C]7e-06[/C][/ROW]
[ROW][C][8300000,8320000[[/C][C]8310000[/C][C]11[/C][C]0.152778[/C][C]0.611111[/C][C]8e-06[/C][/ROW]
[ROW][C][8320000,8340000[[/C][C]8330000[/C][C]6[/C][C]0.083333[/C][C]0.694444[/C][C]4e-06[/C][/ROW]
[ROW][C][8340000,8360000[[/C][C]8350000[/C][C]7[/C][C]0.097222[/C][C]0.791667[/C][C]5e-06[/C][/ROW]
[ROW][C][8360000,8380000[[/C][C]8370000[/C][C]7[/C][C]0.097222[/C][C]0.888889[/C][C]5e-06[/C][/ROW]
[ROW][C][8380000,8400000[[/C][C]8390000[/C][C]5[/C][C]0.069444[/C][C]0.958333[/C][C]3e-06[/C][/ROW]
[ROW][C][8400000,8420000][/C][C]8410000[/C][C]3[/C][C]0.041667[/C][C]1[/C][C]2e-06[/C][/ROW]
[/TABLE]
Source: https://freestatistics.org/blog/index.php?pk=&T=1

Globally Unique Identifier (entire table): ba.freestatistics.org/blog/index.php?pk=&T=1

As an alternative you can also use a QR Code:  

The GUIDs for individual cells are displayed in the table below:

Frequency Table (Histogram)
BinsMidpointAbs. FrequencyRel. FrequencyCumul. Rel. Freq.Density
[8200000,8220000[821000070.0972220.0972225e-06
[8220000,8240000[823000040.0555560.1527783e-06
[8240000,8260000[825000070.0972220.255e-06
[8260000,8280000[827000050.0694440.3194443e-06
[8280000,8300000[8290000100.1388890.4583337e-06
[8300000,8320000[8310000110.1527780.6111118e-06
[8320000,8340000[833000060.0833330.6944444e-06
[8340000,8360000[835000070.0972220.7916675e-06
[8360000,8380000[837000070.0972220.8888895e-06
[8380000,8400000[839000050.0694440.9583333e-06
[8400000,8420000]841000030.04166712e-06


Parameters (Session):
par2 = grey ; par3 = FALSE ; par4 = Unknown ;
Parameters (R input):
par1 = ; par2 = grey ; par3 = FALSE ; par4 = Unknown ;
R code (references can be found in the software module):
par1 <- as.numeric(par1)
if (par3 == 'TRUE') par3 <- TRUE
if (par3 == 'FALSE') par3 <- FALSE
if (par4 == 'Unknown') par1 <- as.numeric(par1)
if (par4 == 'Interval/Ratio') par1 <- as.numeric(par1)
if (par4 == '3-point Likert') par1 <- c(1:3 - 0.5, 3.5)
if (par4 == '4-point Likert') par1 <- c(1:4 - 0.5, 4.5)
if (par4 == '5-point Likert') par1 <- c(1:5 - 0.5, 5.5)
if (par4 == '6-point Likert') par1 <- c(1:6 - 0.5, 6.5)
if (par4 == '7-point Likert') par1 <- c(1:7 - 0.5, 7.5)
if (par4 == '8-point Likert') par1 <- c(1:8 - 0.5, 8.5)
if (par4 == '9-point Likert') par1 <- c(1:9 - 0.5, 9.5)
if (par4 == '10-point Likert') par1 <- c(1:10 - 0.5, 10.5)
bitmap(file='test1.png')
if(is.numeric(x[1])) {
if (is.na(par1)) {
myhist<-hist(x,col=par2,main=main,xlab=xlab,right=par3)
} else {
if (par1 < 0) par1 <- 3
if (par1 > 50) par1 <- 50
myhist<-hist(x,breaks=par1,col=par2,main=main,xlab=xlab,right=par3)
}
} else {
barplot(mytab <- sort(table(x),T),col=par2,main='Frequency Plot',xlab=xlab,ylab='Absolute Frequency')
}
dev.off()
if(is.numeric(x[1])) {
myhist
n <- length(x)
load(file='createtable')
a<-table.start()
a<-table.row.start(a)
a<-table.element(a,hyperlink('histogram.htm','Frequency Table (Histogram)',''),6,TRUE)
a<-table.row.end(a)
a<-table.row.start(a)
a<-table.element(a,'Bins',header=TRUE)
a<-table.element(a,'Midpoint',header=TRUE)
a<-table.element(a,'Abs. Frequency',header=TRUE)
a<-table.element(a,'Rel. Frequency',header=TRUE)
a<-table.element(a,'Cumul. Rel. Freq.',header=TRUE)
a<-table.element(a,'Density',header=TRUE)
a<-table.row.end(a)
crf <- 0
if (par3 == FALSE) mybracket <- '[' else mybracket <- ']'
mynumrows <- (length(myhist$breaks)-1)
for (i in 1:mynumrows) {
a<-table.row.start(a)
if (i == 1)
dum <- paste('[',myhist$breaks[i],sep='')
else
dum <- paste(mybracket,myhist$breaks[i],sep='')
dum <- paste(dum,myhist$breaks[i+1],sep=',')
if (i==mynumrows)
dum <- paste(dum,']',sep='')
else
dum <- paste(dum,mybracket,sep='')
a<-table.element(a,dum,header=TRUE)
a<-table.element(a,myhist$mids[i])
a<-table.element(a,myhist$counts[i])
rf <- myhist$counts[i]/n
crf <- crf + rf
a<-table.element(a,round(rf,6))
a<-table.element(a,round(crf,6))
a<-table.element(a,round(myhist$density[i],6))
a<-table.row.end(a)
}
a<-table.end(a)
table.save(a,file='mytable.tab')
} else {
mytab
reltab <- mytab / sum(mytab)
n <- length(mytab)
load(file='createtable')
a<-table.start()
a<-table.row.start(a)
a<-table.element(a,'Frequency Table (Categorical Data)',3,TRUE)
a<-table.row.end(a)
a<-table.row.start(a)
a<-table.element(a,'Category',header=TRUE)
a<-table.element(a,'Abs. Frequency',header=TRUE)
a<-table.element(a,'Rel. Frequency',header=TRUE)
a<-table.row.end(a)
for (i in 1:n) {
a<-table.row.start(a)
a<-table.element(a,labels(mytab)$x[i],header=TRUE)
a<-table.element(a,mytab[i])
a<-table.element(a,round(reltab[i],4))
a<-table.row.end(a)
}
a<-table.end(a)
table.save(a,file='mytable1.tab')
}