Free Statistics

of Irreproducible Research!

Author's title

Author*Unverified author*
R Software Modulerwasp_density.wasp
Title produced by softwareKernel Density Estimation
Date of computationThu, 29 Sep 2016 20:16:37 +0100
Cite this page as followsStatistical Computations at FreeStatistics.org, Office for Research Development and Education, URL https://freestatistics.org/blog/index.php?v=date/2016/Sep/29/t14751766200hxel3s6az3prf8.htm/, Retrieved Sun, 05 May 2024 02:07:45 +0200
Statistical Computations at FreeStatistics.org, Office for Research Development and Education, URL https://freestatistics.org/blog/index.php?pk=, Retrieved Sun, 05 May 2024 02:07:45 +0200
QR Codes:

Original text written by user:
IsPrivate?No (this computation is public)
User-defined keywords
Estimated Impact0
Dataseries X:
84543
55735
65814
55382
57422
57729
48213
44789
50998
50328
47719
19946
80608
50747
61687
47539
54412
83362
36911
39254
37597
32557
35537
21500
56125
37432
43347
36870
36247
41293
36190
33381
36609
41861
45926
45079
51469
39013
37036
34865
37505
39379
35653
30515
35984
41068
37851
40333
56004
39797
37960
34357
35069
45299
40475
36277
41910
45234
46425
73241


Summary of computational transaction
Raw Inputview raw input (R code)
Raw Outputview raw output of R engine
Computing time2 seconds
R Server'Sir Ronald Aylmer Fisher' @ fisher.wessa.net

\begin{tabular}{lllllllll}
\hline
Summary of computational transaction \tabularnewline
Raw Input & view raw input (R code)  \tabularnewline
Raw Output & view raw output of R engine  \tabularnewline
Computing time & 2 seconds \tabularnewline
R Server & 'Sir Ronald Aylmer Fisher' @ fisher.wessa.net \tabularnewline
\hline
\end{tabular}
%Source: https://freestatistics.org/blog/index.php?pk=&T=0

[TABLE]
[ROW][C]Summary of computational transaction[/C][/ROW]
[ROW][C]Raw Input[/C][C]view raw input (R code) [/C][/ROW]
[ROW][C]Raw Output[/C][C]view raw output of R engine [/C][/ROW]
[ROW][C]Computing time[/C][C]2 seconds[/C][/ROW]
[ROW][C]R Server[/C][C]'Sir Ronald Aylmer Fisher' @ fisher.wessa.net[/C][/ROW]
[/TABLE]
Source: https://freestatistics.org/blog/index.php?pk=&T=0

Globally Unique Identifier (entire table): ba.freestatistics.org/blog/index.php?pk=&T=0

As an alternative you can also use a QR Code:  

The GUIDs for individual cells are displayed in the table below:

Summary of computational transaction
Raw Inputview raw input (R code)
Raw Outputview raw output of R engine
Computing time2 seconds
R Server'Sir Ronald Aylmer Fisher' @ fisher.wessa.net


Properties of Density Trace
Bandwidth4147.539913926
#Observations60

\begin{tabular}{lllllllll}
\hline
Properties of Density Trace \tabularnewline
Bandwidth & 4147.539913926 \tabularnewline
#Observations & 60 \tabularnewline
\hline
\end{tabular}
%Source: https://freestatistics.org/blog/index.php?pk=&T=1

[TABLE]
[ROW][C]Properties of Density Trace[/C][/ROW]
[ROW][C]Bandwidth[/C][C]4147.539913926[/C][/ROW]
[ROW][C]#Observations[/C][C]60[/C][/ROW]
[/TABLE]
Source: https://freestatistics.org/blog/index.php?pk=&T=1

Globally Unique Identifier (entire table): ba.freestatistics.org/blog/index.php?pk=&T=1

As an alternative you can also use a QR Code:  

The GUIDs for individual cells are displayed in the table below:

Properties of Density Trace
Bandwidth4147.539913926
#Observations60


Maximum Density Values
Kernelx-valuemax. density
Gaussian38147.98282108364.43301178570705e-05
Epanechnikov39373.76692359814.25754163710981e-05
Rectangular41299.99908469234.39858784436529e-05
Triangular37972.87080643874.31568242500919e-05
Biweight38848.43087966334.29173170587393e-05
Cosine38673.31886501844.30902144647461e-05
Optcosine39198.65490895324.26774637068547e-05

\begin{tabular}{lllllllll}
\hline
Maximum Density Values \tabularnewline
Kernel & x-value & max. density \tabularnewline
Gaussian & 38147.9828210836 & 4.43301178570705e-05 \tabularnewline
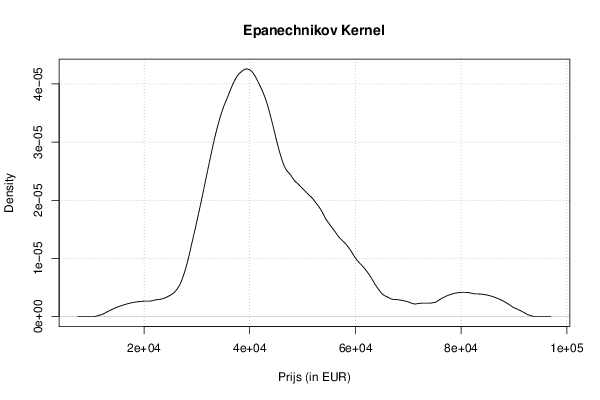
Epanechnikov & 39373.7669235981 & 4.25754163710981e-05 \tabularnewline
Rectangular & 41299.9990846923 & 4.39858784436529e-05 \tabularnewline
Triangular & 37972.8708064387 & 4.31568242500919e-05 \tabularnewline
Biweight & 38848.4308796633 & 4.29173170587393e-05 \tabularnewline
Cosine & 38673.3188650184 & 4.30902144647461e-05 \tabularnewline
Optcosine & 39198.6549089532 & 4.26774637068547e-05 \tabularnewline
\hline
\end{tabular}
%Source: https://freestatistics.org/blog/index.php?pk=&T=2

[TABLE]
[ROW][C]Maximum Density Values[/C][/ROW]
[ROW][C]Kernel[/C][C]x-value[/C][C]max. density[/C][/ROW]
[ROW][C]Gaussian[/C][C]38147.9828210836[/C][C]4.43301178570705e-05[/C][/ROW]
[ROW][C]Epanechnikov[/C][C]39373.7669235981[/C][C]4.25754163710981e-05[/C][/ROW]
[ROW][C]Rectangular[/C][C]41299.9990846923[/C][C]4.39858784436529e-05[/C][/ROW]
[ROW][C]Triangular[/C][C]37972.8708064387[/C][C]4.31568242500919e-05[/C][/ROW]
[ROW][C]Biweight[/C][C]38848.4308796633[/C][C]4.29173170587393e-05[/C][/ROW]
[ROW][C]Cosine[/C][C]38673.3188650184[/C][C]4.30902144647461e-05[/C][/ROW]
[ROW][C]Optcosine[/C][C]39198.6549089532[/C][C]4.26774637068547e-05[/C][/ROW]
[/TABLE]
Source: https://freestatistics.org/blog/index.php?pk=&T=2

Globally Unique Identifier (entire table): ba.freestatistics.org/blog/index.php?pk=&T=2

As an alternative you can also use a QR Code:  

The GUIDs for individual cells are displayed in the table below:

Maximum Density Values
Kernelx-valuemax. density
Gaussian38147.98282108364.43301178570705e-05
Epanechnikov39373.76692359814.25754163710981e-05
Rectangular41299.99908469234.39858784436529e-05
Triangular37972.87080643874.31568242500919e-05
Biweight38848.43087966334.29173170587393e-05
Cosine38673.31886501844.30902144647461e-05
Optcosine39198.65490895324.26774637068547e-05


Kernel Density Values
x-valueGaussianEpanechnikovRectangularTriangularBiweightCosineOptcosine
Kernel Density Values are not shown

\begin{tabular}{lllllllll}
\hline
Kernel Density Values \tabularnewline
x-value & Gaussian & Epanechnikov & Rectangular & Triangular & Biweight & Cosine & Optcosine \tabularnewline
Kernel Density Values are not shown \tabularnewline
\hline
\end{tabular}
%Source: https://freestatistics.org/blog/index.php?pk=&T=3

[TABLE]
[ROW][C]Kernel Density Values[/C][/ROW]
[ROW][C]x-value[/C][C]Gaussian[/C][C]Epanechnikov[/C][C]Rectangular[/C][C]Triangular[/C][C]Biweight[/C][C]Cosine[/C][C]Optcosine[/C][/ROW]
[ROW][C]Kernel Density Values are not shown[/C][/ROW]
[/TABLE]
Source: https://freestatistics.org/blog/index.php?pk=&T=3

Globally Unique Identifier (entire table): ba.freestatistics.org/blog/index.php?pk=&T=3

As an alternative you can also use a QR Code:  

The GUIDs for individual cells are displayed in the table below:

Kernel Density Values
x-valueGaussianEpanechnikovRectangularTriangularBiweightCosineOptcosine
Kernel Density Values are not shown


Parameters (Session):
par1 = 0 ; par2 = no ; par3 = 512 ;
Parameters (R input):
par1 = 0 ; par2 = no ; par3 = 512 ;
R code (references can be found in the software module):
par3 <- '512'
par2 <- 'no'
par1 <- '0'
if (par1 == '0') bw <- 'nrd0'
if (par1 != '0') bw <- as.numeric(par1)
par3 <- as.numeric(par3)
mydensity <- array(NA, dim=c(par3,8))
bitmap(file='density1.png')
mydensity1<-density(x,bw=bw,kernel='gaussian',na.rm=TRUE)
mydensity[,8] = signif(mydensity1$x,3)
mydensity[,1] = signif(mydensity1$y,3)
plot(mydensity1,main='Gaussian Kernel',xlab=xlab,ylab=ylab)
grid()
dev.off()
mydensity1
bitmap(file='density2.png')
mydensity2<-density(x,bw=bw,kernel='epanechnikov',na.rm=TRUE)
mydensity[,2] = signif(mydensity2$y,3)
plot(mydensity2,main='Epanechnikov Kernel',xlab=xlab,ylab=ylab)
grid()
dev.off()
bitmap(file='density3.png')
mydensity3<-density(x,bw=bw,kernel='rectangular',na.rm=TRUE)
mydensity[,3] = signif(mydensity3$y,3)
plot(mydensity3,main='Rectangular Kernel',xlab=xlab,ylab=ylab)
grid()
dev.off()
bitmap(file='density4.png')
mydensity4<-density(x,bw=bw,kernel='triangular',na.rm=TRUE)
mydensity[,4] = signif(mydensity4$y,3)
plot(mydensity4,main='Triangular Kernel',xlab=xlab,ylab=ylab)
grid()
dev.off()
bitmap(file='density5.png')
mydensity5<-density(x,bw=bw,kernel='biweight',na.rm=TRUE)
mydensity[,5] = signif(mydensity5$y,3)
plot(mydensity5,main='Biweight Kernel',xlab=xlab,ylab=ylab)
grid()
dev.off()
bitmap(file='density6.png')
mydensity6<-density(x,bw=bw,kernel='cosine',na.rm=TRUE)
mydensity[,6] = signif(mydensity6$y,3)
plot(mydensity6,main='Cosine Kernel',xlab=xlab,ylab=ylab)
grid()
dev.off()
bitmap(file='density7.png')
mydensity7<-density(x,bw=bw,kernel='optcosine',na.rm=TRUE)
mydensity[,7] = signif(mydensity7$y,3)
plot(mydensity7,main='Optcosine Kernel',xlab=xlab,ylab=ylab)
grid()
dev.off()
load(file='createtable')
ab<-table.start()
ab<-table.row.start(ab)
ab<-table.element(ab,'Properties of Density Trace',2,TRUE)
ab<-table.row.end(ab)
ab<-table.row.start(ab)
ab<-table.element(ab,'Bandwidth',header=TRUE)
ab<-table.element(ab,mydensity1$bw)
ab<-table.row.end(ab)
ab<-table.row.start(ab)
ab<-table.element(ab,'#Observations',header=TRUE)
ab<-table.element(ab,mydensity1$n)
ab<-table.row.end(ab)
ab<-table.end(ab)
a <- ab
table.save(ab,file='mytable123.tab')
b<-table.start()
b<-table.row.start(b)
b<-table.element(b,'Maximum Density Values',3,TRUE)
b<-table.row.end(b)
b<-table.row.start(b)
b<-table.element(b,'Kernel',1,TRUE)
b<-table.element(b,'x-value',1,TRUE)
b<-table.element(b,'max. density',1,TRUE)
b<-table.row.end(b)
b<-table.row.start(b)
b<-table.element(b,'Gaussian',1,TRUE)
b<-table.element(b,mydensity1$x[mydensity1$y==max(mydensity1$y)],1)
b<-table.element(b,mydensity1$y[mydensity1$y==max(mydensity1$y)],1)
b<-table.row.end(b)
b<-table.row.start(b)
b<-table.element(b,'Epanechnikov',1,TRUE)
b<-table.element(b,mydensity2$x[mydensity2$y==max(mydensity2$y)],1)
b<-table.element(b,mydensity2$y[mydensity2$y==max(mydensity2$y)],1)
b<-table.row.end(b)
b<-table.row.start(b)
b<-table.element(b,'Rectangular',1,TRUE)
b<-table.element(b,mydensity3$x[mydensity3$y==max(mydensity3$y)],1)
b<-table.element(b,mydensity3$y[mydensity3$y==max(mydensity3$y)],1)
b<-table.row.end(b)
b<-table.row.start(b)
b<-table.element(b,'Triangular',1,TRUE)
b<-table.element(b,mydensity4$x[mydensity4$y==max(mydensity4$y)],1)
b<-table.element(b,mydensity4$y[mydensity4$y==max(mydensity4$y)],1)
b<-table.row.end(b)
b<-table.row.start(b)
b<-table.element(b,'Biweight',1,TRUE)
b<-table.element(b,mydensity5$x[mydensity5$y==max(mydensity5$y)],1)
b<-table.element(b,mydensity5$y[mydensity5$y==max(mydensity5$y)],1)
b<-table.row.end(b)
b<-table.row.start(b)
b<-table.element(b,'Cosine',1,TRUE)
b<-table.element(b,mydensity6$x[mydensity6$y==max(mydensity6$y)],1)
b<-table.element(b,mydensity6$y[mydensity6$y==max(mydensity6$y)],1)
b<-table.row.end(b)
b<-table.row.start(b)
b<-table.element(b,'Optcosine',1,TRUE)
b<-table.element(b,mydensity7$x[mydensity7$y==max(mydensity7$y)],1)
b<-table.element(b,mydensity7$y[mydensity7$y==max(mydensity7$y)],1)
b<-table.row.end(b)
b<-table.end(b)
a <- b[1]
table.save(b,file='mytable2a.tab')
a<-table.start()
a<-table.row.start(a)
a<-table.element(a,'Kernel Density Values',8,TRUE)
a<-table.row.end(a)
a<-table.row.start(a)
a<-table.element(a,'x-value',1,TRUE)
a<-table.element(a,'Gaussian',1,TRUE)
a<-table.element(a,'Epanechnikov',1,TRUE)
a<-table.element(a,'Rectangular',1,TRUE)
a<-table.element(a,'Triangular',1,TRUE)
a<-table.element(a,'Biweight',1,TRUE)
a<-table.element(a,'Cosine',1,TRUE)
a<-table.element(a,'Optcosine',1,TRUE)
a<-table.row.end(a)
if (par2=='yes') {
for(i in 1:par3) {
a<-table.row.start(a)
a<-table.element(a,mydensity[i,8],1,TRUE)
for(j in 1:7) {
a<-table.element(a,mydensity[i,j],1)
}
a<-table.row.end(a)
}
} else {
a<-table.row.start(a)
a<-table.element(a,'Kernel Density Values are not shown',8)
a<-table.row.end(a)
}
a<-table.end(a)
table.save(a,file='mytable1.tab')