Free Statistics
of Irreproducible Research!
Description of Statistical Computation | ||||||||||||||||||||||||||||||||||||||||||||||||||||||
|---|---|---|---|---|---|---|---|---|---|---|---|---|---|---|---|---|---|---|---|---|---|---|---|---|---|---|---|---|---|---|---|---|---|---|---|---|---|---|---|---|---|---|---|---|---|---|---|---|---|---|---|---|---|---|
| Author's title | ||||||||||||||||||||||||||||||||||||||||||||||||||||||
| Author | *Unverified author* | |||||||||||||||||||||||||||||||||||||||||||||||||||||
| R Software Module | rwasp_univariatedataseries.wasp | |||||||||||||||||||||||||||||||||||||||||||||||||||||
| Title produced by software | Univariate Data Series | |||||||||||||||||||||||||||||||||||||||||||||||||||||
| Date of computation | Wed, 02 Aug 2017 14:32:05 +0200 | |||||||||||||||||||||||||||||||||||||||||||||||||||||
| Cite this page as follows | Statistical Computations at FreeStatistics.org, Office for Research Development and Education, URL https://freestatistics.org/blog/index.php?v=date/2017/Aug/02/t150167721165zttznvbmpavom.htm/, Retrieved Sat, 18 May 2024 21:58:03 +0000 | |||||||||||||||||||||||||||||||||||||||||||||||||||||
| Statistical Computations at FreeStatistics.org, Office for Research Development and Education, URL https://freestatistics.org/blog/index.php?pk=306866, Retrieved Sat, 18 May 2024 21:58:03 +0000 | ||||||||||||||||||||||||||||||||||||||||||||||||||||||
| QR Codes: | ||||||||||||||||||||||||||||||||||||||||||||||||||||||
|
| ||||||||||||||||||||||||||||||||||||||||||||||||||||||
| Original text written by user: | ||||||||||||||||||||||||||||||||||||||||||||||||||||||
| IsPrivate? | No (this computation is public) | |||||||||||||||||||||||||||||||||||||||||||||||||||||
| User-defined keywords | ||||||||||||||||||||||||||||||||||||||||||||||||||||||
| Estimated Impact | 160 | |||||||||||||||||||||||||||||||||||||||||||||||||||||
Tree of Dependent Computations | ||||||||||||||||||||||||||||||||||||||||||||||||||||||
| Family? (F = Feedback message, R = changed R code, M = changed R Module, P = changed Parameters, D = changed Data) | ||||||||||||||||||||||||||||||||||||||||||||||||||||||
| - [Univariate Data Series] [] [2017-08-02 12:32:05] [ad161bcd2bdcbffd0567a2be7a0bbb46] [Current] | ||||||||||||||||||||||||||||||||||||||||||||||||||||||
| Feedback Forum | ||||||||||||||||||||||||||||||||||||||||||||||||||||||
Post a new message | ||||||||||||||||||||||||||||||||||||||||||||||||||||||
Dataset | ||||||||||||||||||||||||||||||||||||||||||||||||||||||
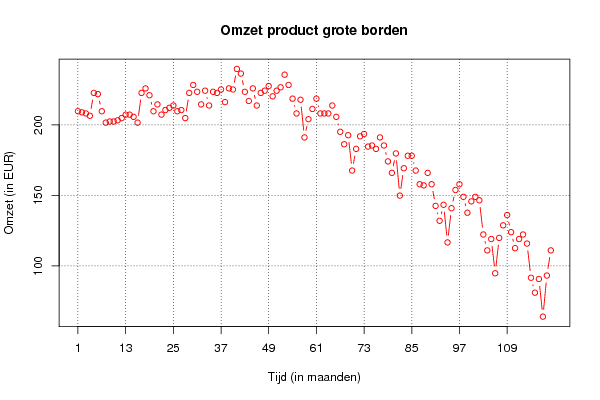
| Dataseries X: | ||||||||||||||||||||||||||||||||||||||||||||||||||||||
209,704 208,923 208,131 206,492 222,706 221,848 209,704 201,630 202,411 202,411 203,280 204,842 207,273 207,273 205,711 201,630 222,706 225,918 221,067 209,704 214,566 207,273 210,562 212,135 213,774 209,704 210,562 204,842 222,706 228,349 223,498 214,566 224,279 213,774 223,498 222,706 225,137 216,205 225,918 225,137 239,712 236,423 223,498 216,986 225,918 213,774 222,706 224,279 227,568 220,286 224,279 226,710 235,642 228,349 218,636 208,131 217,855 191,125 204,061 211,343 218,636 208,131 208,131 208,131 213,774 205,711 195,129 186,274 192,698 167,618 182,985 191,917 193,556 184,624 185,405 182,985 191,125 185,405 174,130 165,979 179,762 149,831 169,268 178,123 178,123 167,618 157,905 157,124 165,979 157,905 142,549 131,967 143,330 116,611 140,899 153,824 157,905 148,973 137,687 145,761 148,973 146,542 122,243 110,968 119,031 94,743 119,823 128,755 136,037 123,893 112,530 119,031 122,243 115,819 91,531 80,949 90,662 63,943 93,093 110,968 | ||||||||||||||||||||||||||||||||||||||||||||||||||||||
Tables (Output of Computation) | ||||||||||||||||||||||||||||||||||||||||||||||||||||||
| ||||||||||||||||||||||||||||||||||||||||||||||||||||||
Figures (Output of Computation) | ||||||||||||||||||||||||||||||||||||||||||||||||||||||
Input Parameters & R Code | ||||||||||||||||||||||||||||||||||||||||||||||||||||||
| Parameters (Session): | ||||||||||||||||||||||||||||||||||||||||||||||||||||||
| par1 = Omzet product grote borden ; par2 = kdg ; par3 = Omzet grote borden in euro op jaarbasis ; par4 = 12 ; | ||||||||||||||||||||||||||||||||||||||||||||||||||||||
| Parameters (R input): | ||||||||||||||||||||||||||||||||||||||||||||||||||||||
| par1 = Omzet product grote borden ; par2 = kdg ; par3 = Omzet grote borden in euro op jaarbasis ; par4 = 12 ; | ||||||||||||||||||||||||||||||||||||||||||||||||||||||
| R code (references can be found in the software module): | ||||||||||||||||||||||||||||||||||||||||||||||||||||||
par4 <- '12' | ||||||||||||||||||||||||||||||||||||||||||||||||||||||