Free Statistics

of Irreproducible Research!

Author's title

Author*The author of this computation has been verified*
R Software Modulerwasp_correlation.wasp
Title produced by softwarePearson Correlation
Date of computationThu, 07 Dec 2017 17:26:09 +0100
Cite this page as followsStatistical Computations at FreeStatistics.org, Office for Research Development and Education, URL https://freestatistics.org/blog/index.php?v=date/2017/Dec/07/t15126639933o82besbantuccv.htm/, Retrieved Wed, 15 May 2024 18:28:12 +0000
Statistical Computations at FreeStatistics.org, Office for Research Development and Education, URL https://freestatistics.org/blog/index.php?pk=308737, Retrieved Wed, 15 May 2024 18:28:12 +0000
QR Codes:

Original text written by user:
IsPrivate?No (this computation is public)
User-defined keywords
Estimated Impact121
Family? (F = Feedback message, R = changed R code, M = changed R Module, P = changed Parameters, D = changed Data)
-       [Pearson Correlation] [Pearson correlati...] [2017-12-07 16:26:09] [0553ded3e3c4af9d05e2b3f12829db4c] [Current]
Feedback Forum

Post a new message
Dataseries X:
594
594
722
953
892
855
855
855
855
951
951
727
855
855
963
951
963
855
963
855
963
893
952
893
815
965
866
965
866
965
1033
965
296
682
616
957
718
798
890
890
622
960
722
951
828
790
781
963
1132
964
964
964
780
936
719
704
959
674
777
719
719
719
777
798
777
951
824
1093
823
669
961
763
541
823
615
965
754
965
965
567
853
921
708
879
674
853
754
594
594
594
578
935
754
886
856
853
900
951
964
951
856
951
951
951
951
964
593
803
754
951
856
951
856
593
436
709
560
513
670
1020
962
692
916
1020
1112
916
1112
962
867
1125
880
1020
880
1020
1182
962
915
962
880
867
915
1020
440
440
440
514
597
597
514
280
537
713
579
279
879
440
440
617
Dataseries Y:
30277
30277
47262
110000
101353
70367
70367
70367
70367
110239
110000
46052
70367
70367
86000
110000
88500
70367
88500
70367
88500
101509
110000
101509
70606
91000
77713
91000
77713
91000
122000
91000
2329
47225
28430
85619
52926
53872
105000
105000
25000
86000
53049
112000
75166
68000
51004
70327
151400
90000
83338
83000
61000
86000
55451
33920
81769
38000
59652
55451
55451
55451
63000
53872
63000
85000
58600
133500
58825
35143
89600
59058
16852
58600
34250
90000
50760
93000
91000
38000
77104
81000
42000
75338
28000
77104
50760
30277
30277
30277
22080
85000
45000
76000
77000
69153
115000
116000
91627
116000
77499
113000
113000
108865
108806
91627
30277
69845
44348
113000
77499
108977
77499
30277
12500
50000
33000
19200
46000
138000
90090
48563
74137
138000
158000
74137
160000
90090
70000
158000
73941
138000
73941
138000
220000
90090
78491
90090
73192
70000
78491
138000
10000
10000
10000
16800
25000
25000
16800
3341
19093
42000
40053
3341
76800
5350
5350
14745


Summary of computational transaction
Raw Input view raw input (R code)
Raw Outputview raw output of R engine
Computing time5 seconds
R ServerBig Analytics Cloud Computing Center

\begin{tabular}{lllllllll}
\hline
Summary of computational transaction \tabularnewline
Raw Input view raw input (R code)  \tabularnewline
Raw Outputview raw output of R engine  \tabularnewline
Computing time5 seconds \tabularnewline
R ServerBig Analytics Cloud Computing Center \tabularnewline
\hline
\end{tabular}
%Source: https://freestatistics.org/blog/index.php?pk=308737&T=0

[TABLE]
[ROW]
Summary of computational transaction[/C][/ROW] [ROW]Raw Input[/C] view raw input (R code) [/C][/ROW] [ROW]Raw Output[/C]view raw output of R engine [/C][/ROW] [ROW]Computing time[/C]5 seconds[/C][/ROW] [ROW]R Server[/C]Big Analytics Cloud Computing Center[/C][/ROW] [/TABLE] Source: https://freestatistics.org/blog/index.php?pk=308737&T=0

Globally Unique Identifier (entire table): ba.freestatistics.org/blog/index.php?pk=308737&T=0

As an alternative you can also use a QR Code:  

The GUIDs for individual cells are displayed in the table below:

Summary of computational transaction
Raw Input view raw input (R code)
Raw Outputview raw output of R engine
Computing time5 seconds
R ServerBig Analytics Cloud Computing Center


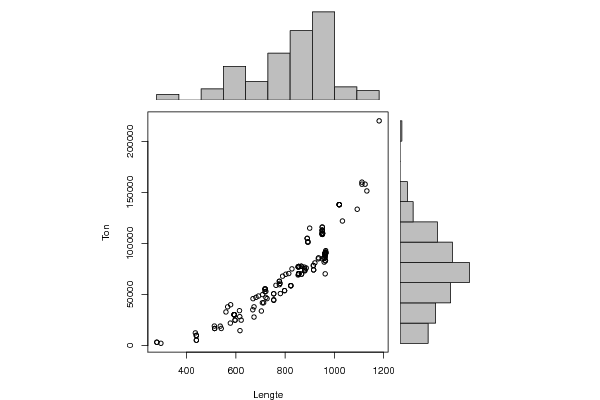
Pearson Product Moment Correlation - Ungrouped Data
StatisticVariable XVariable Y
Mean813.06329113924171284.670886076
Biased Variance31961.89472840891377266254.01827
Biased Standard Deviation178.77889900211637111.5380174181
Covariance6158671.29484802
Correlation0.922368322042618
Determination0.850763321507715
T-Test29.8214592539112
p-value (2 sided)2.52110750534554e-66
p-value (1 sided)1.26055375267277e-66
95% CI of Correlation[0.895145920181242, 0.942736746389601]
Degrees of Freedom156
Number of Observations158

\begin{tabular}{lllllllll}
\hline
Pearson Product Moment Correlation - Ungrouped Data \tabularnewline
Statistic & Variable X & Variable Y \tabularnewline
Mean & 813.063291139241 & 71284.670886076 \tabularnewline
Biased Variance & 31961.8947284089 & 1377266254.01827 \tabularnewline
Biased Standard Deviation & 178.778899002116 & 37111.5380174181 \tabularnewline
Covariance & 6158671.29484802 \tabularnewline
Correlation & 0.922368322042618 \tabularnewline
Determination & 0.850763321507715 \tabularnewline
T-Test & 29.8214592539112 \tabularnewline
p-value (2 sided) & 2.52110750534554e-66 \tabularnewline
p-value (1 sided) & 1.26055375267277e-66 \tabularnewline
95% CI of Correlation & [0.895145920181242, 0.942736746389601] \tabularnewline
Degrees of Freedom & 156 \tabularnewline
Number of Observations & 158 \tabularnewline
\hline
\end{tabular}
%Source: https://freestatistics.org/blog/index.php?pk=308737&T=1

[TABLE]
[ROW][C]Pearson Product Moment Correlation - Ungrouped Data[/C][/ROW]
[ROW][C]Statistic[/C][C]Variable X[/C][C]Variable Y[/C][/ROW]
[ROW][C]Mean[/C][C]813.063291139241[/C][C]71284.670886076[/C][/ROW]
[ROW][C]Biased Variance[/C][C]31961.8947284089[/C][C]1377266254.01827[/C][/ROW]
[ROW][C]Biased Standard Deviation[/C][C]178.778899002116[/C][C]37111.5380174181[/C][/ROW]
[ROW][C]Covariance[/C][C]6158671.29484802[/C][/ROW]
[ROW][C]Correlation[/C][C]0.922368322042618[/C][/ROW]
[ROW][C]Determination[/C][C]0.850763321507715[/C][/ROW]
[ROW][C]T-Test[/C][C]29.8214592539112[/C][/ROW]
[ROW][C]p-value (2 sided)[/C][C]2.52110750534554e-66[/C][/ROW]
[ROW][C]p-value (1 sided)[/C][C]1.26055375267277e-66[/C][/ROW]
[ROW][C]95% CI of Correlation[/C][C][0.895145920181242, 0.942736746389601][/C][/ROW]
[ROW][C]Degrees of Freedom[/C][C]156[/C][/ROW]
[ROW][C]Number of Observations[/C][C]158[/C][/ROW]
[/TABLE]
Source: https://freestatistics.org/blog/index.php?pk=308737&T=1

Globally Unique Identifier (entire table): ba.freestatistics.org/blog/index.php?pk=308737&T=1

As an alternative you can also use a QR Code:  

The GUIDs for individual cells are displayed in the table below:

Pearson Product Moment Correlation - Ungrouped Data
StatisticVariable XVariable Y
Mean813.06329113924171284.670886076
Biased Variance31961.89472840891377266254.01827
Biased Standard Deviation178.77889900211637111.5380174181
Covariance6158671.29484802
Correlation0.922368322042618
Determination0.850763321507715
T-Test29.8214592539112
p-value (2 sided)2.52110750534554e-66
p-value (1 sided)1.26055375267277e-66
95% CI of Correlation[0.895145920181242, 0.942736746389601]
Degrees of Freedom156
Number of Observations158


Normality Tests
> jarque.x
	Jarque-Bera Normality Test
data:  x
JB = 16.273, p-value = 0.0002926
alternative hypothesis: greater
> jarque.y
	Jarque-Bera Normality Test
data:  y
JB = 10.898, p-value = 0.004301
alternative hypothesis: greater
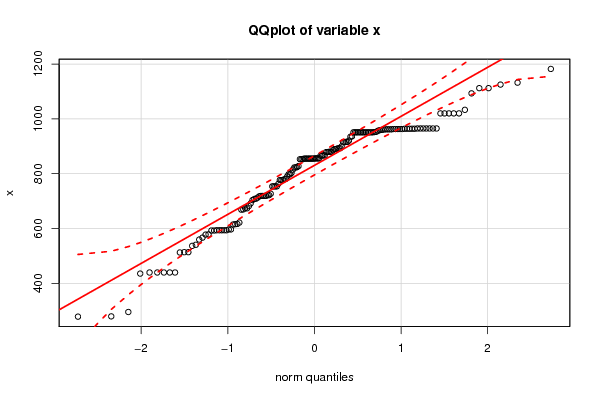
> ad.x
	Anderson-Darling normality test
data:  x
A = 3.8144, p-value = 1.505e-09
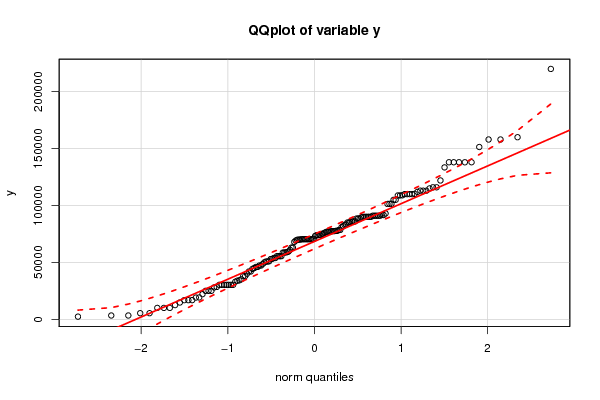
> ad.y
	Anderson-Darling normality test
data:  y
A = 0.71255, p-value = 0.06177

\begin{tabular}{lllllllll}
\hline
Normality Tests \tabularnewline
> jarque.x
	Jarque-Bera Normality Test
data:  x
JB = 16.273, p-value = 0.0002926
alternative hypothesis: greater
\tabularnewline
> jarque.y
	Jarque-Bera Normality Test
data:  y
JB = 10.898, p-value = 0.004301
alternative hypothesis: greater
\tabularnewline
> ad.x
	Anderson-Darling normality test
data:  x
A = 3.8144, p-value = 1.505e-09
\tabularnewline
> ad.y
	Anderson-Darling normality test
data:  y
A = 0.71255, p-value = 0.06177
\tabularnewline \hline \end{tabular} %Source: https://freestatistics.org/blog/index.php?pk=308737&T=2

[TABLE]
[ROW][C]Normality Tests[/C][/ROW]
[ROW][C]
> jarque.x
	Jarque-Bera Normality Test
data:  x
JB = 16.273, p-value = 0.0002926
alternative hypothesis: greater
[/C][/ROW] [ROW][C]
> jarque.y
	Jarque-Bera Normality Test
data:  y
JB = 10.898, p-value = 0.004301
alternative hypothesis: greater
[/C][/ROW] [ROW][C]
> ad.x
	Anderson-Darling normality test
data:  x
A = 3.8144, p-value = 1.505e-09
[/C][/ROW] [ROW][C]
> ad.y
	Anderson-Darling normality test
data:  y
A = 0.71255, p-value = 0.06177
[/C][/ROW] [/TABLE] Source: https://freestatistics.org/blog/index.php?pk=308737&T=2

Globally Unique Identifier (entire table): ba.freestatistics.org/blog/index.php?pk=308737&T=2

As an alternative you can also use a QR Code:  

The GUIDs for individual cells are displayed in the table below:

Normality Tests
> jarque.x
	Jarque-Bera Normality Test
data:  x
JB = 16.273, p-value = 0.0002926
alternative hypothesis: greater
> jarque.y
	Jarque-Bera Normality Test
data:  y
JB = 10.898, p-value = 0.004301
alternative hypothesis: greater
> ad.x
	Anderson-Darling normality test
data:  x
A = 3.8144, p-value = 1.505e-09
> ad.y
	Anderson-Darling normality test
data:  y
A = 0.71255, p-value = 0.06177


Parameters (Session):
Parameters (R input):
R code (references can be found in the software module):
library(psychometric)
x <- x[!is.na(y)]
y <- y[!is.na(y)]
y <- y[!is.na(x)]
x <- x[!is.na(x)]
bitmap(file='test1.png')
histx <- hist(x, plot=FALSE)
histy <- hist(y, plot=FALSE)
maxcounts <- max(c(histx$counts, histx$counts))
xrange <- c(min(x),max(x))
yrange <- c(min(y),max(y))
nf <- layout(matrix(c(2,0,1,3),2,2,byrow=TRUE), c(3,1), c(1,3), TRUE)
par(mar=c(4,4,1,1))
plot(x, y, xlim=xrange, ylim=yrange, xlab=xlab, ylab=ylab, sub=main)
par(mar=c(0,4,1,1))
barplot(histx$counts, axes=FALSE, ylim=c(0, maxcounts), space=0)
par(mar=c(4,0,1,1))
barplot(histy$counts, axes=FALSE, xlim=c(0, maxcounts), space=0, horiz=TRUE)
dev.off()
lx = length(x)
makebiased = (lx-1)/lx
varx = var(x)*makebiased
vary = var(y)*makebiased
corxy <- cor.test(x,y,method='pearson', na.rm = T)
cxy <- as.matrix(corxy$estimate)[1,1]
load(file='createtable')
a<-table.start()
a<-table.row.start(a)
a<-table.element(a,'Pearson Product Moment Correlation - Ungrouped Data',3,TRUE)
a<-table.row.end(a)
a<-table.row.start(a)
a<-table.element(a,'Statistic',1,TRUE)
a<-table.element(a,'Variable X',1,TRUE)
a<-table.element(a,'Variable Y',1,TRUE)
a<-table.row.end(a)
a<-table.row.start(a)
a<-table.element(a,'Mean',header=TRUE)
a<-table.element(a,mean(x))
a<-table.element(a,mean(y))
a<-table.row.end(a)
a<-table.row.start(a)
a<-table.element(a,'Biased Variance',header=TRUE)
a<-table.element(a,varx)
a<-table.element(a,vary)
a<-table.row.end(a)
a<-table.row.start(a)
a<-table.element(a,'Biased Standard Deviation',header=TRUE)
a<-table.element(a,sqrt(varx))
a<-table.element(a,sqrt(vary))
a<-table.row.end(a)
a<-table.row.start(a)
a<-table.element(a,'Covariance',header=TRUE)
a<-table.element(a,cov(x,y),2)
a<-table.row.end(a)
a<-table.row.start(a)
a<-table.element(a,'Correlation',header=TRUE)
a<-table.element(a,cxy,2)
a<-table.row.end(a)
a<-table.row.start(a)
a<-table.element(a,'Determination',header=TRUE)
a<-table.element(a,cxy*cxy,2)
a<-table.row.end(a)
a<-table.row.start(a)
a<-table.element(a,'T-Test',header=TRUE)
a<-table.element(a,as.matrix(corxy$statistic)[1,1],2)
a<-table.row.end(a)
a<-table.row.start(a)
a<-table.element(a,'p-value (2 sided)',header=TRUE)
a<-table.element(a,(p2 <- as.matrix(corxy$p.value)[1,1]),2)
a<-table.row.end(a)
a<-table.row.start(a)
a<-table.element(a,'p-value (1 sided)',header=TRUE)
a<-table.element(a,p2/2,2)
a<-table.row.end(a)
a<-table.row.start(a)
a<-table.element(a,'95% CI of Correlation',header=TRUE)
a<-table.element(a,paste('[',CIr(r=cxy, n = lx, level = .95)[1],', ', CIr(r=cxy, n = lx, level = .95)[2],']',sep=''),2)
a<-table.row.end(a)
a<-table.row.start(a)
a<-table.element(a,'Degrees of Freedom',header=TRUE)
a<-table.element(a,lx-2,2)
a<-table.row.end(a)
a<-table.row.start(a)
a<-table.element(a,'Number of Observations',header=TRUE)
a<-table.element(a,lx,2)
a<-table.row.end(a)
a<-table.end(a)
table.save(a,file='mytable.tab')
library(moments)
library(nortest)
jarque.x <- jarque.test(x)
jarque.y <- jarque.test(y)
if(lx>7) {
ad.x <- ad.test(x)
ad.y <- ad.test(y)
}
a<-table.start()
a<-table.row.start(a)
a<-table.element(a,'Normality Tests',1,TRUE)
a<-table.row.end(a)
a<-table.row.start(a)
a<-table.element(a,paste('
',RC.texteval('jarque.x'),'
',sep=''))
a<-table.row.end(a)
a<-table.row.start(a)
a<-table.element(a,paste('
',RC.texteval('jarque.y'),'
',sep=''))
a<-table.row.end(a)
if(lx>7) {
a<-table.row.start(a)
a<-table.element(a,paste('
',RC.texteval('ad.x'),'
',sep=''))
a<-table.row.end(a)
a<-table.row.start(a)
a<-table.element(a,paste('
',RC.texteval('ad.y'),'
',sep=''))
a<-table.row.end(a)
}
a<-table.end(a)
table.save(a,file='mytable1.tab')
library(car)
bitmap(file='test2.png')
qqPlot(x,main='QQplot of variable x')
dev.off()
bitmap(file='test3.png')
qqPlot(y,main='QQplot of variable y')
dev.off()