Free Statistics
of Irreproducible Research!
Description of Statistical Computation | ||||||||||||||||||||||||||||||||||||||||||||||||||||||
|---|---|---|---|---|---|---|---|---|---|---|---|---|---|---|---|---|---|---|---|---|---|---|---|---|---|---|---|---|---|---|---|---|---|---|---|---|---|---|---|---|---|---|---|---|---|---|---|---|---|---|---|---|---|---|
| Author's title | ||||||||||||||||||||||||||||||||||||||||||||||||||||||
| Author | *The author of this computation has been verified* | |||||||||||||||||||||||||||||||||||||||||||||||||||||
| R Software Module | rwasp_bidensity.wasp | |||||||||||||||||||||||||||||||||||||||||||||||||||||
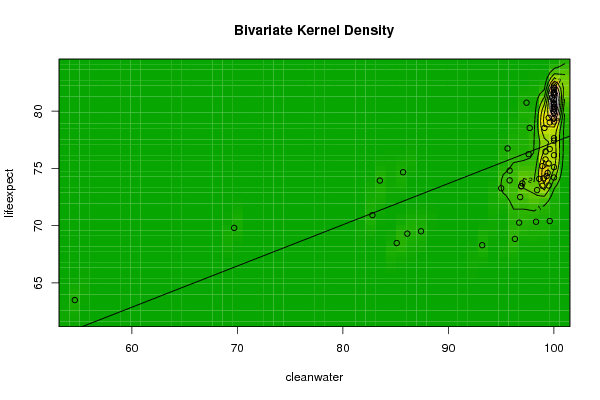
| Title produced by software | Bivariate Kernel Density Estimation | |||||||||||||||||||||||||||||||||||||||||||||||||||||
| Date of computation | Thu, 21 Dec 2017 10:59:09 +0100 | |||||||||||||||||||||||||||||||||||||||||||||||||||||
| Cite this page as follows | Statistical Computations at FreeStatistics.org, Office for Research Development and Education, URL https://freestatistics.org/blog/index.php?v=date/2017/Dec/21/t151385041096l8k2gruvb9yrz.htm/, Retrieved Wed, 22 May 2024 06:34:27 +0000 | |||||||||||||||||||||||||||||||||||||||||||||||||||||
| Statistical Computations at FreeStatistics.org, Office for Research Development and Education, URL https://freestatistics.org/blog/index.php?pk=310598, Retrieved Wed, 22 May 2024 06:34:27 +0000 | ||||||||||||||||||||||||||||||||||||||||||||||||||||||
| QR Codes: | ||||||||||||||||||||||||||||||||||||||||||||||||||||||
|
| ||||||||||||||||||||||||||||||||||||||||||||||||||||||
| Original text written by user: | ||||||||||||||||||||||||||||||||||||||||||||||||||||||
| IsPrivate? | No (this computation is public) | |||||||||||||||||||||||||||||||||||||||||||||||||||||
| User-defined keywords | improved water source vs. life expectancy | |||||||||||||||||||||||||||||||||||||||||||||||||||||
| Estimated Impact | 92 | |||||||||||||||||||||||||||||||||||||||||||||||||||||
Tree of Dependent Computations | ||||||||||||||||||||||||||||||||||||||||||||||||||||||
| Family? (F = Feedback message, R = changed R code, M = changed R Module, P = changed Parameters, D = changed Data) | ||||||||||||||||||||||||||||||||||||||||||||||||||||||
| - [Bivariate Kernel Density Estimation] [Bivariate Kernel ...] [2017-12-21 09:59:09] [97ca58e32232a99e44a6c848c7facc09] [Current] | ||||||||||||||||||||||||||||||||||||||||||||||||||||||
| Feedback Forum | ||||||||||||||||||||||||||||||||||||||||||||||||||||||
Post a new message | ||||||||||||||||||||||||||||||||||||||||||||||||||||||
Dataset | ||||||||||||||||||||||||||||||||||||||||||||||||||||||
| Dataseries X: | ||||||||||||||||||||||||||||||||||||||||||||||||||||||
95,6 85,7 98,4 100 82,8 100 99,6 100 99,2 99,5 99,8 99,2 100 100 100 98,3 99,5 100 100 96,8 100 100 100 100 95,8 85,1 97,4 100 100 96,9 93,2 99 86,1 98,9 97,7 95 100 99,4 87,4 98,9 83,5 100 100 97,6 99,6 100 96,9 96,3 97 99,3 100 99,5 100 100 100 69,7 95,8 98,6 96,7 99,6 100 99,1 54,6 | ||||||||||||||||||||||||||||||||||||||||||||||||||||||
| Dataseries Y: | ||||||||||||||||||||||||||||||||||||||||||||||||||||||
76,74790244 74,66978049 73,10929268 80,5804878 70,91860976 76,15531707 70,40487805 80,18292683 75,79373171 73,51219512 81,19756098 76,47560976 79,38495122 77,42439024 79,1 70,34141463 75,42926829 79,87073171 81,66341463 72,49804878 79,98780488 80,38780488 74,20731707 81,89756098 73,95619512 68,48217073 80,74390244 81,60243902 82,03658537 73,43839024 68,29536585 74,13285366 69,3 73,48292683 78,53826829 73,26829268 80,63170732 74,60409756 69,51065854 75,20353659 73,94107317 80,70243902 80,99756098 76,24634146 79,02682927 77,6404878 73,45853659 68,84121951 73,70014634 74,33658537 75,11219512 79,42195122 81,62682927 81,45121951 82,24634146 69,80236585 74,81126829 74,09404878 70,26536585 76,69487805 80,40243902 78,54146341 63,4982439 | ||||||||||||||||||||||||||||||||||||||||||||||||||||||
Tables (Output of Computation) | ||||||||||||||||||||||||||||||||||||||||||||||||||||||
| ||||||||||||||||||||||||||||||||||||||||||||||||||||||
Figures (Output of Computation) | ||||||||||||||||||||||||||||||||||||||||||||||||||||||
Input Parameters & R Code | ||||||||||||||||||||||||||||||||||||||||||||||||||||||
| Parameters (Session): | ||||||||||||||||||||||||||||||||||||||||||||||||||||||
| par1 = 50 ; par2 = 50 ; par3 = 0 ; par4 = 0 ; par5 = 0 ; par6 = Y ; par7 = Y ; par8 = terrain.colors ; | ||||||||||||||||||||||||||||||||||||||||||||||||||||||
| Parameters (R input): | ||||||||||||||||||||||||||||||||||||||||||||||||||||||
| par1 = 50 ; par2 = 50 ; par3 = 0 ; par4 = 0 ; par5 = 0 ; par6 = Y ; par7 = Y ; par8 = terrain.colors ; | ||||||||||||||||||||||||||||||||||||||||||||||||||||||
| R code (references can be found in the software module): | ||||||||||||||||||||||||||||||||||||||||||||||||||||||
par1 <- as(par1,'numeric') | ||||||||||||||||||||||||||||||||||||||||||||||||||||||


