Free Statistics

of Irreproducible Research!

Author's title

Author*Unverified author*
R Software Modulerwasp_autocorrelation.wasp
Title produced by software(Partial) Autocorrelation Function
Date of computationThu, 05 Jan 2017 15:04:28 +0000
Cite this page as followsStatistical Computations at FreeStatistics.org, Office for Research Development and Education, URL https://freestatistics.org/blog/index.php?v=date/2017/Jan/05/t1483628949yfmwh2qghpc76fl.htm/, Retrieved Tue, 14 May 2024 14:18:43 +0200
Statistical Computations at FreeStatistics.org, Office for Research Development and Education, URL https://freestatistics.org/blog/index.php?pk=, Retrieved Tue, 14 May 2024 14:18:43 +0200
QR Codes:

Original text written by user:
IsPrivate?No (this computation is public)
User-defined keywords
Estimated Impact0
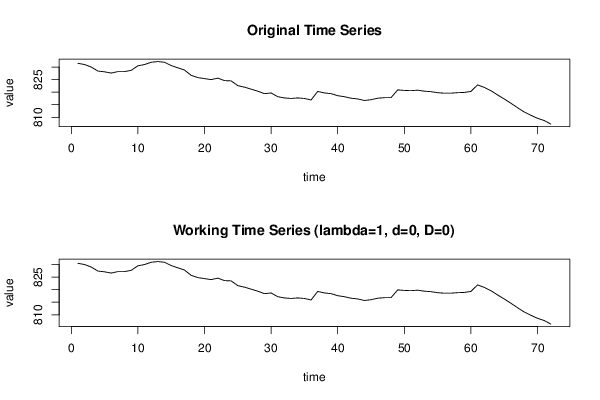
Dataseries X:
831,5
831
830
828,4
828,1
827,6
828,2
828,2
828,7
830,5
831
831,9
832,2
831,9
830,6
829,7
828,8
826,7
825,8
825,4
825
825,6
824,6
824,5
822,6
822
821,2
820,4
819,4
819,7
818,2
817,7
817,5
817,7
817,5
816,9
820,3
819,7
819,4
818,6
818,2
817,6
817,3
816,7
817
817,6
817,8
817,8
820,9
820,7
820,6
820,8
820,4
820,2
819,8
819,6
819,6
819,8
819,9
820,3
822,9
821,9
820,6
818,9
817,3
815,6
813,8
812,1
810,8
809,6
808,7
807,3


Summary of computational transaction
Raw Inputview raw input (R code)
Raw Outputview raw output of R engine
Computing time2 seconds
R Server'Gwilym Jenkins' @ jenkins.wessa.net

\begin{tabular}{lllllllll}
\hline
Summary of computational transaction \tabularnewline
Raw Input & view raw input (R code)  \tabularnewline
Raw Output & view raw output of R engine  \tabularnewline
Computing time & 2 seconds \tabularnewline
R Server & 'Gwilym Jenkins' @ jenkins.wessa.net \tabularnewline
\hline
\end{tabular}
%Source: https://freestatistics.org/blog/index.php?pk=&T=0

[TABLE]
[ROW][C]Summary of computational transaction[/C][/ROW]
[ROW][C]Raw Input[/C][C]view raw input (R code) [/C][/ROW]
[ROW][C]Raw Output[/C][C]view raw output of R engine [/C][/ROW]
[ROW][C]Computing time[/C][C]2 seconds[/C][/ROW]
[ROW][C]R Server[/C][C]'Gwilym Jenkins' @ jenkins.wessa.net[/C][/ROW]
[/TABLE]
Source: https://freestatistics.org/blog/index.php?pk=&T=0

Globally Unique Identifier (entire table): ba.freestatistics.org/blog/index.php?pk=&T=0

As an alternative you can also use a QR Code:  

The GUIDs for individual cells are displayed in the table below:

Summary of computational transaction
Raw Inputview raw input (R code)
Raw Outputview raw output of R engine
Computing time2 seconds
R Server'Gwilym Jenkins' @ jenkins.wessa.net


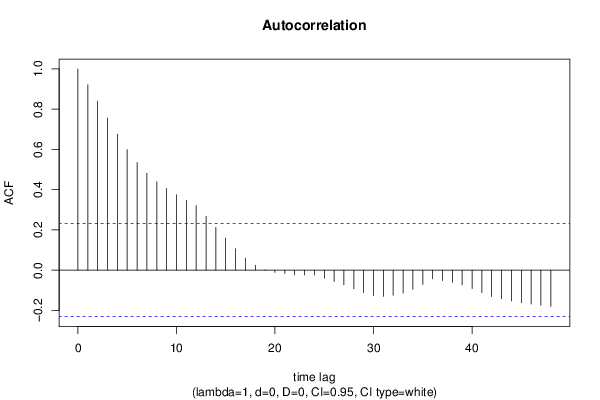
Autocorrelation Function
Time lag kACF(k)T-STATP-value
10.9212597.81710
20.8401537.12890
30.7555656.41120
40.6755785.73250
50.599295.08511e-06
60.5349774.53941.1e-05
70.4815624.08625.6e-05
80.4392273.7270.000191
90.4056733.44230.000482
100.3745483.17810.001092
110.3473212.94710.00216
120.3208062.72210.004065
130.2681722.27550.012926
140.2117431.79670.038289
150.1592381.35120.090435
160.1063460.90240.184933
170.0589790.50050.309141
180.0242350.20560.418826
190.0025230.02140.49149
20-0.011099-0.09420.462616
21-0.016856-0.1430.443332
22-0.023489-0.19930.421292
23-0.024066-0.20420.419385
24-0.023858-0.20240.42007
25-0.039758-0.33740.368414
26-0.056704-0.48120.315934
27-0.072272-0.61320.270823
28-0.09269-0.78650.217078
29-0.111319-0.94460.174018
30-0.126004-1.06920.144279
31-0.130069-1.10370.136705
32-0.124444-1.05590.147263
33-0.113374-0.9620.169631
34-0.094792-0.80430.211926
35-0.071615-0.60770.272658
36-0.04282-0.36330.358708
37-0.051428-0.43640.331932
38-0.060486-0.51320.304678
39-0.072341-0.61380.270631
40-0.090786-0.77030.221807
41-0.111455-0.94570.173726
42-0.130536-1.10760.135853
43-0.142025-1.20510.116052
44-0.152872-1.29720.099358
45-0.161266-1.36840.087723
46-0.168459-1.42940.078603
47-0.173614-1.47320.072532
48-0.180046-1.52770.065479

\begin{tabular}{lllllllll}
\hline
Autocorrelation Function \tabularnewline
Time lag k & ACF(k) & T-STAT & P-value \tabularnewline
1 & 0.921259 & 7.8171 & 0 \tabularnewline
2 & 0.840153 & 7.1289 & 0 \tabularnewline
3 & 0.755565 & 6.4112 & 0 \tabularnewline
4 & 0.675578 & 5.7325 & 0 \tabularnewline
5 & 0.59929 & 5.0851 & 1e-06 \tabularnewline
6 & 0.534977 & 4.5394 & 1.1e-05 \tabularnewline
7 & 0.481562 & 4.0862 & 5.6e-05 \tabularnewline
8 & 0.439227 & 3.727 & 0.000191 \tabularnewline
9 & 0.405673 & 3.4423 & 0.000482 \tabularnewline
10 & 0.374548 & 3.1781 & 0.001092 \tabularnewline
11 & 0.347321 & 2.9471 & 0.00216 \tabularnewline
12 & 0.320806 & 2.7221 & 0.004065 \tabularnewline
13 & 0.268172 & 2.2755 & 0.012926 \tabularnewline
14 & 0.211743 & 1.7967 & 0.038289 \tabularnewline
15 & 0.159238 & 1.3512 & 0.090435 \tabularnewline
16 & 0.106346 & 0.9024 & 0.184933 \tabularnewline
17 & 0.058979 & 0.5005 & 0.309141 \tabularnewline
18 & 0.024235 & 0.2056 & 0.418826 \tabularnewline
19 & 0.002523 & 0.0214 & 0.49149 \tabularnewline
20 & -0.011099 & -0.0942 & 0.462616 \tabularnewline
21 & -0.016856 & -0.143 & 0.443332 \tabularnewline
22 & -0.023489 & -0.1993 & 0.421292 \tabularnewline
23 & -0.024066 & -0.2042 & 0.419385 \tabularnewline
24 & -0.023858 & -0.2024 & 0.42007 \tabularnewline
25 & -0.039758 & -0.3374 & 0.368414 \tabularnewline
26 & -0.056704 & -0.4812 & 0.315934 \tabularnewline
27 & -0.072272 & -0.6132 & 0.270823 \tabularnewline
28 & -0.09269 & -0.7865 & 0.217078 \tabularnewline
29 & -0.111319 & -0.9446 & 0.174018 \tabularnewline
30 & -0.126004 & -1.0692 & 0.144279 \tabularnewline
31 & -0.130069 & -1.1037 & 0.136705 \tabularnewline
32 & -0.124444 & -1.0559 & 0.147263 \tabularnewline
33 & -0.113374 & -0.962 & 0.169631 \tabularnewline
34 & -0.094792 & -0.8043 & 0.211926 \tabularnewline
35 & -0.071615 & -0.6077 & 0.272658 \tabularnewline
36 & -0.04282 & -0.3633 & 0.358708 \tabularnewline
37 & -0.051428 & -0.4364 & 0.331932 \tabularnewline
38 & -0.060486 & -0.5132 & 0.304678 \tabularnewline
39 & -0.072341 & -0.6138 & 0.270631 \tabularnewline
40 & -0.090786 & -0.7703 & 0.221807 \tabularnewline
41 & -0.111455 & -0.9457 & 0.173726 \tabularnewline
42 & -0.130536 & -1.1076 & 0.135853 \tabularnewline
43 & -0.142025 & -1.2051 & 0.116052 \tabularnewline
44 & -0.152872 & -1.2972 & 0.099358 \tabularnewline
45 & -0.161266 & -1.3684 & 0.087723 \tabularnewline
46 & -0.168459 & -1.4294 & 0.078603 \tabularnewline
47 & -0.173614 & -1.4732 & 0.072532 \tabularnewline
48 & -0.180046 & -1.5277 & 0.065479 \tabularnewline
\hline
\end{tabular}
%Source: https://freestatistics.org/blog/index.php?pk=&T=1

[TABLE]
[ROW][C]Autocorrelation Function[/C][/ROW]
[ROW][C]Time lag k[/C][C]ACF(k)[/C][C]T-STAT[/C][C]P-value[/C][/ROW]
[ROW][C]1[/C][C]0.921259[/C][C]7.8171[/C][C]0[/C][/ROW]
[ROW][C]2[/C][C]0.840153[/C][C]7.1289[/C][C]0[/C][/ROW]
[ROW][C]3[/C][C]0.755565[/C][C]6.4112[/C][C]0[/C][/ROW]
[ROW][C]4[/C][C]0.675578[/C][C]5.7325[/C][C]0[/C][/ROW]
[ROW][C]5[/C][C]0.59929[/C][C]5.0851[/C][C]1e-06[/C][/ROW]
[ROW][C]6[/C][C]0.534977[/C][C]4.5394[/C][C]1.1e-05[/C][/ROW]
[ROW][C]7[/C][C]0.481562[/C][C]4.0862[/C][C]5.6e-05[/C][/ROW]
[ROW][C]8[/C][C]0.439227[/C][C]3.727[/C][C]0.000191[/C][/ROW]
[ROW][C]9[/C][C]0.405673[/C][C]3.4423[/C][C]0.000482[/C][/ROW]
[ROW][C]10[/C][C]0.374548[/C][C]3.1781[/C][C]0.001092[/C][/ROW]
[ROW][C]11[/C][C]0.347321[/C][C]2.9471[/C][C]0.00216[/C][/ROW]
[ROW][C]12[/C][C]0.320806[/C][C]2.7221[/C][C]0.004065[/C][/ROW]
[ROW][C]13[/C][C]0.268172[/C][C]2.2755[/C][C]0.012926[/C][/ROW]
[ROW][C]14[/C][C]0.211743[/C][C]1.7967[/C][C]0.038289[/C][/ROW]
[ROW][C]15[/C][C]0.159238[/C][C]1.3512[/C][C]0.090435[/C][/ROW]
[ROW][C]16[/C][C]0.106346[/C][C]0.9024[/C][C]0.184933[/C][/ROW]
[ROW][C]17[/C][C]0.058979[/C][C]0.5005[/C][C]0.309141[/C][/ROW]
[ROW][C]18[/C][C]0.024235[/C][C]0.2056[/C][C]0.418826[/C][/ROW]
[ROW][C]19[/C][C]0.002523[/C][C]0.0214[/C][C]0.49149[/C][/ROW]
[ROW][C]20[/C][C]-0.011099[/C][C]-0.0942[/C][C]0.462616[/C][/ROW]
[ROW][C]21[/C][C]-0.016856[/C][C]-0.143[/C][C]0.443332[/C][/ROW]
[ROW][C]22[/C][C]-0.023489[/C][C]-0.1993[/C][C]0.421292[/C][/ROW]
[ROW][C]23[/C][C]-0.024066[/C][C]-0.2042[/C][C]0.419385[/C][/ROW]
[ROW][C]24[/C][C]-0.023858[/C][C]-0.2024[/C][C]0.42007[/C][/ROW]
[ROW][C]25[/C][C]-0.039758[/C][C]-0.3374[/C][C]0.368414[/C][/ROW]
[ROW][C]26[/C][C]-0.056704[/C][C]-0.4812[/C][C]0.315934[/C][/ROW]
[ROW][C]27[/C][C]-0.072272[/C][C]-0.6132[/C][C]0.270823[/C][/ROW]
[ROW][C]28[/C][C]-0.09269[/C][C]-0.7865[/C][C]0.217078[/C][/ROW]
[ROW][C]29[/C][C]-0.111319[/C][C]-0.9446[/C][C]0.174018[/C][/ROW]
[ROW][C]30[/C][C]-0.126004[/C][C]-1.0692[/C][C]0.144279[/C][/ROW]
[ROW][C]31[/C][C]-0.130069[/C][C]-1.1037[/C][C]0.136705[/C][/ROW]
[ROW][C]32[/C][C]-0.124444[/C][C]-1.0559[/C][C]0.147263[/C][/ROW]
[ROW][C]33[/C][C]-0.113374[/C][C]-0.962[/C][C]0.169631[/C][/ROW]
[ROW][C]34[/C][C]-0.094792[/C][C]-0.8043[/C][C]0.211926[/C][/ROW]
[ROW][C]35[/C][C]-0.071615[/C][C]-0.6077[/C][C]0.272658[/C][/ROW]
[ROW][C]36[/C][C]-0.04282[/C][C]-0.3633[/C][C]0.358708[/C][/ROW]
[ROW][C]37[/C][C]-0.051428[/C][C]-0.4364[/C][C]0.331932[/C][/ROW]
[ROW][C]38[/C][C]-0.060486[/C][C]-0.5132[/C][C]0.304678[/C][/ROW]
[ROW][C]39[/C][C]-0.072341[/C][C]-0.6138[/C][C]0.270631[/C][/ROW]
[ROW][C]40[/C][C]-0.090786[/C][C]-0.7703[/C][C]0.221807[/C][/ROW]
[ROW][C]41[/C][C]-0.111455[/C][C]-0.9457[/C][C]0.173726[/C][/ROW]
[ROW][C]42[/C][C]-0.130536[/C][C]-1.1076[/C][C]0.135853[/C][/ROW]
[ROW][C]43[/C][C]-0.142025[/C][C]-1.2051[/C][C]0.116052[/C][/ROW]
[ROW][C]44[/C][C]-0.152872[/C][C]-1.2972[/C][C]0.099358[/C][/ROW]
[ROW][C]45[/C][C]-0.161266[/C][C]-1.3684[/C][C]0.087723[/C][/ROW]
[ROW][C]46[/C][C]-0.168459[/C][C]-1.4294[/C][C]0.078603[/C][/ROW]
[ROW][C]47[/C][C]-0.173614[/C][C]-1.4732[/C][C]0.072532[/C][/ROW]
[ROW][C]48[/C][C]-0.180046[/C][C]-1.5277[/C][C]0.065479[/C][/ROW]
[/TABLE]
Source: https://freestatistics.org/blog/index.php?pk=&T=1

Globally Unique Identifier (entire table): ba.freestatistics.org/blog/index.php?pk=&T=1

As an alternative you can also use a QR Code:  

The GUIDs for individual cells are displayed in the table below:

Autocorrelation Function
Time lag kACF(k)T-STATP-value
10.9212597.81710
20.8401537.12890
30.7555656.41120
40.6755785.73250
50.599295.08511e-06
60.5349774.53941.1e-05
70.4815624.08625.6e-05
80.4392273.7270.000191
90.4056733.44230.000482
100.3745483.17810.001092
110.3473212.94710.00216
120.3208062.72210.004065
130.2681722.27550.012926
140.2117431.79670.038289
150.1592381.35120.090435
160.1063460.90240.184933
170.0589790.50050.309141
180.0242350.20560.418826
190.0025230.02140.49149
20-0.011099-0.09420.462616
21-0.016856-0.1430.443332
22-0.023489-0.19930.421292
23-0.024066-0.20420.419385
24-0.023858-0.20240.42007
25-0.039758-0.33740.368414
26-0.056704-0.48120.315934
27-0.072272-0.61320.270823
28-0.09269-0.78650.217078
29-0.111319-0.94460.174018
30-0.126004-1.06920.144279
31-0.130069-1.10370.136705
32-0.124444-1.05590.147263
33-0.113374-0.9620.169631
34-0.094792-0.80430.211926
35-0.071615-0.60770.272658
36-0.04282-0.36330.358708
37-0.051428-0.43640.331932
38-0.060486-0.51320.304678
39-0.072341-0.61380.270631
40-0.090786-0.77030.221807
41-0.111455-0.94570.173726
42-0.130536-1.10760.135853
43-0.142025-1.20510.116052
44-0.152872-1.29720.099358
45-0.161266-1.36840.087723
46-0.168459-1.42940.078603
47-0.173614-1.47320.072532
48-0.180046-1.52770.065479


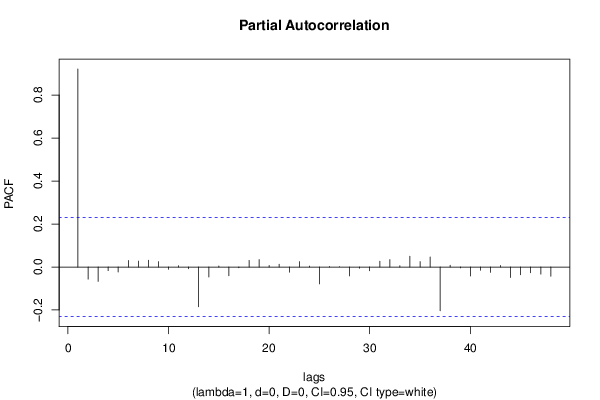
Partial Autocorrelation Function
Time lag kPACF(k)T-STATP-value
10.9212597.81710
2-0.05661-0.48040.316215
3-0.066961-0.56820.285838
4-0.016956-0.14390.443001
5-0.023429-0.19880.42149
60.0300390.25490.399767
70.0275030.23340.408068
80.0315890.2680.394716
90.0249080.21140.416605
10-0.010925-0.09270.4632
110.0061890.05250.479132
12-0.008061-0.06840.472829
13-0.185359-1.57280.060072
14-0.046596-0.39540.346865
150.0050350.04270.483021
16-0.040947-0.34740.364633
17-0.003908-0.03320.48682
180.0306920.26040.397638
190.0343890.29180.38564
200.0069260.05880.47665
210.0131460.11150.455746
22-0.023989-0.20360.419637
230.0248810.21110.416694
240.0042560.03610.485645
25-0.078586-0.66680.253508
260.0024370.02070.491778
270.0005150.00440.498262
28-0.041279-0.35030.363583
29-0.006208-0.05270.479069
30-0.017181-0.14580.442249
310.0265090.22490.411334
320.0343160.29120.385874
330.00560.04750.481115
340.0500220.42450.33625
350.0251760.21360.415722
360.0465850.39530.346901
37-0.203448-1.72630.04429
380.0084540.07170.471506
39-0.004088-0.03470.486214
40-0.042171-0.35780.360758
41-0.015035-0.12760.44942
42-0.024962-0.21180.416427
430.0070230.05960.476324
44-0.049089-0.41650.339129
45-0.03589-0.30450.380798
46-0.026654-0.22620.410856
47-0.033191-0.28160.389516
48-0.043324-0.36760.357119

\begin{tabular}{lllllllll}
\hline
Partial Autocorrelation Function \tabularnewline
Time lag k & PACF(k) & T-STAT & P-value \tabularnewline
1 & 0.921259 & 7.8171 & 0 \tabularnewline
2 & -0.05661 & -0.4804 & 0.316215 \tabularnewline
3 & -0.066961 & -0.5682 & 0.285838 \tabularnewline
4 & -0.016956 & -0.1439 & 0.443001 \tabularnewline
5 & -0.023429 & -0.1988 & 0.42149 \tabularnewline
6 & 0.030039 & 0.2549 & 0.399767 \tabularnewline
7 & 0.027503 & 0.2334 & 0.408068 \tabularnewline
8 & 0.031589 & 0.268 & 0.394716 \tabularnewline
9 & 0.024908 & 0.2114 & 0.416605 \tabularnewline
10 & -0.010925 & -0.0927 & 0.4632 \tabularnewline
11 & 0.006189 & 0.0525 & 0.479132 \tabularnewline
12 & -0.008061 & -0.0684 & 0.472829 \tabularnewline
13 & -0.185359 & -1.5728 & 0.060072 \tabularnewline
14 & -0.046596 & -0.3954 & 0.346865 \tabularnewline
15 & 0.005035 & 0.0427 & 0.483021 \tabularnewline
16 & -0.040947 & -0.3474 & 0.364633 \tabularnewline
17 & -0.003908 & -0.0332 & 0.48682 \tabularnewline
18 & 0.030692 & 0.2604 & 0.397638 \tabularnewline
19 & 0.034389 & 0.2918 & 0.38564 \tabularnewline
20 & 0.006926 & 0.0588 & 0.47665 \tabularnewline
21 & 0.013146 & 0.1115 & 0.455746 \tabularnewline
22 & -0.023989 & -0.2036 & 0.419637 \tabularnewline
23 & 0.024881 & 0.2111 & 0.416694 \tabularnewline
24 & 0.004256 & 0.0361 & 0.485645 \tabularnewline
25 & -0.078586 & -0.6668 & 0.253508 \tabularnewline
26 & 0.002437 & 0.0207 & 0.491778 \tabularnewline
27 & 0.000515 & 0.0044 & 0.498262 \tabularnewline
28 & -0.041279 & -0.3503 & 0.363583 \tabularnewline
29 & -0.006208 & -0.0527 & 0.479069 \tabularnewline
30 & -0.017181 & -0.1458 & 0.442249 \tabularnewline
31 & 0.026509 & 0.2249 & 0.411334 \tabularnewline
32 & 0.034316 & 0.2912 & 0.385874 \tabularnewline
33 & 0.0056 & 0.0475 & 0.481115 \tabularnewline
34 & 0.050022 & 0.4245 & 0.33625 \tabularnewline
35 & 0.025176 & 0.2136 & 0.415722 \tabularnewline
36 & 0.046585 & 0.3953 & 0.346901 \tabularnewline
37 & -0.203448 & -1.7263 & 0.04429 \tabularnewline
38 & 0.008454 & 0.0717 & 0.471506 \tabularnewline
39 & -0.004088 & -0.0347 & 0.486214 \tabularnewline
40 & -0.042171 & -0.3578 & 0.360758 \tabularnewline
41 & -0.015035 & -0.1276 & 0.44942 \tabularnewline
42 & -0.024962 & -0.2118 & 0.416427 \tabularnewline
43 & 0.007023 & 0.0596 & 0.476324 \tabularnewline
44 & -0.049089 & -0.4165 & 0.339129 \tabularnewline
45 & -0.03589 & -0.3045 & 0.380798 \tabularnewline
46 & -0.026654 & -0.2262 & 0.410856 \tabularnewline
47 & -0.033191 & -0.2816 & 0.389516 \tabularnewline
48 & -0.043324 & -0.3676 & 0.357119 \tabularnewline
\hline
\end{tabular}
%Source: https://freestatistics.org/blog/index.php?pk=&T=2

[TABLE]
[ROW][C]Partial Autocorrelation Function[/C][/ROW]
[ROW][C]Time lag k[/C][C]PACF(k)[/C][C]T-STAT[/C][C]P-value[/C][/ROW]
[ROW][C]1[/C][C]0.921259[/C][C]7.8171[/C][C]0[/C][/ROW]
[ROW][C]2[/C][C]-0.05661[/C][C]-0.4804[/C][C]0.316215[/C][/ROW]
[ROW][C]3[/C][C]-0.066961[/C][C]-0.5682[/C][C]0.285838[/C][/ROW]
[ROW][C]4[/C][C]-0.016956[/C][C]-0.1439[/C][C]0.443001[/C][/ROW]
[ROW][C]5[/C][C]-0.023429[/C][C]-0.1988[/C][C]0.42149[/C][/ROW]
[ROW][C]6[/C][C]0.030039[/C][C]0.2549[/C][C]0.399767[/C][/ROW]
[ROW][C]7[/C][C]0.027503[/C][C]0.2334[/C][C]0.408068[/C][/ROW]
[ROW][C]8[/C][C]0.031589[/C][C]0.268[/C][C]0.394716[/C][/ROW]
[ROW][C]9[/C][C]0.024908[/C][C]0.2114[/C][C]0.416605[/C][/ROW]
[ROW][C]10[/C][C]-0.010925[/C][C]-0.0927[/C][C]0.4632[/C][/ROW]
[ROW][C]11[/C][C]0.006189[/C][C]0.0525[/C][C]0.479132[/C][/ROW]
[ROW][C]12[/C][C]-0.008061[/C][C]-0.0684[/C][C]0.472829[/C][/ROW]
[ROW][C]13[/C][C]-0.185359[/C][C]-1.5728[/C][C]0.060072[/C][/ROW]
[ROW][C]14[/C][C]-0.046596[/C][C]-0.3954[/C][C]0.346865[/C][/ROW]
[ROW][C]15[/C][C]0.005035[/C][C]0.0427[/C][C]0.483021[/C][/ROW]
[ROW][C]16[/C][C]-0.040947[/C][C]-0.3474[/C][C]0.364633[/C][/ROW]
[ROW][C]17[/C][C]-0.003908[/C][C]-0.0332[/C][C]0.48682[/C][/ROW]
[ROW][C]18[/C][C]0.030692[/C][C]0.2604[/C][C]0.397638[/C][/ROW]
[ROW][C]19[/C][C]0.034389[/C][C]0.2918[/C][C]0.38564[/C][/ROW]
[ROW][C]20[/C][C]0.006926[/C][C]0.0588[/C][C]0.47665[/C][/ROW]
[ROW][C]21[/C][C]0.013146[/C][C]0.1115[/C][C]0.455746[/C][/ROW]
[ROW][C]22[/C][C]-0.023989[/C][C]-0.2036[/C][C]0.419637[/C][/ROW]
[ROW][C]23[/C][C]0.024881[/C][C]0.2111[/C][C]0.416694[/C][/ROW]
[ROW][C]24[/C][C]0.004256[/C][C]0.0361[/C][C]0.485645[/C][/ROW]
[ROW][C]25[/C][C]-0.078586[/C][C]-0.6668[/C][C]0.253508[/C][/ROW]
[ROW][C]26[/C][C]0.002437[/C][C]0.0207[/C][C]0.491778[/C][/ROW]
[ROW][C]27[/C][C]0.000515[/C][C]0.0044[/C][C]0.498262[/C][/ROW]
[ROW][C]28[/C][C]-0.041279[/C][C]-0.3503[/C][C]0.363583[/C][/ROW]
[ROW][C]29[/C][C]-0.006208[/C][C]-0.0527[/C][C]0.479069[/C][/ROW]
[ROW][C]30[/C][C]-0.017181[/C][C]-0.1458[/C][C]0.442249[/C][/ROW]
[ROW][C]31[/C][C]0.026509[/C][C]0.2249[/C][C]0.411334[/C][/ROW]
[ROW][C]32[/C][C]0.034316[/C][C]0.2912[/C][C]0.385874[/C][/ROW]
[ROW][C]33[/C][C]0.0056[/C][C]0.0475[/C][C]0.481115[/C][/ROW]
[ROW][C]34[/C][C]0.050022[/C][C]0.4245[/C][C]0.33625[/C][/ROW]
[ROW][C]35[/C][C]0.025176[/C][C]0.2136[/C][C]0.415722[/C][/ROW]
[ROW][C]36[/C][C]0.046585[/C][C]0.3953[/C][C]0.346901[/C][/ROW]
[ROW][C]37[/C][C]-0.203448[/C][C]-1.7263[/C][C]0.04429[/C][/ROW]
[ROW][C]38[/C][C]0.008454[/C][C]0.0717[/C][C]0.471506[/C][/ROW]
[ROW][C]39[/C][C]-0.004088[/C][C]-0.0347[/C][C]0.486214[/C][/ROW]
[ROW][C]40[/C][C]-0.042171[/C][C]-0.3578[/C][C]0.360758[/C][/ROW]
[ROW][C]41[/C][C]-0.015035[/C][C]-0.1276[/C][C]0.44942[/C][/ROW]
[ROW][C]42[/C][C]-0.024962[/C][C]-0.2118[/C][C]0.416427[/C][/ROW]
[ROW][C]43[/C][C]0.007023[/C][C]0.0596[/C][C]0.476324[/C][/ROW]
[ROW][C]44[/C][C]-0.049089[/C][C]-0.4165[/C][C]0.339129[/C][/ROW]
[ROW][C]45[/C][C]-0.03589[/C][C]-0.3045[/C][C]0.380798[/C][/ROW]
[ROW][C]46[/C][C]-0.026654[/C][C]-0.2262[/C][C]0.410856[/C][/ROW]
[ROW][C]47[/C][C]-0.033191[/C][C]-0.2816[/C][C]0.389516[/C][/ROW]
[ROW][C]48[/C][C]-0.043324[/C][C]-0.3676[/C][C]0.357119[/C][/ROW]
[/TABLE]
Source: https://freestatistics.org/blog/index.php?pk=&T=2

Globally Unique Identifier (entire table): ba.freestatistics.org/blog/index.php?pk=&T=2

As an alternative you can also use a QR Code:  

The GUIDs for individual cells are displayed in the table below:

Partial Autocorrelation Function
Time lag kPACF(k)T-STATP-value
10.9212597.81710
2-0.05661-0.48040.316215
3-0.066961-0.56820.285838
4-0.016956-0.14390.443001
5-0.023429-0.19880.42149
60.0300390.25490.399767
70.0275030.23340.408068
80.0315890.2680.394716
90.0249080.21140.416605
10-0.010925-0.09270.4632
110.0061890.05250.479132
12-0.008061-0.06840.472829
13-0.185359-1.57280.060072
14-0.046596-0.39540.346865
150.0050350.04270.483021
16-0.040947-0.34740.364633
17-0.003908-0.03320.48682
180.0306920.26040.397638
190.0343890.29180.38564
200.0069260.05880.47665
210.0131460.11150.455746
22-0.023989-0.20360.419637
230.0248810.21110.416694
240.0042560.03610.485645
25-0.078586-0.66680.253508
260.0024370.02070.491778
270.0005150.00440.498262
28-0.041279-0.35030.363583
29-0.006208-0.05270.479069
30-0.017181-0.14580.442249
310.0265090.22490.411334
320.0343160.29120.385874
330.00560.04750.481115
340.0500220.42450.33625
350.0251760.21360.415722
360.0465850.39530.346901
37-0.203448-1.72630.04429
380.0084540.07170.471506
39-0.004088-0.03470.486214
40-0.042171-0.35780.360758
41-0.015035-0.12760.44942
42-0.024962-0.21180.416427
430.0070230.05960.476324
44-0.049089-0.41650.339129
45-0.03589-0.30450.380798
46-0.026654-0.22620.410856
47-0.033191-0.28160.389516
48-0.043324-0.36760.357119


Parameters (Session):
par1 = 48 ; par2 = 1 ; par3 = 0 ; par4 = 0 ; par5 = 12 ; par6 = White Noise ; par7 = 0.95 ;
Parameters (R input):
par1 = 48 ; par2 = 1 ; par3 = 0 ; par4 = 0 ; par5 = 12 ; par6 = White Noise ; par7 = 0.95 ; par8 = ;
R code (references can be found in the software module):
par8 <- ''
par7 <- '0.95'
par6 <- 'White Noise'
par5 <- '12'
par4 <- '0'
par3 <- '1'
par2 <- '1'
par1 <- '48'
if (par1 == 'Default') {
par1 = 10*log10(length(x))
} else {
par1 <- as.numeric(par1)
}
par2 <- as.numeric(par2)
par3 <- as.numeric(par3)
par4 <- as.numeric(par4)
par5 <- as.numeric(par5)
if (par6 == 'White Noise') par6 <- 'white' else par6 <- 'ma'
par7 <- as.numeric(par7)
if (par8 != '') par8 <- as.numeric(par8)
x <- na.omit(x)
ox <- x
if (par8 == '') {
if (par2 == 0) {
x <- log(x)
} else {
x <- (x ^ par2 - 1) / par2
}
} else {
x <- log(x,base=par8)
}
if (par3 > 0) x <- diff(x,lag=1,difference=par3)
if (par4 > 0) x <- diff(x,lag=par5,difference=par4)
bitmap(file='picts.png')
op <- par(mfrow=c(2,1))
plot(ox,type='l',main='Original Time Series',xlab='time',ylab='value')
if (par8=='') {
mytitle <- paste('Working Time Series (lambda=',par2,', d=',par3,', D=',par4,')',sep='')
mysub <- paste('(lambda=',par2,', d=',par3,', D=',par4,', CI=', par7, ', CI type=',par6,')',sep='')
} else {
mytitle <- paste('Working Time Series (base=',par8,', d=',par3,', D=',par4,')',sep='')
mysub <- paste('(base=',par8,', d=',par3,', D=',par4,', CI=', par7, ', CI type=',par6,')',sep='')
}
plot(x,type='l', main=mytitle,xlab='time',ylab='value')
par(op)
dev.off()
bitmap(file='pic1.png')
racf <- acf(x, par1, main='Autocorrelation', xlab='time lag', ylab='ACF', ci.type=par6, ci=par7, sub=mysub)
dev.off()
bitmap(file='pic2.png')
rpacf <- pacf(x,par1,main='Partial Autocorrelation',xlab='lags',ylab='PACF',sub=mysub)
dev.off()
(myacf <- c(racf$acf))
(mypacf <- c(rpacf$acf))
lengthx <- length(x)
sqrtn <- sqrt(lengthx)
load(file='createtable')
a<-table.start()
a<-table.row.start(a)
a<-table.element(a,'Autocorrelation Function',4,TRUE)
a<-table.row.end(a)
a<-table.row.start(a)
a<-table.element(a,'Time lag k',header=TRUE)
a<-table.element(a,hyperlink('basics.htm','ACF(k)','click here for more information about the Autocorrelation Function'),header=TRUE)
a<-table.element(a,'T-STAT',header=TRUE)
a<-table.element(a,'P-value',header=TRUE)
a<-table.row.end(a)
for (i in 2:(par1+1)) {
a<-table.row.start(a)
a<-table.element(a,i-1,header=TRUE)
a<-table.element(a,round(myacf[i],6))
mytstat <- myacf[i]*sqrtn
a<-table.element(a,round(mytstat,4))
a<-table.element(a,round(1-pt(abs(mytstat),lengthx),6))
a<-table.row.end(a)
}
a<-table.end(a)
table.save(a,file='mytable.tab')
a<-table.start()
a<-table.row.start(a)
a<-table.element(a,'Partial Autocorrelation Function',4,TRUE)
a<-table.row.end(a)
a<-table.row.start(a)
a<-table.element(a,'Time lag k',header=TRUE)
a<-table.element(a,hyperlink('basics.htm','PACF(k)','click here for more information about the Partial Autocorrelation Function'),header=TRUE)
a<-table.element(a,'T-STAT',header=TRUE)
a<-table.element(a,'P-value',header=TRUE)
a<-table.row.end(a)
for (i in 1:par1) {
a<-table.row.start(a)
a<-table.element(a,i,header=TRUE)
a<-table.element(a,round(mypacf[i],6))
mytstat <- mypacf[i]*sqrtn
a<-table.element(a,round(mytstat,4))
a<-table.element(a,round(1-pt(abs(mytstat),lengthx),6))
a<-table.row.end(a)
}
a<-table.end(a)
table.save(a,file='mytable1.tab')