Free Statistics

of Irreproducible Research!

Author's title

Author*The author of this computation has been verified*
R Software Modulerwasp_smp.wasp
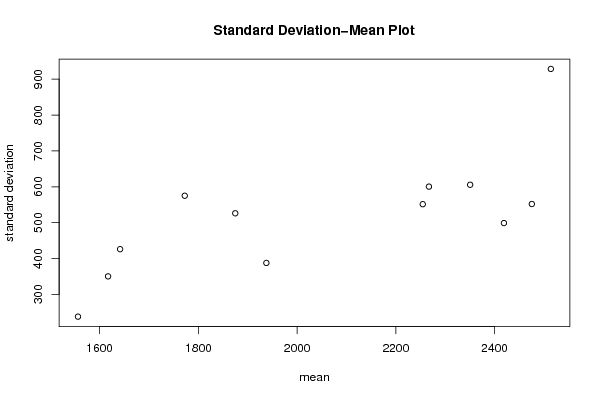
Title produced by softwareStandard Deviation-Mean Plot
Date of computationMon, 23 Jan 2017 09:12:41 +0100
Cite this page as followsStatistical Computations at FreeStatistics.org, Office for Research Development and Education, URL https://freestatistics.org/blog/index.php?v=date/2017/Jan/23/t1485159207bvejmyw8dowh584.htm/, Retrieved Wed, 15 May 2024 08:57:44 +0000
Statistical Computations at FreeStatistics.org, Office for Research Development and Education, URL https://freestatistics.org/blog/index.php?pk=303643, Retrieved Wed, 15 May 2024 08:57:44 +0000
QR Codes:

Original text written by user:
IsPrivate?No (this computation is public)
User-defined keywords
Estimated Impact43
Family? (F = Feedback message, R = changed R code, M = changed R Module, P = changed Parameters, D = changed Data)
-       [Standard Deviation-Mean Plot] [examen tijdreeks ...] [2017-01-23 08:12:41] [d92250bd36540c2281a4ec15b45df1dd] [Current]
Feedback Forum

Post a new message
Dataseries X:
3035
2552
2704
2554
2014
1655
1721
1524
1596
2074
2199
2512
2933
2889
2938
2497
1870
1726
1607
1545
1396
1787
2076
2837
2787
3891
3179
2011
1636
1580
1489
1300
1356
1653
2013
2823
3102
2294
2385
2444
1748
1554
1498
1361
1346
1564
1640
2293
2815
3137
2679
1969
1870
1633
1529
1366
1357
1570
1535
2491
3084
2605
2573
2143
1693
1504
1461
1354
1333
1492
1781
1915


Summary of computational transaction
Raw Input view raw input (R code)
Raw Outputview raw output of R engine
Computing time1 seconds
R ServerBig Analytics Cloud Computing Center

\begin{tabular}{lllllllll}
\hline
Summary of computational transaction \tabularnewline
Raw Input view raw input (R code)  \tabularnewline
Raw Outputview raw output of R engine  \tabularnewline
Computing time1 seconds \tabularnewline
R ServerBig Analytics Cloud Computing Center \tabularnewline
\hline
\end{tabular}
%Source: https://freestatistics.org/blog/index.php?pk=303643&T=0

[TABLE]
[ROW]
Summary of computational transaction[/C][/ROW] [ROW]Raw Input[/C] view raw input (R code) [/C][/ROW] [ROW]Raw Output[/C]view raw output of R engine [/C][/ROW] [ROW]Computing time[/C]1 seconds[/C][/ROW] [ROW]R Server[/C]Big Analytics Cloud Computing Center[/C][/ROW] [/TABLE] Source: https://freestatistics.org/blog/index.php?pk=303643&T=0

Globally Unique Identifier (entire table): ba.freestatistics.org/blog/index.php?pk=303643&T=0

As an alternative you can also use a QR Code:  

The GUIDs for individual cells are displayed in the table below:

Summary of computational transaction
Raw Input view raw input (R code)
Raw Outputview raw output of R engine
Computing time1 seconds
R ServerBig Analytics Cloud Computing Center


Standard Deviation-Mean Plot
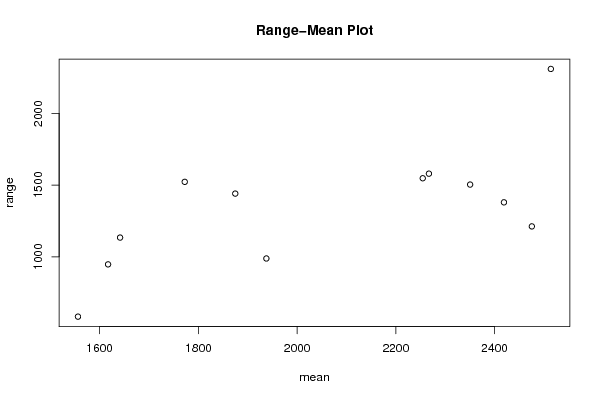
SectionMeanStandard DeviationRange
12419498.8619047391771380
21937.66666666667387.696100917544988
32475.5551.9125836579561212
41874.66666666667526.0709711309561441
52514928.3460561665572311
61772.33333333333574.9384894635831523
72254.5551.361859399071548
81617350.271894390629947
92350.5605.5548695205081504
101641.33333333333426.0519530135581134
112267600.3982011965061580
121556237.974788580639582

\begin{tabular}{lllllllll}
\hline
Standard Deviation-Mean Plot \tabularnewline
Section & Mean & Standard Deviation & Range \tabularnewline
1 & 2419 & 498.861904739177 & 1380 \tabularnewline
2 & 1937.66666666667 & 387.696100917544 & 988 \tabularnewline
3 & 2475.5 & 551.912583657956 & 1212 \tabularnewline
4 & 1874.66666666667 & 526.070971130956 & 1441 \tabularnewline
5 & 2514 & 928.346056166557 & 2311 \tabularnewline
6 & 1772.33333333333 & 574.938489463583 & 1523 \tabularnewline
7 & 2254.5 & 551.36185939907 & 1548 \tabularnewline
8 & 1617 & 350.271894390629 & 947 \tabularnewline
9 & 2350.5 & 605.554869520508 & 1504 \tabularnewline
10 & 1641.33333333333 & 426.051953013558 & 1134 \tabularnewline
11 & 2267 & 600.398201196506 & 1580 \tabularnewline
12 & 1556 & 237.974788580639 & 582 \tabularnewline
\hline
\end{tabular}
%Source: https://freestatistics.org/blog/index.php?pk=303643&T=1

[TABLE]
[ROW][C]Standard Deviation-Mean Plot[/C][/ROW]
[ROW][C]Section[/C][C]Mean[/C][C]Standard Deviation[/C][C]Range[/C][/ROW]
[ROW][C]1[/C][C]2419[/C][C]498.861904739177[/C][C]1380[/C][/ROW]
[ROW][C]2[/C][C]1937.66666666667[/C][C]387.696100917544[/C][C]988[/C][/ROW]
[ROW][C]3[/C][C]2475.5[/C][C]551.912583657956[/C][C]1212[/C][/ROW]
[ROW][C]4[/C][C]1874.66666666667[/C][C]526.070971130956[/C][C]1441[/C][/ROW]
[ROW][C]5[/C][C]2514[/C][C]928.346056166557[/C][C]2311[/C][/ROW]
[ROW][C]6[/C][C]1772.33333333333[/C][C]574.938489463583[/C][C]1523[/C][/ROW]
[ROW][C]7[/C][C]2254.5[/C][C]551.36185939907[/C][C]1548[/C][/ROW]
[ROW][C]8[/C][C]1617[/C][C]350.271894390629[/C][C]947[/C][/ROW]
[ROW][C]9[/C][C]2350.5[/C][C]605.554869520508[/C][C]1504[/C][/ROW]
[ROW][C]10[/C][C]1641.33333333333[/C][C]426.051953013558[/C][C]1134[/C][/ROW]
[ROW][C]11[/C][C]2267[/C][C]600.398201196506[/C][C]1580[/C][/ROW]
[ROW][C]12[/C][C]1556[/C][C]237.974788580639[/C][C]582[/C][/ROW]
[/TABLE]
Source: https://freestatistics.org/blog/index.php?pk=303643&T=1

Globally Unique Identifier (entire table): ba.freestatistics.org/blog/index.php?pk=303643&T=1

As an alternative you can also use a QR Code:  

The GUIDs for individual cells are displayed in the table below:

Standard Deviation-Mean Plot
SectionMeanStandard DeviationRange
12419498.8619047391771380
21937.66666666667387.696100917544988
32475.5551.9125836579561212
41874.66666666667526.0709711309561441
52514928.3460561665572311
61772.33333333333574.9384894635831523
72254.5551.361859399071548
81617350.271894390629947
92350.5605.5548695205081504
101641.33333333333426.0519530135581134
112267600.3982011965061580
121556237.974788580639582


Regression: S.E.(k) = alpha + beta * Mean(k)
alpha-191.251084493351
beta0.345811409716441
S.D.0.1023028450475
T-STAT3.38027167823023
p-value0.00699940934061903

\begin{tabular}{lllllllll}
\hline
Regression: S.E.(k) = alpha + beta * Mean(k) \tabularnewline
alpha & -191.251084493351 \tabularnewline
beta & 0.345811409716441 \tabularnewline
S.D. & 0.1023028450475 \tabularnewline
T-STAT & 3.38027167823023 \tabularnewline
p-value & 0.00699940934061903 \tabularnewline
\hline
\end{tabular}
%Source: https://freestatistics.org/blog/index.php?pk=303643&T=2

[TABLE]
[ROW][C]Regression: S.E.(k) = alpha + beta * Mean(k)[/C][/ROW]
[ROW][C]alpha[/C][C]-191.251084493351[/C][/ROW]
[ROW][C]beta[/C][C]0.345811409716441[/C][/ROW]
[ROW][C]S.D.[/C][C]0.1023028450475[/C][/ROW]
[ROW][C]T-STAT[/C][C]3.38027167823023[/C][/ROW]
[ROW][C]p-value[/C][C]0.00699940934061903[/C][/ROW]
[/TABLE]
Source: https://freestatistics.org/blog/index.php?pk=303643&T=2

Globally Unique Identifier (entire table): ba.freestatistics.org/blog/index.php?pk=303643&T=2

As an alternative you can also use a QR Code:  

The GUIDs for individual cells are displayed in the table below:

Regression: S.E.(k) = alpha + beta * Mean(k)
alpha-191.251084493351
beta0.345811409716441
S.D.0.1023028450475
T-STAT3.38027167823023
p-value0.00699940934061903


Regression: ln S.E.(k) = alpha + beta * ln Mean(k)
alpha-4.75780620268908
beta1.43956017279021
S.D.0.384705260571959
T-STAT3.7419820322965
p-value0.00383402514350031
Lambda-0.439560172790213

\begin{tabular}{lllllllll}
\hline
Regression: ln S.E.(k) = alpha + beta * ln Mean(k) \tabularnewline
alpha & -4.75780620268908 \tabularnewline
beta & 1.43956017279021 \tabularnewline
S.D. & 0.384705260571959 \tabularnewline
T-STAT & 3.7419820322965 \tabularnewline
p-value & 0.00383402514350031 \tabularnewline
Lambda & -0.439560172790213 \tabularnewline
\hline
\end{tabular}
%Source: https://freestatistics.org/blog/index.php?pk=303643&T=3

[TABLE]
[ROW][C]Regression: ln S.E.(k) = alpha + beta * ln Mean(k)[/C][/ROW]
[ROW][C]alpha[/C][C]-4.75780620268908[/C][/ROW]
[ROW][C]beta[/C][C]1.43956017279021[/C][/ROW]
[ROW][C]S.D.[/C][C]0.384705260571959[/C][/ROW]
[ROW][C]T-STAT[/C][C]3.7419820322965[/C][/ROW]
[ROW][C]p-value[/C][C]0.00383402514350031[/C][/ROW]
[ROW][C]Lambda[/C][C]-0.439560172790213[/C][/ROW]
[/TABLE]
Source: https://freestatistics.org/blog/index.php?pk=303643&T=3

Globally Unique Identifier (entire table): ba.freestatistics.org/blog/index.php?pk=303643&T=3

As an alternative you can also use a QR Code:  

The GUIDs for individual cells are displayed in the table below:

Regression: ln S.E.(k) = alpha + beta * ln Mean(k)
alpha-4.75780620268908
beta1.43956017279021
S.D.0.384705260571959
T-STAT3.7419820322965
p-value0.00383402514350031
Lambda-0.439560172790213


Parameters (Session):
par1 = 6 ;
Parameters (R input):
par1 = 6 ;
R code (references can be found in the software module):
par1 <- '12'
par1 <- as.numeric(par1)
(n <- length(x))
(np <- floor(n / par1))
arr <- array(NA,dim=c(par1,np))
j <- 0
k <- 1
for (i in 1:(np*par1))
{
j = j + 1
arr[j,k] <- x[i]
if (j == par1) {
j = 0
k=k+1
}
}
arr
arr.mean <- array(NA,dim=np)
arr.sd <- array(NA,dim=np)
arr.range <- array(NA,dim=np)
for (j in 1:np)
{
arr.mean[j] <- mean(arr[,j],na.rm=TRUE)
arr.sd[j] <- sd(arr[,j],na.rm=TRUE)
arr.range[j] <- max(arr[,j],na.rm=TRUE) - min(arr[,j],na.rm=TRUE)
}
arr.mean
arr.sd
arr.range
(lm1 <- lm(arr.sd~arr.mean))
(lnlm1 <- lm(log(arr.sd)~log(arr.mean)))
(lm2 <- lm(arr.range~arr.mean))
bitmap(file='test1.png')
plot(arr.mean,arr.sd,main='Standard Deviation-Mean Plot',xlab='mean',ylab='standard deviation')
dev.off()
bitmap(file='test2.png')
plot(arr.mean,arr.range,main='Range-Mean Plot',xlab='mean',ylab='range')
dev.off()
load(file='createtable')
a<-table.start()
a<-table.row.start(a)
a<-table.element(a,'Standard Deviation-Mean Plot',4,TRUE)
a<-table.row.end(a)
a<-table.row.start(a)
a<-table.element(a,'Section',header=TRUE)
a<-table.element(a,'Mean',header=TRUE)
a<-table.element(a,'Standard Deviation',header=TRUE)
a<-table.element(a,'Range',header=TRUE)
a<-table.row.end(a)
for (j in 1:np) {
a<-table.row.start(a)
a<-table.element(a,j,header=TRUE)
a<-table.element(a,arr.mean[j])
a<-table.element(a,arr.sd[j] )
a<-table.element(a,arr.range[j] )
a<-table.row.end(a)
}
a<-table.end(a)
table.save(a,file='mytable.tab')
a<-table.start()
a<-table.row.start(a)
a<-table.element(a,'Regression: S.E.(k) = alpha + beta * Mean(k)',2,TRUE)
a<-table.row.end(a)
a<-table.row.start(a)
a<-table.element(a,'alpha',header=TRUE)
a<-table.element(a,lm1$coefficients[[1]])
a<-table.row.end(a)
a<-table.row.start(a)
a<-table.element(a,'beta',header=TRUE)
a<-table.element(a,lm1$coefficients[[2]])
a<-table.row.end(a)
a<-table.row.start(a)
a<-table.element(a,'S.D.',header=TRUE)
a<-table.element(a,summary(lm1)$coefficients[2,2])
a<-table.row.end(a)
a<-table.row.start(a)
a<-table.element(a,'T-STAT',header=TRUE)
a<-table.element(a,summary(lm1)$coefficients[2,3])
a<-table.row.end(a)
a<-table.row.start(a)
a<-table.element(a,'p-value',header=TRUE)
a<-table.element(a,summary(lm1)$coefficients[2,4])
a<-table.row.end(a)
a<-table.end(a)
table.save(a,file='mytable1.tab')
a<-table.start()
a<-table.row.start(a)
a<-table.element(a,'Regression: ln S.E.(k) = alpha + beta * ln Mean(k)',2,TRUE)
a<-table.row.end(a)
a<-table.row.start(a)
a<-table.element(a,'alpha',header=TRUE)
a<-table.element(a,lnlm1$coefficients[[1]])
a<-table.row.end(a)
a<-table.row.start(a)
a<-table.element(a,'beta',header=TRUE)
a<-table.element(a,lnlm1$coefficients[[2]])
a<-table.row.end(a)
a<-table.row.start(a)
a<-table.element(a,'S.D.',header=TRUE)
a<-table.element(a,summary(lnlm1)$coefficients[2,2])
a<-table.row.end(a)
a<-table.row.start(a)
a<-table.element(a,'T-STAT',header=TRUE)
a<-table.element(a,summary(lnlm1)$coefficients[2,3])
a<-table.row.end(a)
a<-table.row.start(a)
a<-table.element(a,'p-value',header=TRUE)
a<-table.element(a,summary(lnlm1)$coefficients[2,4])
a<-table.row.end(a)
a<-table.row.start(a)
a<-table.element(a,'Lambda',header=TRUE)
a<-table.element(a,1-lnlm1$coefficients[[2]])
a<-table.row.end(a)
a<-table.end(a)
table.save(a,file='mytable2.tab')