Free Statistics
of Irreproducible Research!
Description of Statistical Computation | ||||||||||||||||||||||||||||||
|---|---|---|---|---|---|---|---|---|---|---|---|---|---|---|---|---|---|---|---|---|---|---|---|---|---|---|---|---|---|---|
| Author's title | ||||||||||||||||||||||||||||||
| Author | *The author of this computation has been verified* | |||||||||||||||||||||||||||||
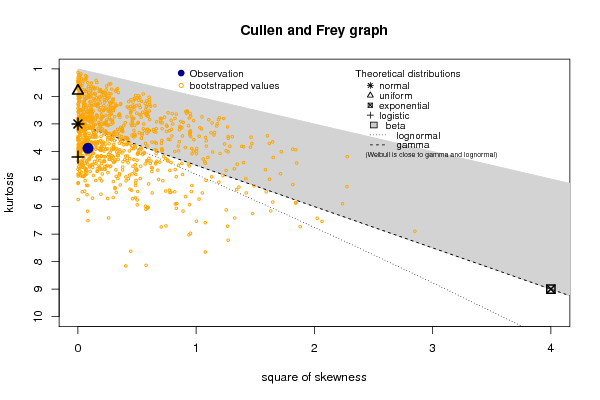
| R Software Module | rwasp_skewness_kurtosis_plot.wasp | |||||||||||||||||||||||||||||
| Title produced by software | Skewness-Kurtosis Plot | |||||||||||||||||||||||||||||
| Date of computation | Mon, 23 Jan 2017 10:55:42 +0100 | |||||||||||||||||||||||||||||
| Cite this page as follows | Statistical Computations at FreeStatistics.org, Office for Research Development and Education, URL https://freestatistics.org/blog/index.php?v=date/2017/Jan/23/t1485165405jea8qoteyxr1f2w.htm/, Retrieved Wed, 15 May 2024 05:48:45 +0200 | |||||||||||||||||||||||||||||
| Statistical Computations at FreeStatistics.org, Office for Research Development and Education, URL https://freestatistics.org/blog/index.php?pk=, Retrieved Wed, 15 May 2024 05:48:45 +0200 | ||||||||||||||||||||||||||||||
| QR Codes: | ||||||||||||||||||||||||||||||
|
| ||||||||||||||||||||||||||||||
| Original text written by user: | ||||||||||||||||||||||||||||||
| IsPrivate? | No (this computation is public) | |||||||||||||||||||||||||||||
| User-defined keywords | ||||||||||||||||||||||||||||||
| Estimated Impact | 0 | |||||||||||||||||||||||||||||
Tree of Dependent Computations | ||||||||||||||||||||||||||||||
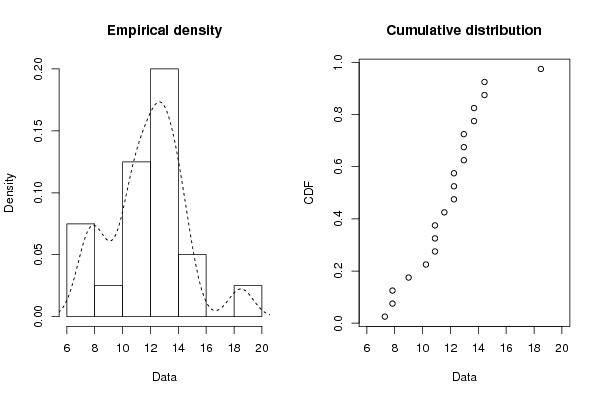
Dataset | ||||||||||||||||||||||||||||||
| Dataseries X: | ||||||||||||||||||||||||||||||
10.24 10.89 9 12.25 13.69 7.29 12.96 12.25 14.44 11.56 13.69 12.25 7.84 14.44 18.49 10.89 12.96 12.96 10.89 7.84 | ||||||||||||||||||||||||||||||
Tables (Output of Computation) | ||||||||||||||||||||||||||||||
| ||||||||||||||||||||||||||||||
Figures (Output of Computation) | ||||||||||||||||||||||||||||||
Input Parameters & R Code | ||||||||||||||||||||||||||||||
| Parameters (Session): | ||||||||||||||||||||||||||||||
| par1 = 12200121212Default500500121212Default121212DefaultDefault1111111DefaultDefaultDefault1Default1112121212 ; par2 = 51121210.40.40.40.40.40.422222221110110TripleDoubleTripleTriple ; par3 = 0000000100051111Pearson Chi-SquaredExact Pearson Chi-Squared by Simulation0110110additiveadditiveadditiveadditive ; par4 = P1 P5 Q1 Q3 P95 P990000000000two.sidedtwo.sidedtwo.sidedtwo.sidedgreater0011012121212121212 ; par5 = 121121212121212121pairedpairedpairedunpairedunpaired12121212 ; par6 = White NoiseWhite NoiseWhite NoiseWhite NoiseWhite NoiseWhite NoiseWhite NoiseWhite NoiseWhite NoiseWhite Noise000White NoiseWhite NoiseWhite NoiseWhite Noise ; par7 = 0.950.950.950.950.950.95 ; | ||||||||||||||||||||||||||||||
| Parameters (R input): | ||||||||||||||||||||||||||||||
| R code (references can be found in the software module): | ||||||||||||||||||||||||||||||
library(fitdistrplus) | ||||||||||||||||||||||||||||||