Free Statistics

of Irreproducible Research!

Author's title

Author*The author of this computation has been verified*
R Software Modulerwasp_logisticregression.wasp
Title produced by softwareBias-Reduced Logistic Regression
Date of computationMon, 23 Jan 2017 11:00:11 +0100
Cite this page as followsStatistical Computations at FreeStatistics.org, Office for Research Development and Education, URL https://freestatistics.org/blog/index.php?v=date/2017/Jan/23/t1485165617yg31350012axh0g.htm/, Retrieved Wed, 15 May 2024 04:35:51 +0200
Statistical Computations at FreeStatistics.org, Office for Research Development and Education, URL https://freestatistics.org/blog/index.php?pk=, Retrieved Wed, 15 May 2024 04:35:51 +0200
QR Codes:

Original text written by user:
IsPrivate?No (this computation is public)
User-defined keywords
Estimated Impact0
Dataseries X:
1 1 0 0 0 3.2 3.2 6
0 0 1 0 1 3.3 0 7
1 0 1 1 1 3 3 2
0 0 1 0 1 3.5 0 11
1 0 1 0 0 3.7 3.7 13
0 1 0 0 0 2.7 0 3
1 0 1 1 1 3.6 3.6 17
0 0 1 0 1 3.5 0 10
1 1 0 0 0 3.8 3.8 4
0 0 1 0 0 3.4 0 12
1 0 0 0 1 3.7 3.7 7
0 0 1 0 0 3.5 0 11
1 0 0 1 0 2.8 2.8 3
0 1 0 1 0 3.8 0 5
1 0 1 0 0 4.3 4.3 1
0 0 0 0 1 3.3 0 12
1 0 0 0 0 3.6 3.6 18
0 1 0 1 0 3.6 0 8
1 1 1 0 0 3.3 3.3 6
0 0 0 0 0 2.8 0 1


Summary of computational transaction
Raw Input view raw input (R code)
Raw Outputview raw output of R engine
Computing time2 seconds
R ServerBig Analytics Cloud Computing Center

\begin{tabular}{lllllllll}
\hline
Summary of computational transaction \tabularnewline
Raw Input view raw input (R code)  \tabularnewline
Raw Outputview raw output of R engine  \tabularnewline
Computing time2 seconds \tabularnewline
R ServerBig Analytics Cloud Computing Center \tabularnewline
\hline
\end{tabular}
%Source: https://freestatistics.org/blog/index.php?pk=&T=0

[TABLE]
[ROW]
Summary of computational transaction[/C][/ROW] [ROW]Raw Input[/C] view raw input (R code) [/C][/ROW] [ROW]Raw Output[/C]view raw output of R engine [/C][/ROW] [ROW]Computing time[/C]2 seconds[/C][/ROW] [ROW]R Server[/C]Big Analytics Cloud Computing Center[/C][/ROW] [/TABLE] Source: https://freestatistics.org/blog/index.php?pk=&T=0

Globally Unique Identifier (entire table): ba.freestatistics.org/blog/index.php?pk=&T=0

As an alternative you can also use a QR Code:  

The GUIDs for individual cells are displayed in the table below:

Summary of computational transaction
Raw Input view raw input (R code)
Raw Outputview raw output of R engine
Computing time2 seconds
R ServerBig Analytics Cloud Computing Center


Coefficients of Bias-Reduced Logistic Regression
VariableParameterS.E.t-stat2-sided p-value
(Intercept)0.1868292532291235.80005942987780.03221161015466690.97483286799103
X10.3996543543146941.724376520426970.231767453094140.820623777504946
X2-0.1578142463828771.48806227904544-0.1060535224937710.917292145557882
X30.3175499195383181.474465714978950.2153660924851350.833098878956703
X4-0.06410288074535861.6476479715749-0.03890568971725570.969605353930085
X5-0.7390085259249721.81750346642743-0.4066063914461750.691455315550264
Inter1.084902094832580.4053612910258792.676383065800220.0201713604198288
Score0.0173128585775680.1417987499313440.1220945783086980.904844961577067

\begin{tabular}{lllllllll}
\hline
Coefficients of Bias-Reduced Logistic Regression \tabularnewline
Variable & Parameter & S.E. & t-stat & 2-sided p-value \tabularnewline
(Intercept) & 0.186829253229123 & 5.8000594298778 & 0.0322116101546669 & 0.97483286799103 \tabularnewline
X1 & 0.399654354314694 & 1.72437652042697 & 0.23176745309414 & 0.820623777504946 \tabularnewline
X2 & -0.157814246382877 & 1.48806227904544 & -0.106053522493771 & 0.917292145557882 \tabularnewline
X3 & 0.317549919538318 & 1.47446571497895 & 0.215366092485135 & 0.833098878956703 \tabularnewline
X4 & -0.0641028807453586 & 1.6476479715749 & -0.0389056897172557 & 0.969605353930085 \tabularnewline
X5 & -0.739008525924972 & 1.81750346642743 & -0.406606391446175 & 0.691455315550264 \tabularnewline
Inter & 1.08490209483258 & 0.405361291025879 & 2.67638306580022 & 0.0201713604198288 \tabularnewline
Score & 0.017312858577568 & 0.141798749931344 & 0.122094578308698 & 0.904844961577067 \tabularnewline
\hline
\end{tabular}
%Source: https://freestatistics.org/blog/index.php?pk=&T=1

[TABLE]
[ROW][C]Coefficients of Bias-Reduced Logistic Regression[/C][/ROW]
[ROW][C]Variable[/C][C]Parameter[/C][C]S.E.[/C][C]t-stat[/C][C]2-sided p-value[/C][/ROW]
[ROW][C](Intercept)[/C][C]0.186829253229123[/C][C]5.8000594298778[/C][C]0.0322116101546669[/C][C]0.97483286799103[/C][/ROW]
[ROW][C]X1[/C][C]0.399654354314694[/C][C]1.72437652042697[/C][C]0.23176745309414[/C][C]0.820623777504946[/C][/ROW]
[ROW][C]X2[/C][C]-0.157814246382877[/C][C]1.48806227904544[/C][C]-0.106053522493771[/C][C]0.917292145557882[/C][/ROW]
[ROW][C]X3[/C][C]0.317549919538318[/C][C]1.47446571497895[/C][C]0.215366092485135[/C][C]0.833098878956703[/C][/ROW]
[ROW][C]X4[/C][C]-0.0641028807453586[/C][C]1.6476479715749[/C][C]-0.0389056897172557[/C][C]0.969605353930085[/C][/ROW]
[ROW][C]X5[/C][C]-0.739008525924972[/C][C]1.81750346642743[/C][C]-0.406606391446175[/C][C]0.691455315550264[/C][/ROW]
[ROW][C]Inter[/C][C]1.08490209483258[/C][C]0.405361291025879[/C][C]2.67638306580022[/C][C]0.0201713604198288[/C][/ROW]
[ROW][C]Score[/C][C]0.017312858577568[/C][C]0.141798749931344[/C][C]0.122094578308698[/C][C]0.904844961577067[/C][/ROW]
[/TABLE]
Source: https://freestatistics.org/blog/index.php?pk=&T=1

Globally Unique Identifier (entire table): ba.freestatistics.org/blog/index.php?pk=&T=1

As an alternative you can also use a QR Code:  

The GUIDs for individual cells are displayed in the table below:

Coefficients of Bias-Reduced Logistic Regression
VariableParameterS.E.t-stat2-sided p-value
(Intercept)0.1868292532291235.80005942987780.03221161015466690.97483286799103
X10.3996543543146941.724376520426970.231767453094140.820623777504946
X2-0.1578142463828771.48806227904544-0.1060535224937710.917292145557882
X30.3175499195383181.474465714978950.2153660924851350.833098878956703
X4-0.06410288074535861.6476479715749-0.03890568971725570.969605353930085
X5-0.7390085259249721.81750346642743-0.4066063914461750.691455315550264
Inter1.084902094832580.4053612910258792.676383065800220.0201713604198288
Score0.0173128585775680.1417987499313440.1220945783086980.904844961577067


Summary of Bias-Reduced Logistic Regression
Deviance6.09122024492472
Penalized deviance3.53423571571766
Residual Degrees of Freedom12
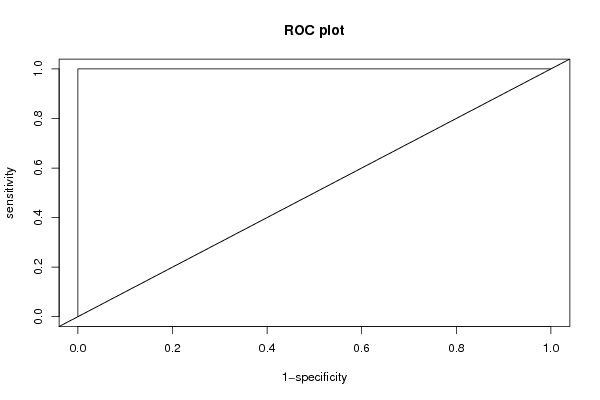
ROC Area1
Hosmer–Lemeshow test
Chi-square3.31189201261156
Degrees of Freedom8
P(>Chi)0.913288535781794

\begin{tabular}{lllllllll}
\hline
Summary of Bias-Reduced Logistic Regression \tabularnewline
Deviance & 6.09122024492472 \tabularnewline
Penalized deviance & 3.53423571571766 \tabularnewline
Residual Degrees of Freedom & 12 \tabularnewline
ROC Area & 1 \tabularnewline
Hosmer–Lemeshow test \tabularnewline
Chi-square & 3.31189201261156 \tabularnewline
Degrees of Freedom & 8 \tabularnewline
P(>Chi) & 0.913288535781794 \tabularnewline
\hline
\end{tabular}
%Source: https://freestatistics.org/blog/index.php?pk=&T=2

[TABLE]
[ROW][C]Summary of Bias-Reduced Logistic Regression[/C][/ROW]
[ROW][C]Deviance[/C][C]6.09122024492472[/C][/ROW]
[ROW][C]Penalized deviance[/C][C]3.53423571571766[/C][/ROW]
[ROW][C]Residual Degrees of Freedom[/C][C]12[/C][/ROW]
[ROW][C]ROC Area[/C][C]1[/C][/ROW]
[ROW][C]Hosmer–Lemeshow test[/C][/ROW]
[ROW][C]Chi-square[/C][C]3.31189201261156[/C][/ROW]
[ROW][C]Degrees of Freedom[/C][C]8[/C][/ROW]
[ROW][C]P(>Chi)[/C][C]0.913288535781794[/C][/ROW]
[/TABLE]
Source: https://freestatistics.org/blog/index.php?pk=&T=2

Globally Unique Identifier (entire table): ba.freestatistics.org/blog/index.php?pk=&T=2

As an alternative you can also use a QR Code:  

The GUIDs for individual cells are displayed in the table below:

Summary of Bias-Reduced Logistic Regression
Deviance6.09122024492472
Penalized deviance3.53423571571766
Residual Degrees of Freedom12
ROC Area1
Hosmer–Lemeshow test
Chi-square3.31189201261156
Degrees of Freedom8
P(>Chi)0.913288535781794


Fit of Logistic Regression
IndexActualFittedError
110.8578102123748310.142189787625169
200.0868572702395354-0.0868572702395354
310.7949081212585520.205091878741448
400.0808260352477366-0.0808260352477366
510.8225745174794430.177425482520557
600.204744459229321-0.204744459229321
710.8608056373559080.139194362644092
800.079549106497144-0.079549106497144
910.8776251406089170.122374859391083
1000.0931420835397727-0.0931420835397727
1110.8210859965735650.178914003426435
1200.0857182217643435-0.0857182217643435
1310.8212471158647120.178752884135288
1400.139717946925444-0.139717946925444
1510.8225426754975390.177457324502461
1600.108297792307243-0.108297792307243
1710.8511535812011970.148846418798803
1800.16549547704605-0.16549547704605
1910.84210777037050.1578922296295
2000.134111830156408-0.134111830156408

\begin{tabular}{lllllllll}
\hline
Fit of Logistic Regression \tabularnewline
Index & Actual & Fitted & Error \tabularnewline
1 & 1 & 0.857810212374831 & 0.142189787625169 \tabularnewline
2 & 0 & 0.0868572702395354 & -0.0868572702395354 \tabularnewline
3 & 1 & 0.794908121258552 & 0.205091878741448 \tabularnewline
4 & 0 & 0.0808260352477366 & -0.0808260352477366 \tabularnewline
5 & 1 & 0.822574517479443 & 0.177425482520557 \tabularnewline
6 & 0 & 0.204744459229321 & -0.204744459229321 \tabularnewline
7 & 1 & 0.860805637355908 & 0.139194362644092 \tabularnewline
8 & 0 & 0.079549106497144 & -0.079549106497144 \tabularnewline
9 & 1 & 0.877625140608917 & 0.122374859391083 \tabularnewline
10 & 0 & 0.0931420835397727 & -0.0931420835397727 \tabularnewline
11 & 1 & 0.821085996573565 & 0.178914003426435 \tabularnewline
12 & 0 & 0.0857182217643435 & -0.0857182217643435 \tabularnewline
13 & 1 & 0.821247115864712 & 0.178752884135288 \tabularnewline
14 & 0 & 0.139717946925444 & -0.139717946925444 \tabularnewline
15 & 1 & 0.822542675497539 & 0.177457324502461 \tabularnewline
16 & 0 & 0.108297792307243 & -0.108297792307243 \tabularnewline
17 & 1 & 0.851153581201197 & 0.148846418798803 \tabularnewline
18 & 0 & 0.16549547704605 & -0.16549547704605 \tabularnewline
19 & 1 & 0.8421077703705 & 0.1578922296295 \tabularnewline
20 & 0 & 0.134111830156408 & -0.134111830156408 \tabularnewline
\hline
\end{tabular}
%Source: https://freestatistics.org/blog/index.php?pk=&T=3

[TABLE]
[ROW][C]Fit of Logistic Regression[/C][/ROW]
[ROW][C]Index[/C][C]Actual[/C][C]Fitted[/C][C]Error[/C][/ROW]
[ROW][C]1[/C][C]1[/C][C]0.857810212374831[/C][C]0.142189787625169[/C][/ROW]
[ROW][C]2[/C][C]0[/C][C]0.0868572702395354[/C][C]-0.0868572702395354[/C][/ROW]
[ROW][C]3[/C][C]1[/C][C]0.794908121258552[/C][C]0.205091878741448[/C][/ROW]
[ROW][C]4[/C][C]0[/C][C]0.0808260352477366[/C][C]-0.0808260352477366[/C][/ROW]
[ROW][C]5[/C][C]1[/C][C]0.822574517479443[/C][C]0.177425482520557[/C][/ROW]
[ROW][C]6[/C][C]0[/C][C]0.204744459229321[/C][C]-0.204744459229321[/C][/ROW]
[ROW][C]7[/C][C]1[/C][C]0.860805637355908[/C][C]0.139194362644092[/C][/ROW]
[ROW][C]8[/C][C]0[/C][C]0.079549106497144[/C][C]-0.079549106497144[/C][/ROW]
[ROW][C]9[/C][C]1[/C][C]0.877625140608917[/C][C]0.122374859391083[/C][/ROW]
[ROW][C]10[/C][C]0[/C][C]0.0931420835397727[/C][C]-0.0931420835397727[/C][/ROW]
[ROW][C]11[/C][C]1[/C][C]0.821085996573565[/C][C]0.178914003426435[/C][/ROW]
[ROW][C]12[/C][C]0[/C][C]0.0857182217643435[/C][C]-0.0857182217643435[/C][/ROW]
[ROW][C]13[/C][C]1[/C][C]0.821247115864712[/C][C]0.178752884135288[/C][/ROW]
[ROW][C]14[/C][C]0[/C][C]0.139717946925444[/C][C]-0.139717946925444[/C][/ROW]
[ROW][C]15[/C][C]1[/C][C]0.822542675497539[/C][C]0.177457324502461[/C][/ROW]
[ROW][C]16[/C][C]0[/C][C]0.108297792307243[/C][C]-0.108297792307243[/C][/ROW]
[ROW][C]17[/C][C]1[/C][C]0.851153581201197[/C][C]0.148846418798803[/C][/ROW]
[ROW][C]18[/C][C]0[/C][C]0.16549547704605[/C][C]-0.16549547704605[/C][/ROW]
[ROW][C]19[/C][C]1[/C][C]0.8421077703705[/C][C]0.1578922296295[/C][/ROW]
[ROW][C]20[/C][C]0[/C][C]0.134111830156408[/C][C]-0.134111830156408[/C][/ROW]
[/TABLE]
Source: https://freestatistics.org/blog/index.php?pk=&T=3

Globally Unique Identifier (entire table): ba.freestatistics.org/blog/index.php?pk=&T=3

As an alternative you can also use a QR Code:  

The GUIDs for individual cells are displayed in the table below:

Fit of Logistic Regression
IndexActualFittedError
110.8578102123748310.142189787625169
200.0868572702395354-0.0868572702395354
310.7949081212585520.205091878741448
400.0808260352477366-0.0808260352477366
510.8225745174794430.177425482520557
600.204744459229321-0.204744459229321
710.8608056373559080.139194362644092
800.079549106497144-0.079549106497144
910.8776251406089170.122374859391083
1000.0931420835397727-0.0931420835397727
1110.8210859965735650.178914003426435
1200.0857182217643435-0.0857182217643435
1310.8212471158647120.178752884135288
1400.139717946925444-0.139717946925444
1510.8225426754975390.177457324502461
1600.108297792307243-0.108297792307243
1710.8511535812011970.148846418798803
1800.16549547704605-0.16549547704605
1910.84210777037050.1578922296295
2000.134111830156408-0.134111830156408


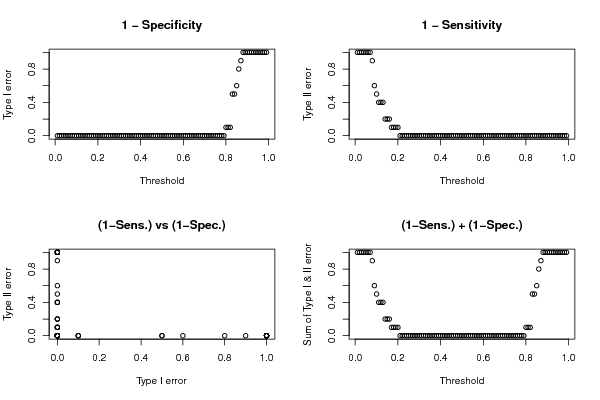
Type I & II errors for various threshold values
ThresholdType IType II
0.0101
0.0201
0.0301
0.0401
0.0501
0.0601
0.0701
0.0800.9
0.0900.6
0.100.5
0.1100.4
0.1200.4
0.1300.4
0.1400.2
0.1500.2
0.1600.2
0.1700.1
0.1800.1
0.1900.1
0.200.1
0.2100
0.2200
0.2300
0.2400
0.2500
0.2600
0.2700
0.2800
0.2900
0.300
0.3100
0.3200
0.3300
0.3400
0.3500
0.3600
0.3700
0.3800
0.3900
0.400
0.4100
0.4200
0.4300
0.4400
0.4500
0.4600
0.4700
0.4800
0.4900
0.500
0.5100
0.5200
0.5300
0.5400
0.5500
0.5600
0.5700
0.5800
0.5900
0.600
0.6100
0.6200
0.6300
0.6400
0.6500
0.6600
0.6700
0.6800
0.6900
0.700
0.7100
0.7200
0.7300
0.7400
0.7500
0.7600
0.7700
0.7800
0.7900
0.80.10
0.810.10
0.820.10
0.830.50
0.840.50
0.850.60
0.860.80
0.870.90
0.8810
0.8910
0.910
0.9110
0.9210
0.9310
0.9410
0.9510
0.9610
0.9710
0.9810
0.9910

\begin{tabular}{lllllllll}
\hline
Type I & II errors for various threshold values \tabularnewline
Threshold & Type I & Type II \tabularnewline
0.01 & 0 & 1 \tabularnewline
0.02 & 0 & 1 \tabularnewline
0.03 & 0 & 1 \tabularnewline
0.04 & 0 & 1 \tabularnewline
0.05 & 0 & 1 \tabularnewline
0.06 & 0 & 1 \tabularnewline
0.07 & 0 & 1 \tabularnewline
0.08 & 0 & 0.9 \tabularnewline
0.09 & 0 & 0.6 \tabularnewline
0.1 & 0 & 0.5 \tabularnewline
0.11 & 0 & 0.4 \tabularnewline
0.12 & 0 & 0.4 \tabularnewline
0.13 & 0 & 0.4 \tabularnewline
0.14 & 0 & 0.2 \tabularnewline
0.15 & 0 & 0.2 \tabularnewline
0.16 & 0 & 0.2 \tabularnewline
0.17 & 0 & 0.1 \tabularnewline
0.18 & 0 & 0.1 \tabularnewline
0.19 & 0 & 0.1 \tabularnewline
0.2 & 0 & 0.1 \tabularnewline
0.21 & 0 & 0 \tabularnewline
0.22 & 0 & 0 \tabularnewline
0.23 & 0 & 0 \tabularnewline
0.24 & 0 & 0 \tabularnewline
0.25 & 0 & 0 \tabularnewline
0.26 & 0 & 0 \tabularnewline
0.27 & 0 & 0 \tabularnewline
0.28 & 0 & 0 \tabularnewline
0.29 & 0 & 0 \tabularnewline
0.3 & 0 & 0 \tabularnewline
0.31 & 0 & 0 \tabularnewline
0.32 & 0 & 0 \tabularnewline
0.33 & 0 & 0 \tabularnewline
0.34 & 0 & 0 \tabularnewline
0.35 & 0 & 0 \tabularnewline
0.36 & 0 & 0 \tabularnewline
0.37 & 0 & 0 \tabularnewline
0.38 & 0 & 0 \tabularnewline
0.39 & 0 & 0 \tabularnewline
0.4 & 0 & 0 \tabularnewline
0.41 & 0 & 0 \tabularnewline
0.42 & 0 & 0 \tabularnewline
0.43 & 0 & 0 \tabularnewline
0.44 & 0 & 0 \tabularnewline
0.45 & 0 & 0 \tabularnewline
0.46 & 0 & 0 \tabularnewline
0.47 & 0 & 0 \tabularnewline
0.48 & 0 & 0 \tabularnewline
0.49 & 0 & 0 \tabularnewline
0.5 & 0 & 0 \tabularnewline
0.51 & 0 & 0 \tabularnewline
0.52 & 0 & 0 \tabularnewline
0.53 & 0 & 0 \tabularnewline
0.54 & 0 & 0 \tabularnewline
0.55 & 0 & 0 \tabularnewline
0.56 & 0 & 0 \tabularnewline
0.57 & 0 & 0 \tabularnewline
0.58 & 0 & 0 \tabularnewline
0.59 & 0 & 0 \tabularnewline
0.6 & 0 & 0 \tabularnewline
0.61 & 0 & 0 \tabularnewline
0.62 & 0 & 0 \tabularnewline
0.63 & 0 & 0 \tabularnewline
0.64 & 0 & 0 \tabularnewline
0.65 & 0 & 0 \tabularnewline
0.66 & 0 & 0 \tabularnewline
0.67 & 0 & 0 \tabularnewline
0.68 & 0 & 0 \tabularnewline
0.69 & 0 & 0 \tabularnewline
0.7 & 0 & 0 \tabularnewline
0.71 & 0 & 0 \tabularnewline
0.72 & 0 & 0 \tabularnewline
0.73 & 0 & 0 \tabularnewline
0.74 & 0 & 0 \tabularnewline
0.75 & 0 & 0 \tabularnewline
0.76 & 0 & 0 \tabularnewline
0.77 & 0 & 0 \tabularnewline
0.78 & 0 & 0 \tabularnewline
0.79 & 0 & 0 \tabularnewline
0.8 & 0.1 & 0 \tabularnewline
0.81 & 0.1 & 0 \tabularnewline
0.82 & 0.1 & 0 \tabularnewline
0.83 & 0.5 & 0 \tabularnewline
0.84 & 0.5 & 0 \tabularnewline
0.85 & 0.6 & 0 \tabularnewline
0.86 & 0.8 & 0 \tabularnewline
0.87 & 0.9 & 0 \tabularnewline
0.88 & 1 & 0 \tabularnewline
0.89 & 1 & 0 \tabularnewline
0.9 & 1 & 0 \tabularnewline
0.91 & 1 & 0 \tabularnewline
0.92 & 1 & 0 \tabularnewline
0.93 & 1 & 0 \tabularnewline
0.94 & 1 & 0 \tabularnewline
0.95 & 1 & 0 \tabularnewline
0.96 & 1 & 0 \tabularnewline
0.97 & 1 & 0 \tabularnewline
0.98 & 1 & 0 \tabularnewline
0.99 & 1 & 0 \tabularnewline
\hline
\end{tabular}
%Source: https://freestatistics.org/blog/index.php?pk=&T=4

[TABLE]
[ROW][C]Type I & II errors for various threshold values[/C][/ROW]
[ROW][C]Threshold[/C][C]Type I[/C][C]Type II[/C][/ROW]
[ROW][C]0.01[/C][C]0[/C][C]1[/C][/ROW]
[ROW][C]0.02[/C][C]0[/C][C]1[/C][/ROW]
[ROW][C]0.03[/C][C]0[/C][C]1[/C][/ROW]
[ROW][C]0.04[/C][C]0[/C][C]1[/C][/ROW]
[ROW][C]0.05[/C][C]0[/C][C]1[/C][/ROW]
[ROW][C]0.06[/C][C]0[/C][C]1[/C][/ROW]
[ROW][C]0.07[/C][C]0[/C][C]1[/C][/ROW]
[ROW][C]0.08[/C][C]0[/C][C]0.9[/C][/ROW]
[ROW][C]0.09[/C][C]0[/C][C]0.6[/C][/ROW]
[ROW][C]0.1[/C][C]0[/C][C]0.5[/C][/ROW]
[ROW][C]0.11[/C][C]0[/C][C]0.4[/C][/ROW]
[ROW][C]0.12[/C][C]0[/C][C]0.4[/C][/ROW]
[ROW][C]0.13[/C][C]0[/C][C]0.4[/C][/ROW]
[ROW][C]0.14[/C][C]0[/C][C]0.2[/C][/ROW]
[ROW][C]0.15[/C][C]0[/C][C]0.2[/C][/ROW]
[ROW][C]0.16[/C][C]0[/C][C]0.2[/C][/ROW]
[ROW][C]0.17[/C][C]0[/C][C]0.1[/C][/ROW]
[ROW][C]0.18[/C][C]0[/C][C]0.1[/C][/ROW]
[ROW][C]0.19[/C][C]0[/C][C]0.1[/C][/ROW]
[ROW][C]0.2[/C][C]0[/C][C]0.1[/C][/ROW]
[ROW][C]0.21[/C][C]0[/C][C]0[/C][/ROW]
[ROW][C]0.22[/C][C]0[/C][C]0[/C][/ROW]
[ROW][C]0.23[/C][C]0[/C][C]0[/C][/ROW]
[ROW][C]0.24[/C][C]0[/C][C]0[/C][/ROW]
[ROW][C]0.25[/C][C]0[/C][C]0[/C][/ROW]
[ROW][C]0.26[/C][C]0[/C][C]0[/C][/ROW]
[ROW][C]0.27[/C][C]0[/C][C]0[/C][/ROW]
[ROW][C]0.28[/C][C]0[/C][C]0[/C][/ROW]
[ROW][C]0.29[/C][C]0[/C][C]0[/C][/ROW]
[ROW][C]0.3[/C][C]0[/C][C]0[/C][/ROW]
[ROW][C]0.31[/C][C]0[/C][C]0[/C][/ROW]
[ROW][C]0.32[/C][C]0[/C][C]0[/C][/ROW]
[ROW][C]0.33[/C][C]0[/C][C]0[/C][/ROW]
[ROW][C]0.34[/C][C]0[/C][C]0[/C][/ROW]
[ROW][C]0.35[/C][C]0[/C][C]0[/C][/ROW]
[ROW][C]0.36[/C][C]0[/C][C]0[/C][/ROW]
[ROW][C]0.37[/C][C]0[/C][C]0[/C][/ROW]
[ROW][C]0.38[/C][C]0[/C][C]0[/C][/ROW]
[ROW][C]0.39[/C][C]0[/C][C]0[/C][/ROW]
[ROW][C]0.4[/C][C]0[/C][C]0[/C][/ROW]
[ROW][C]0.41[/C][C]0[/C][C]0[/C][/ROW]
[ROW][C]0.42[/C][C]0[/C][C]0[/C][/ROW]
[ROW][C]0.43[/C][C]0[/C][C]0[/C][/ROW]
[ROW][C]0.44[/C][C]0[/C][C]0[/C][/ROW]
[ROW][C]0.45[/C][C]0[/C][C]0[/C][/ROW]
[ROW][C]0.46[/C][C]0[/C][C]0[/C][/ROW]
[ROW][C]0.47[/C][C]0[/C][C]0[/C][/ROW]
[ROW][C]0.48[/C][C]0[/C][C]0[/C][/ROW]
[ROW][C]0.49[/C][C]0[/C][C]0[/C][/ROW]
[ROW][C]0.5[/C][C]0[/C][C]0[/C][/ROW]
[ROW][C]0.51[/C][C]0[/C][C]0[/C][/ROW]
[ROW][C]0.52[/C][C]0[/C][C]0[/C][/ROW]
[ROW][C]0.53[/C][C]0[/C][C]0[/C][/ROW]
[ROW][C]0.54[/C][C]0[/C][C]0[/C][/ROW]
[ROW][C]0.55[/C][C]0[/C][C]0[/C][/ROW]
[ROW][C]0.56[/C][C]0[/C][C]0[/C][/ROW]
[ROW][C]0.57[/C][C]0[/C][C]0[/C][/ROW]
[ROW][C]0.58[/C][C]0[/C][C]0[/C][/ROW]
[ROW][C]0.59[/C][C]0[/C][C]0[/C][/ROW]
[ROW][C]0.6[/C][C]0[/C][C]0[/C][/ROW]
[ROW][C]0.61[/C][C]0[/C][C]0[/C][/ROW]
[ROW][C]0.62[/C][C]0[/C][C]0[/C][/ROW]
[ROW][C]0.63[/C][C]0[/C][C]0[/C][/ROW]
[ROW][C]0.64[/C][C]0[/C][C]0[/C][/ROW]
[ROW][C]0.65[/C][C]0[/C][C]0[/C][/ROW]
[ROW][C]0.66[/C][C]0[/C][C]0[/C][/ROW]
[ROW][C]0.67[/C][C]0[/C][C]0[/C][/ROW]
[ROW][C]0.68[/C][C]0[/C][C]0[/C][/ROW]
[ROW][C]0.69[/C][C]0[/C][C]0[/C][/ROW]
[ROW][C]0.7[/C][C]0[/C][C]0[/C][/ROW]
[ROW][C]0.71[/C][C]0[/C][C]0[/C][/ROW]
[ROW][C]0.72[/C][C]0[/C][C]0[/C][/ROW]
[ROW][C]0.73[/C][C]0[/C][C]0[/C][/ROW]
[ROW][C]0.74[/C][C]0[/C][C]0[/C][/ROW]
[ROW][C]0.75[/C][C]0[/C][C]0[/C][/ROW]
[ROW][C]0.76[/C][C]0[/C][C]0[/C][/ROW]
[ROW][C]0.77[/C][C]0[/C][C]0[/C][/ROW]
[ROW][C]0.78[/C][C]0[/C][C]0[/C][/ROW]
[ROW][C]0.79[/C][C]0[/C][C]0[/C][/ROW]
[ROW][C]0.8[/C][C]0.1[/C][C]0[/C][/ROW]
[ROW][C]0.81[/C][C]0.1[/C][C]0[/C][/ROW]
[ROW][C]0.82[/C][C]0.1[/C][C]0[/C][/ROW]
[ROW][C]0.83[/C][C]0.5[/C][C]0[/C][/ROW]
[ROW][C]0.84[/C][C]0.5[/C][C]0[/C][/ROW]
[ROW][C]0.85[/C][C]0.6[/C][C]0[/C][/ROW]
[ROW][C]0.86[/C][C]0.8[/C][C]0[/C][/ROW]
[ROW][C]0.87[/C][C]0.9[/C][C]0[/C][/ROW]
[ROW][C]0.88[/C][C]1[/C][C]0[/C][/ROW]
[ROW][C]0.89[/C][C]1[/C][C]0[/C][/ROW]
[ROW][C]0.9[/C][C]1[/C][C]0[/C][/ROW]
[ROW][C]0.91[/C][C]1[/C][C]0[/C][/ROW]
[ROW][C]0.92[/C][C]1[/C][C]0[/C][/ROW]
[ROW][C]0.93[/C][C]1[/C][C]0[/C][/ROW]
[ROW][C]0.94[/C][C]1[/C][C]0[/C][/ROW]
[ROW][C]0.95[/C][C]1[/C][C]0[/C][/ROW]
[ROW][C]0.96[/C][C]1[/C][C]0[/C][/ROW]
[ROW][C]0.97[/C][C]1[/C][C]0[/C][/ROW]
[ROW][C]0.98[/C][C]1[/C][C]0[/C][/ROW]
[ROW][C]0.99[/C][C]1[/C][C]0[/C][/ROW]
[/TABLE]
Source: https://freestatistics.org/blog/index.php?pk=&T=4

Globally Unique Identifier (entire table): ba.freestatistics.org/blog/index.php?pk=&T=4

As an alternative you can also use a QR Code:  

The GUIDs for individual cells are displayed in the table below:

Type I & II errors for various threshold values
ThresholdType IType II
0.0101
0.0201
0.0301
0.0401
0.0501
0.0601
0.0701
0.0800.9
0.0900.6
0.100.5
0.1100.4
0.1200.4
0.1300.4
0.1400.2
0.1500.2
0.1600.2
0.1700.1
0.1800.1
0.1900.1
0.200.1
0.2100
0.2200
0.2300
0.2400
0.2500
0.2600
0.2700
0.2800
0.2900
0.300
0.3100
0.3200
0.3300
0.3400
0.3500
0.3600
0.3700
0.3800
0.3900
0.400
0.4100
0.4200
0.4300
0.4400
0.4500
0.4600
0.4700
0.4800
0.4900
0.500
0.5100
0.5200
0.5300
0.5400
0.5500
0.5600
0.5700
0.5800
0.5900
0.600
0.6100
0.6200
0.6300
0.6400
0.6500
0.6600
0.6700
0.6800
0.6900
0.700
0.7100
0.7200
0.7300
0.7400
0.7500
0.7600
0.7700
0.7800
0.7900
0.80.10
0.810.10
0.820.10
0.830.50
0.840.50
0.850.60
0.860.80
0.870.90
0.8810
0.8910
0.910
0.9110
0.9210
0.9310
0.9410
0.9510
0.9610
0.9710
0.9810
0.9910


Parameters (Session):
par1 = 12additive121212120.99two.sidedtwo.sided1888 ; par2 = 12periodicSingleDoubleTriple00.990.992Do not include Seasonal DummiesDo not include Seasonal DummiesDo not include Seasonal DummiesDo not include Seasonal Dummies ; par3 = 0additiveadditiveadditive000.99No Linear TrendNo Linear TrendNo Linear TrendNo Linear Trend ; par4 = 12121212two.sided ; par5 = 1unpaired ; par6 = 0 ; par7 = 1 ; par8 = FALSE ;
Parameters (R input):
R code (references can be found in the software module):
library(brglm)
roc.plot <- function (sd, sdc, newplot = TRUE, ...)
{
sall <- sort(c(sd, sdc))
sens <- 0
specc <- 0
for (i in length(sall):1) {
sens <- c(sens, mean(sd >= sall[i], na.rm = T))
specc <- c(specc, mean(sdc >= sall[i], na.rm = T))
}
if (newplot) {
plot(specc, sens, xlim = c(0, 1), ylim = c(0, 1), type = 'l',
xlab = '1-specificity', ylab = 'sensitivity', main = 'ROC plot', ...)
abline(0, 1)
}
else lines(specc, sens, ...)
npoints <- length(sens)
area <- sum(0.5 * (sens[-1] + sens[-npoints]) * (specc[-1] -
specc[-npoints]))
lift <- (sens - specc)[-1]
cutoff <- sall[lift == max(lift)][1]
sensopt <- sens[-1][lift == max(lift)][1]
specopt <- 1 - specc[-1][lift == max(lift)][1]
list(area = area, cutoff = cutoff, sensopt = sensopt, specopt = specopt)
}
roc.analysis <- function (object, newdata = NULL, newplot = TRUE, ...)
{
if (is.null(newdata)) {
sd <- object$fitted[object$y == 1]
sdc <- object$fitted[object$y == 0]
}
else {
sd <- predict(object, newdata, type = 'response')[newdata$y ==
1]
sdc <- predict(object, newdata, type = 'response')[newdata$y ==
0]
}
roc.plot(sd, sdc, newplot, ...)
}
hosmerlem <- function (y, yhat, g = 10)
{
cutyhat <- cut(yhat, breaks = quantile(yhat, probs = seq(0,
1, 1/g)), include.lowest = T)
obs <- xtabs(cbind(1 - y, y) ~ cutyhat)
expect <- xtabs(cbind(1 - yhat, yhat) ~ cutyhat)
chisq <- sum((obs - expect)^2/expect)
P <- 1 - pchisq(chisq, g - 2)
c('X^2' = chisq, Df = g - 2, 'P(>Chi)' = P)
}
x <- as.data.frame(t(y))
r <- brglm(x)
summary(r)
rc <- summary(r)$coeff
try(hm <- hosmerlem(y[1,],r$fitted.values),silent=T)
try(hm,silent=T)
bitmap(file='test0.png')
ra <- roc.analysis(r)
dev.off()
te <- array(0,dim=c(2,99))
for (i in 1:99) {
threshold <- i / 100
numcorr1 <- 0
numfaul1 <- 0
numcorr0 <- 0
numfaul0 <- 0
for (j in 1:length(r$fitted.values)) {
if (y[1,j] > 0.99) {
if (r$fitted.values[j] >= threshold) numcorr1 = numcorr1 + 1 else numfaul1 = numfaul1 + 1
} else {
if (r$fitted.values[j] < threshold) numcorr0 = numcorr0 + 1 else numfaul0 = numfaul0 + 1
}
}
te[1,i] <- numfaul1 / (numfaul1 + numcorr1)
te[2,i] <- numfaul0 / (numfaul0 + numcorr0)
}
bitmap(file='test1.png')
op <- par(mfrow=c(2,2))
plot((1:99)/100,te[1,],xlab='Threshold',ylab='Type I error', main='1 - Specificity')
plot((1:99)/100,te[2,],xlab='Threshold',ylab='Type II error', main='1 - Sensitivity')
plot(te[1,],te[2,],xlab='Type I error',ylab='Type II error', main='(1-Sens.) vs (1-Spec.)')
plot((1:99)/100,te[1,]+te[2,],xlab='Threshold',ylab='Sum of Type I & II error', main='(1-Sens.) + (1-Spec.)')
par(op)
dev.off()
load(file='createtable')
a<-table.start()
a<-table.row.start(a)
a<-table.element(a,'Coefficients of Bias-Reduced Logistic Regression',5,TRUE)
a<-table.row.end(a)
a<-table.row.start(a)
a<-table.element(a,'Variable',header=TRUE)
a<-table.element(a,'Parameter',header=TRUE)
a<-table.element(a,'S.E.',header=TRUE)
a<-table.element(a,'t-stat',header=TRUE)
a<-table.element(a,'2-sided p-value',header=TRUE)
a<-table.row.end(a)
for (i in 1:length(rc[,1])) {
a<-table.row.start(a)
a<-table.element(a,labels(rc)[[1]][i],header=TRUE)
a<-table.element(a,rc[i,1])
a<-table.element(a,rc[i,2])
a<-table.element(a,rc[i,3])
a<-table.element(a,2*(1-pt(abs(rc[i,3]),r$df.residual)))
a<-table.row.end(a)
}
a<-table.end(a)
table.save(a,file='mytable.tab')
a<-table.start()
a<-table.row.start(a)
a<-table.element(a,'Summary of Bias-Reduced Logistic Regression',2,TRUE)
a<-table.row.end(a)
a<-table.row.start(a)
a<-table.element(a,'Deviance',1,TRUE)
a<-table.element(a,r$deviance)
a<-table.row.end(a)
a<-table.row.start(a)
a<-table.element(a,'Penalized deviance',1,TRUE)
a<-table.element(a,r$penalized.deviance)
a<-table.row.end(a)
a<-table.row.start(a)
a<-table.element(a,'Residual Degrees of Freedom',1,TRUE)
a<-table.element(a,r$df.residual)
a<-table.row.end(a)
a<-table.row.start(a)
a<-table.element(a,'ROC Area',1,TRUE)
a<-table.element(a,ra$area)
a<-table.row.end(a)
a<-table.row.start(a)
a<-table.element(a,'Hosmer–Lemeshow test',2,TRUE)
a<-table.row.end(a)
a<-table.row.start(a)
a<-table.element(a,'Chi-square',1,TRUE)
phm <- array('NA',dim=3)
for (i in 1:3) { try(phm[i] <- hm[i],silent=T) }
a<-table.element(a,phm[1])
a<-table.row.end(a)
a<-table.row.start(a)
a<-table.element(a,'Degrees of Freedom',1,TRUE)
a<-table.element(a,phm[2])
a<-table.row.end(a)
a<-table.row.start(a)
a<-table.element(a,'P(>Chi)',1,TRUE)
a<-table.element(a,phm[3])
a<-table.row.end(a)
a<-table.end(a)
table.save(a,file='mytable1.tab')
a<-table.start()
a<-table.row.start(a)
a<-table.element(a,'Fit of Logistic Regression',4,TRUE)
a<-table.row.end(a)
a<-table.row.start(a)
a<-table.element(a,'Index',1,TRUE)
a<-table.element(a,'Actual',1,TRUE)
a<-table.element(a,'Fitted',1,TRUE)
a<-table.element(a,'Error',1,TRUE)
a<-table.row.end(a)
for (i in 1:length(r$fitted.values)) {
a<-table.row.start(a)
a<-table.element(a,i,1,TRUE)
a<-table.element(a,y[1,i])
a<-table.element(a,r$fitted.values[i])
a<-table.element(a,y[1,i]-r$fitted.values[i])
a<-table.row.end(a)
}
a<-table.end(a)
table.save(a,file='mytable2.tab')
a<-table.start()
a<-table.row.start(a)
a<-table.element(a,'Type I & II errors for various threshold values',3,TRUE)
a<-table.row.end(a)
a<-table.row.start(a)
a<-table.element(a,'Threshold',1,TRUE)
a<-table.element(a,'Type I',1,TRUE)
a<-table.element(a,'Type II',1,TRUE)
a<-table.row.end(a)
for (i in 1:99) {
a<-table.row.start(a)
a<-table.element(a,i/100,1,TRUE)
a<-table.element(a,te[1,i])
a<-table.element(a,te[2,i])
a<-table.row.end(a)
}
a<-table.end(a)
table.save(a,file='mytable3.tab')