Free Statistics

of Irreproducible Research!

Author's title

Author*The author of this computation has been verified*
R Software Modulerwasp_autocorrelation.wasp
Title produced by software(Partial) Autocorrelation Function
Date of computationTue, 24 Jan 2017 16:02:59 +0100
Cite this page as followsStatistical Computations at FreeStatistics.org, Office for Research Development and Education, URL https://freestatistics.org/blog/index.php?v=date/2017/Jan/24/t1485270196xjy7gl2vat2ca2u.htm/, Retrieved Tue, 14 May 2024 07:43:45 +0000
Statistical Computations at FreeStatistics.org, Office for Research Development and Education, URL https://freestatistics.org/blog/index.php?pk=305196, Retrieved Tue, 14 May 2024 07:43:45 +0000
QR Codes:

Original text written by user:
IsPrivate?No (this computation is public)
User-defined keywords
Estimated Impact52
Family? (F = Feedback message, R = changed R code, M = changed R Module, P = changed Parameters, D = changed Data)
-       [(Partial) Autocorrelation Function] [] [2017-01-24 15:02:59] [f20c721eaecf28dbff8d9b9768e8b0c7] [Current]
Feedback Forum

Post a new message
Dataseries X:
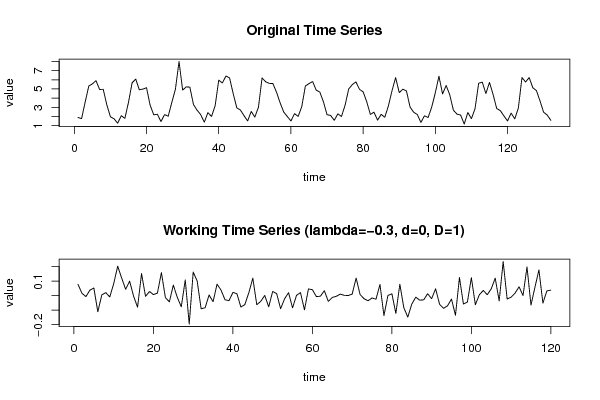
1.894
1.757
3.582
5.321
5.561
5.907
4.944
4.966
3.258
1.964
1.743
1.262
2.086
1.793
3.548
5.672
6.084
4.914
4.990
5.139
3.218
2.179
2.238
1.442
2.205
2.025
3.531
4.977
7.998
4.880
5.231
5.202
3.303
2.683
2.202
1.376
2.422
1.997
3.163
5.964
5.657
6.415
6.208
4.500
2.939
2.702
2.090
1.504
2.549
1.931
3.013
6.204
5.788
5.611
5.594
4.647
3.490
2.487
1.992
1.507
2.306
2.002
3.075
5.331
5.589
5.813
4.876
4.665
3.601
2.192
2.111
1.580
2.288
1.993
3.228
5.000
5.480
5.770
4.962
4.685
3.607
2.222
2.467
1.594
2.228
1.910
3.157
4.809
6.249
4.607
4.975
4.784
3.028
2.461
2.218
1.351
2.070
1.887
3.024
4.596
6.398
4.459
5.382
4.359
2.687
2.249
2.154
1.169
2.429
1.762
2.846
5.627
5.749
4.502
5.720
4.403
2.867
2.635
2.059
1.511
2.359
1.741
2.917
6.249
5.760
6.250
5.134
4.831
3.695
2.462
2.146
1.579


Summary of computational transaction
Raw Input view raw input (R code)
Raw Outputview raw output of R engine
Computing time1 seconds
R ServerBig Analytics Cloud Computing Center

\begin{tabular}{lllllllll}
\hline
Summary of computational transaction \tabularnewline
Raw Input view raw input (R code)  \tabularnewline
Raw Outputview raw output of R engine  \tabularnewline
Computing time1 seconds \tabularnewline
R ServerBig Analytics Cloud Computing Center \tabularnewline
\hline
\end{tabular}
%Source: https://freestatistics.org/blog/index.php?pk=305196&T=0

[TABLE]
[ROW]
Summary of computational transaction[/C][/ROW] [ROW]Raw Input[/C] view raw input (R code) [/C][/ROW] [ROW]Raw Output[/C]view raw output of R engine [/C][/ROW] [ROW]Computing time[/C]1 seconds[/C][/ROW] [ROW]R Server[/C]Big Analytics Cloud Computing Center[/C][/ROW] [/TABLE] Source: https://freestatistics.org/blog/index.php?pk=305196&T=0

Globally Unique Identifier (entire table): ba.freestatistics.org/blog/index.php?pk=305196&T=0

As an alternative you can also use a QR Code:  

The GUIDs for individual cells are displayed in the table below:

Summary of computational transaction
Raw Input view raw input (R code)
Raw Outputview raw output of R engine
Computing time1 seconds
R ServerBig Analytics Cloud Computing Center


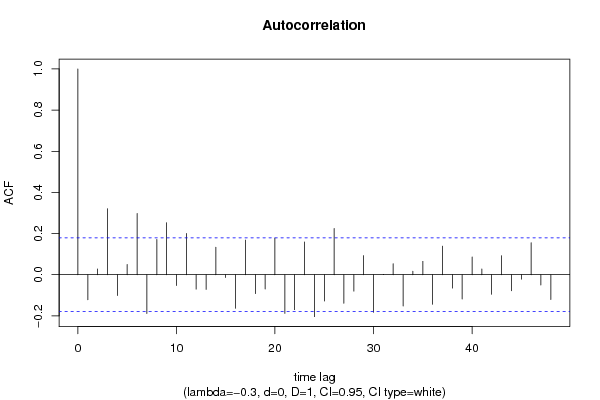
Autocorrelation Function
Time lag kACF(k)T-STATP-value
1-0.121784-1.33410.092352
20.0282960.310.378563
30.3209423.51570.00031
4-0.100839-1.10460.135764
50.0498760.54640.292915
60.2973713.25750.000731
7-0.188708-2.06720.020433
80.1715611.87940.03131
90.252412.7650.003296
10-0.052159-0.57140.284408
110.2004372.19570.015019
12-0.069954-0.76630.222498
13-0.071202-0.780.21847
140.1340161.46810.07235
15-0.01332-0.14590.442117
16-0.162863-1.78410.03847
170.1680881.84130.034023
18-0.091661-1.00410.158676
19-0.069041-0.75630.225475
200.1778931.94870.026832
21-0.187808-2.05730.020911
22-0.169591-1.85780.032826
230.1592451.74440.041821
24-0.203695-2.23140.013757
25-0.127332-1.39480.082819
260.2243222.45730.007714
27-0.138385-1.51590.066084
28-0.079638-0.87240.192367
290.0928091.01670.155677
30-0.182023-1.9940.024212
310.0007510.00820.496726
320.0534780.58580.279546
33-0.151639-1.66110.04965
340.0170480.18680.426083
350.0648990.71090.239252
36-0.143187-1.56850.059695
370.1389071.52160.065364
38-0.064961-0.71160.239042
39-0.11787-1.29120.099557
400.0862480.94480.173329
410.0278360.30490.380473
42-0.095026-1.0410.149993
430.0922621.01070.157101
44-0.077806-0.85230.197867
45-0.021423-0.23470.407429
460.1553751.7020.045668
47-0.049914-0.54680.292771
48-0.120237-1.31710.095152

\begin{tabular}{lllllllll}
\hline
Autocorrelation Function \tabularnewline
Time lag k & ACF(k) & T-STAT & P-value \tabularnewline
1 & -0.121784 & -1.3341 & 0.092352 \tabularnewline
2 & 0.028296 & 0.31 & 0.378563 \tabularnewline
3 & 0.320942 & 3.5157 & 0.00031 \tabularnewline
4 & -0.100839 & -1.1046 & 0.135764 \tabularnewline
5 & 0.049876 & 0.5464 & 0.292915 \tabularnewline
6 & 0.297371 & 3.2575 & 0.000731 \tabularnewline
7 & -0.188708 & -2.0672 & 0.020433 \tabularnewline
8 & 0.171561 & 1.8794 & 0.03131 \tabularnewline
9 & 0.25241 & 2.765 & 0.003296 \tabularnewline
10 & -0.052159 & -0.5714 & 0.284408 \tabularnewline
11 & 0.200437 & 2.1957 & 0.015019 \tabularnewline
12 & -0.069954 & -0.7663 & 0.222498 \tabularnewline
13 & -0.071202 & -0.78 & 0.21847 \tabularnewline
14 & 0.134016 & 1.4681 & 0.07235 \tabularnewline
15 & -0.01332 & -0.1459 & 0.442117 \tabularnewline
16 & -0.162863 & -1.7841 & 0.03847 \tabularnewline
17 & 0.168088 & 1.8413 & 0.034023 \tabularnewline
18 & -0.091661 & -1.0041 & 0.158676 \tabularnewline
19 & -0.069041 & -0.7563 & 0.225475 \tabularnewline
20 & 0.177893 & 1.9487 & 0.026832 \tabularnewline
21 & -0.187808 & -2.0573 & 0.020911 \tabularnewline
22 & -0.169591 & -1.8578 & 0.032826 \tabularnewline
23 & 0.159245 & 1.7444 & 0.041821 \tabularnewline
24 & -0.203695 & -2.2314 & 0.013757 \tabularnewline
25 & -0.127332 & -1.3948 & 0.082819 \tabularnewline
26 & 0.224322 & 2.4573 & 0.007714 \tabularnewline
27 & -0.138385 & -1.5159 & 0.066084 \tabularnewline
28 & -0.079638 & -0.8724 & 0.192367 \tabularnewline
29 & 0.092809 & 1.0167 & 0.155677 \tabularnewline
30 & -0.182023 & -1.994 & 0.024212 \tabularnewline
31 & 0.000751 & 0.0082 & 0.496726 \tabularnewline
32 & 0.053478 & 0.5858 & 0.279546 \tabularnewline
33 & -0.151639 & -1.6611 & 0.04965 \tabularnewline
34 & 0.017048 & 0.1868 & 0.426083 \tabularnewline
35 & 0.064899 & 0.7109 & 0.239252 \tabularnewline
36 & -0.143187 & -1.5685 & 0.059695 \tabularnewline
37 & 0.138907 & 1.5216 & 0.065364 \tabularnewline
38 & -0.064961 & -0.7116 & 0.239042 \tabularnewline
39 & -0.11787 & -1.2912 & 0.099557 \tabularnewline
40 & 0.086248 & 0.9448 & 0.173329 \tabularnewline
41 & 0.027836 & 0.3049 & 0.380473 \tabularnewline
42 & -0.095026 & -1.041 & 0.149993 \tabularnewline
43 & 0.092262 & 1.0107 & 0.157101 \tabularnewline
44 & -0.077806 & -0.8523 & 0.197867 \tabularnewline
45 & -0.021423 & -0.2347 & 0.407429 \tabularnewline
46 & 0.155375 & 1.702 & 0.045668 \tabularnewline
47 & -0.049914 & -0.5468 & 0.292771 \tabularnewline
48 & -0.120237 & -1.3171 & 0.095152 \tabularnewline
\hline
\end{tabular}
%Source: https://freestatistics.org/blog/index.php?pk=305196&T=1

[TABLE]
[ROW][C]Autocorrelation Function[/C][/ROW]
[ROW][C]Time lag k[/C][C]ACF(k)[/C][C]T-STAT[/C][C]P-value[/C][/ROW]
[ROW][C]1[/C][C]-0.121784[/C][C]-1.3341[/C][C]0.092352[/C][/ROW]
[ROW][C]2[/C][C]0.028296[/C][C]0.31[/C][C]0.378563[/C][/ROW]
[ROW][C]3[/C][C]0.320942[/C][C]3.5157[/C][C]0.00031[/C][/ROW]
[ROW][C]4[/C][C]-0.100839[/C][C]-1.1046[/C][C]0.135764[/C][/ROW]
[ROW][C]5[/C][C]0.049876[/C][C]0.5464[/C][C]0.292915[/C][/ROW]
[ROW][C]6[/C][C]0.297371[/C][C]3.2575[/C][C]0.000731[/C][/ROW]
[ROW][C]7[/C][C]-0.188708[/C][C]-2.0672[/C][C]0.020433[/C][/ROW]
[ROW][C]8[/C][C]0.171561[/C][C]1.8794[/C][C]0.03131[/C][/ROW]
[ROW][C]9[/C][C]0.25241[/C][C]2.765[/C][C]0.003296[/C][/ROW]
[ROW][C]10[/C][C]-0.052159[/C][C]-0.5714[/C][C]0.284408[/C][/ROW]
[ROW][C]11[/C][C]0.200437[/C][C]2.1957[/C][C]0.015019[/C][/ROW]
[ROW][C]12[/C][C]-0.069954[/C][C]-0.7663[/C][C]0.222498[/C][/ROW]
[ROW][C]13[/C][C]-0.071202[/C][C]-0.78[/C][C]0.21847[/C][/ROW]
[ROW][C]14[/C][C]0.134016[/C][C]1.4681[/C][C]0.07235[/C][/ROW]
[ROW][C]15[/C][C]-0.01332[/C][C]-0.1459[/C][C]0.442117[/C][/ROW]
[ROW][C]16[/C][C]-0.162863[/C][C]-1.7841[/C][C]0.03847[/C][/ROW]
[ROW][C]17[/C][C]0.168088[/C][C]1.8413[/C][C]0.034023[/C][/ROW]
[ROW][C]18[/C][C]-0.091661[/C][C]-1.0041[/C][C]0.158676[/C][/ROW]
[ROW][C]19[/C][C]-0.069041[/C][C]-0.7563[/C][C]0.225475[/C][/ROW]
[ROW][C]20[/C][C]0.177893[/C][C]1.9487[/C][C]0.026832[/C][/ROW]
[ROW][C]21[/C][C]-0.187808[/C][C]-2.0573[/C][C]0.020911[/C][/ROW]
[ROW][C]22[/C][C]-0.169591[/C][C]-1.8578[/C][C]0.032826[/C][/ROW]
[ROW][C]23[/C][C]0.159245[/C][C]1.7444[/C][C]0.041821[/C][/ROW]
[ROW][C]24[/C][C]-0.203695[/C][C]-2.2314[/C][C]0.013757[/C][/ROW]
[ROW][C]25[/C][C]-0.127332[/C][C]-1.3948[/C][C]0.082819[/C][/ROW]
[ROW][C]26[/C][C]0.224322[/C][C]2.4573[/C][C]0.007714[/C][/ROW]
[ROW][C]27[/C][C]-0.138385[/C][C]-1.5159[/C][C]0.066084[/C][/ROW]
[ROW][C]28[/C][C]-0.079638[/C][C]-0.8724[/C][C]0.192367[/C][/ROW]
[ROW][C]29[/C][C]0.092809[/C][C]1.0167[/C][C]0.155677[/C][/ROW]
[ROW][C]30[/C][C]-0.182023[/C][C]-1.994[/C][C]0.024212[/C][/ROW]
[ROW][C]31[/C][C]0.000751[/C][C]0.0082[/C][C]0.496726[/C][/ROW]
[ROW][C]32[/C][C]0.053478[/C][C]0.5858[/C][C]0.279546[/C][/ROW]
[ROW][C]33[/C][C]-0.151639[/C][C]-1.6611[/C][C]0.04965[/C][/ROW]
[ROW][C]34[/C][C]0.017048[/C][C]0.1868[/C][C]0.426083[/C][/ROW]
[ROW][C]35[/C][C]0.064899[/C][C]0.7109[/C][C]0.239252[/C][/ROW]
[ROW][C]36[/C][C]-0.143187[/C][C]-1.5685[/C][C]0.059695[/C][/ROW]
[ROW][C]37[/C][C]0.138907[/C][C]1.5216[/C][C]0.065364[/C][/ROW]
[ROW][C]38[/C][C]-0.064961[/C][C]-0.7116[/C][C]0.239042[/C][/ROW]
[ROW][C]39[/C][C]-0.11787[/C][C]-1.2912[/C][C]0.099557[/C][/ROW]
[ROW][C]40[/C][C]0.086248[/C][C]0.9448[/C][C]0.173329[/C][/ROW]
[ROW][C]41[/C][C]0.027836[/C][C]0.3049[/C][C]0.380473[/C][/ROW]
[ROW][C]42[/C][C]-0.095026[/C][C]-1.041[/C][C]0.149993[/C][/ROW]
[ROW][C]43[/C][C]0.092262[/C][C]1.0107[/C][C]0.157101[/C][/ROW]
[ROW][C]44[/C][C]-0.077806[/C][C]-0.8523[/C][C]0.197867[/C][/ROW]
[ROW][C]45[/C][C]-0.021423[/C][C]-0.2347[/C][C]0.407429[/C][/ROW]
[ROW][C]46[/C][C]0.155375[/C][C]1.702[/C][C]0.045668[/C][/ROW]
[ROW][C]47[/C][C]-0.049914[/C][C]-0.5468[/C][C]0.292771[/C][/ROW]
[ROW][C]48[/C][C]-0.120237[/C][C]-1.3171[/C][C]0.095152[/C][/ROW]
[/TABLE]
Source: https://freestatistics.org/blog/index.php?pk=305196&T=1

Globally Unique Identifier (entire table): ba.freestatistics.org/blog/index.php?pk=305196&T=1

As an alternative you can also use a QR Code:  

The GUIDs for individual cells are displayed in the table below:

Autocorrelation Function
Time lag kACF(k)T-STATP-value
1-0.121784-1.33410.092352
20.0282960.310.378563
30.3209423.51570.00031
4-0.100839-1.10460.135764
50.0498760.54640.292915
60.2973713.25750.000731
7-0.188708-2.06720.020433
80.1715611.87940.03131
90.252412.7650.003296
10-0.052159-0.57140.284408
110.2004372.19570.015019
12-0.069954-0.76630.222498
13-0.071202-0.780.21847
140.1340161.46810.07235
15-0.01332-0.14590.442117
16-0.162863-1.78410.03847
170.1680881.84130.034023
18-0.091661-1.00410.158676
19-0.069041-0.75630.225475
200.1778931.94870.026832
21-0.187808-2.05730.020911
22-0.169591-1.85780.032826
230.1592451.74440.041821
24-0.203695-2.23140.013757
25-0.127332-1.39480.082819
260.2243222.45730.007714
27-0.138385-1.51590.066084
28-0.079638-0.87240.192367
290.0928091.01670.155677
30-0.182023-1.9940.024212
310.0007510.00820.496726
320.0534780.58580.279546
33-0.151639-1.66110.04965
340.0170480.18680.426083
350.0648990.71090.239252
36-0.143187-1.56850.059695
370.1389071.52160.065364
38-0.064961-0.71160.239042
39-0.11787-1.29120.099557
400.0862480.94480.173329
410.0278360.30490.380473
42-0.095026-1.0410.149993
430.0922621.01070.157101
44-0.077806-0.85230.197867
45-0.021423-0.23470.407429
460.1553751.7020.045668
47-0.049914-0.54680.292771
48-0.120237-1.31710.095152


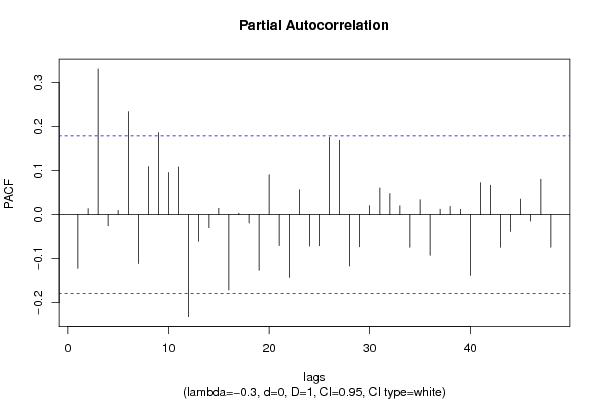
Partial Autocorrelation Function
Time lag kPACF(k)T-STATP-value
1-0.121784-1.33410.092352
20.0136670.14970.440621
30.3309753.62570.000212
4-0.025128-0.27530.391792
50.0093920.10290.459114
60.234062.5640.005791
7-0.111104-1.21710.112981
80.1090141.19420.117381
90.1862722.04050.021747
100.0958731.05020.14786
110.1082451.18580.119029
12-0.231779-2.5390.006198
13-0.060442-0.66210.254586
14-0.029519-0.32340.37349
150.0141850.15540.438387
16-0.170987-1.87310.031746
170.0031130.03410.486427
18-0.019213-0.21050.416831
19-0.126555-1.38630.084106
200.0905990.99250.161485
21-0.070321-0.77030.221309
22-0.142531-1.56130.060538
230.056580.61980.268282
24-0.071504-0.78330.2175
25-0.07071-0.77460.220052
260.1757931.92570.028253
270.1688561.84970.033407
28-0.116621-1.27750.101942
29-0.07291-0.79870.213023
300.0201560.22080.412812
310.0605540.66330.254196
320.047710.52260.301096
330.0199710.21880.413601
34-0.074139-0.81220.209157
350.0337050.36920.356307
36-0.092419-1.01240.156692
370.012450.13640.445875
380.0185030.20270.41986
390.0124080.13590.446054
40-0.138033-1.51210.066572
410.0725070.79430.214301
420.0668750.73260.232622
43-0.074091-0.81160.209307
44-0.038028-0.41660.338865
450.0351850.38540.350301
46-0.014574-0.15970.436711
470.0805450.88230.189683
48-0.073786-0.80830.210262

\begin{tabular}{lllllllll}
\hline
Partial Autocorrelation Function \tabularnewline
Time lag k & PACF(k) & T-STAT & P-value \tabularnewline
1 & -0.121784 & -1.3341 & 0.092352 \tabularnewline
2 & 0.013667 & 0.1497 & 0.440621 \tabularnewline
3 & 0.330975 & 3.6257 & 0.000212 \tabularnewline
4 & -0.025128 & -0.2753 & 0.391792 \tabularnewline
5 & 0.009392 & 0.1029 & 0.459114 \tabularnewline
6 & 0.23406 & 2.564 & 0.005791 \tabularnewline
7 & -0.111104 & -1.2171 & 0.112981 \tabularnewline
8 & 0.109014 & 1.1942 & 0.117381 \tabularnewline
9 & 0.186272 & 2.0405 & 0.021747 \tabularnewline
10 & 0.095873 & 1.0502 & 0.14786 \tabularnewline
11 & 0.108245 & 1.1858 & 0.119029 \tabularnewline
12 & -0.231779 & -2.539 & 0.006198 \tabularnewline
13 & -0.060442 & -0.6621 & 0.254586 \tabularnewline
14 & -0.029519 & -0.3234 & 0.37349 \tabularnewline
15 & 0.014185 & 0.1554 & 0.438387 \tabularnewline
16 & -0.170987 & -1.8731 & 0.031746 \tabularnewline
17 & 0.003113 & 0.0341 & 0.486427 \tabularnewline
18 & -0.019213 & -0.2105 & 0.416831 \tabularnewline
19 & -0.126555 & -1.3863 & 0.084106 \tabularnewline
20 & 0.090599 & 0.9925 & 0.161485 \tabularnewline
21 & -0.070321 & -0.7703 & 0.221309 \tabularnewline
22 & -0.142531 & -1.5613 & 0.060538 \tabularnewline
23 & 0.05658 & 0.6198 & 0.268282 \tabularnewline
24 & -0.071504 & -0.7833 & 0.2175 \tabularnewline
25 & -0.07071 & -0.7746 & 0.220052 \tabularnewline
26 & 0.175793 & 1.9257 & 0.028253 \tabularnewline
27 & 0.168856 & 1.8497 & 0.033407 \tabularnewline
28 & -0.116621 & -1.2775 & 0.101942 \tabularnewline
29 & -0.07291 & -0.7987 & 0.213023 \tabularnewline
30 & 0.020156 & 0.2208 & 0.412812 \tabularnewline
31 & 0.060554 & 0.6633 & 0.254196 \tabularnewline
32 & 0.04771 & 0.5226 & 0.301096 \tabularnewline
33 & 0.019971 & 0.2188 & 0.413601 \tabularnewline
34 & -0.074139 & -0.8122 & 0.209157 \tabularnewline
35 & 0.033705 & 0.3692 & 0.356307 \tabularnewline
36 & -0.092419 & -1.0124 & 0.156692 \tabularnewline
37 & 0.01245 & 0.1364 & 0.445875 \tabularnewline
38 & 0.018503 & 0.2027 & 0.41986 \tabularnewline
39 & 0.012408 & 0.1359 & 0.446054 \tabularnewline
40 & -0.138033 & -1.5121 & 0.066572 \tabularnewline
41 & 0.072507 & 0.7943 & 0.214301 \tabularnewline
42 & 0.066875 & 0.7326 & 0.232622 \tabularnewline
43 & -0.074091 & -0.8116 & 0.209307 \tabularnewline
44 & -0.038028 & -0.4166 & 0.338865 \tabularnewline
45 & 0.035185 & 0.3854 & 0.350301 \tabularnewline
46 & -0.014574 & -0.1597 & 0.436711 \tabularnewline
47 & 0.080545 & 0.8823 & 0.189683 \tabularnewline
48 & -0.073786 & -0.8083 & 0.210262 \tabularnewline
\hline
\end{tabular}
%Source: https://freestatistics.org/blog/index.php?pk=305196&T=2

[TABLE]
[ROW][C]Partial Autocorrelation Function[/C][/ROW]
[ROW][C]Time lag k[/C][C]PACF(k)[/C][C]T-STAT[/C][C]P-value[/C][/ROW]
[ROW][C]1[/C][C]-0.121784[/C][C]-1.3341[/C][C]0.092352[/C][/ROW]
[ROW][C]2[/C][C]0.013667[/C][C]0.1497[/C][C]0.440621[/C][/ROW]
[ROW][C]3[/C][C]0.330975[/C][C]3.6257[/C][C]0.000212[/C][/ROW]
[ROW][C]4[/C][C]-0.025128[/C][C]-0.2753[/C][C]0.391792[/C][/ROW]
[ROW][C]5[/C][C]0.009392[/C][C]0.1029[/C][C]0.459114[/C][/ROW]
[ROW][C]6[/C][C]0.23406[/C][C]2.564[/C][C]0.005791[/C][/ROW]
[ROW][C]7[/C][C]-0.111104[/C][C]-1.2171[/C][C]0.112981[/C][/ROW]
[ROW][C]8[/C][C]0.109014[/C][C]1.1942[/C][C]0.117381[/C][/ROW]
[ROW][C]9[/C][C]0.186272[/C][C]2.0405[/C][C]0.021747[/C][/ROW]
[ROW][C]10[/C][C]0.095873[/C][C]1.0502[/C][C]0.14786[/C][/ROW]
[ROW][C]11[/C][C]0.108245[/C][C]1.1858[/C][C]0.119029[/C][/ROW]
[ROW][C]12[/C][C]-0.231779[/C][C]-2.539[/C][C]0.006198[/C][/ROW]
[ROW][C]13[/C][C]-0.060442[/C][C]-0.6621[/C][C]0.254586[/C][/ROW]
[ROW][C]14[/C][C]-0.029519[/C][C]-0.3234[/C][C]0.37349[/C][/ROW]
[ROW][C]15[/C][C]0.014185[/C][C]0.1554[/C][C]0.438387[/C][/ROW]
[ROW][C]16[/C][C]-0.170987[/C][C]-1.8731[/C][C]0.031746[/C][/ROW]
[ROW][C]17[/C][C]0.003113[/C][C]0.0341[/C][C]0.486427[/C][/ROW]
[ROW][C]18[/C][C]-0.019213[/C][C]-0.2105[/C][C]0.416831[/C][/ROW]
[ROW][C]19[/C][C]-0.126555[/C][C]-1.3863[/C][C]0.084106[/C][/ROW]
[ROW][C]20[/C][C]0.090599[/C][C]0.9925[/C][C]0.161485[/C][/ROW]
[ROW][C]21[/C][C]-0.070321[/C][C]-0.7703[/C][C]0.221309[/C][/ROW]
[ROW][C]22[/C][C]-0.142531[/C][C]-1.5613[/C][C]0.060538[/C][/ROW]
[ROW][C]23[/C][C]0.05658[/C][C]0.6198[/C][C]0.268282[/C][/ROW]
[ROW][C]24[/C][C]-0.071504[/C][C]-0.7833[/C][C]0.2175[/C][/ROW]
[ROW][C]25[/C][C]-0.07071[/C][C]-0.7746[/C][C]0.220052[/C][/ROW]
[ROW][C]26[/C][C]0.175793[/C][C]1.9257[/C][C]0.028253[/C][/ROW]
[ROW][C]27[/C][C]0.168856[/C][C]1.8497[/C][C]0.033407[/C][/ROW]
[ROW][C]28[/C][C]-0.116621[/C][C]-1.2775[/C][C]0.101942[/C][/ROW]
[ROW][C]29[/C][C]-0.07291[/C][C]-0.7987[/C][C]0.213023[/C][/ROW]
[ROW][C]30[/C][C]0.020156[/C][C]0.2208[/C][C]0.412812[/C][/ROW]
[ROW][C]31[/C][C]0.060554[/C][C]0.6633[/C][C]0.254196[/C][/ROW]
[ROW][C]32[/C][C]0.04771[/C][C]0.5226[/C][C]0.301096[/C][/ROW]
[ROW][C]33[/C][C]0.019971[/C][C]0.2188[/C][C]0.413601[/C][/ROW]
[ROW][C]34[/C][C]-0.074139[/C][C]-0.8122[/C][C]0.209157[/C][/ROW]
[ROW][C]35[/C][C]0.033705[/C][C]0.3692[/C][C]0.356307[/C][/ROW]
[ROW][C]36[/C][C]-0.092419[/C][C]-1.0124[/C][C]0.156692[/C][/ROW]
[ROW][C]37[/C][C]0.01245[/C][C]0.1364[/C][C]0.445875[/C][/ROW]
[ROW][C]38[/C][C]0.018503[/C][C]0.2027[/C][C]0.41986[/C][/ROW]
[ROW][C]39[/C][C]0.012408[/C][C]0.1359[/C][C]0.446054[/C][/ROW]
[ROW][C]40[/C][C]-0.138033[/C][C]-1.5121[/C][C]0.066572[/C][/ROW]
[ROW][C]41[/C][C]0.072507[/C][C]0.7943[/C][C]0.214301[/C][/ROW]
[ROW][C]42[/C][C]0.066875[/C][C]0.7326[/C][C]0.232622[/C][/ROW]
[ROW][C]43[/C][C]-0.074091[/C][C]-0.8116[/C][C]0.209307[/C][/ROW]
[ROW][C]44[/C][C]-0.038028[/C][C]-0.4166[/C][C]0.338865[/C][/ROW]
[ROW][C]45[/C][C]0.035185[/C][C]0.3854[/C][C]0.350301[/C][/ROW]
[ROW][C]46[/C][C]-0.014574[/C][C]-0.1597[/C][C]0.436711[/C][/ROW]
[ROW][C]47[/C][C]0.080545[/C][C]0.8823[/C][C]0.189683[/C][/ROW]
[ROW][C]48[/C][C]-0.073786[/C][C]-0.8083[/C][C]0.210262[/C][/ROW]
[/TABLE]
Source: https://freestatistics.org/blog/index.php?pk=305196&T=2

Globally Unique Identifier (entire table): ba.freestatistics.org/blog/index.php?pk=305196&T=2

As an alternative you can also use a QR Code:  

The GUIDs for individual cells are displayed in the table below:

Partial Autocorrelation Function
Time lag kPACF(k)T-STATP-value
1-0.121784-1.33410.092352
20.0136670.14970.440621
30.3309753.62570.000212
4-0.025128-0.27530.391792
50.0093920.10290.459114
60.234062.5640.005791
7-0.111104-1.21710.112981
80.1090141.19420.117381
90.1862722.04050.021747
100.0958731.05020.14786
110.1082451.18580.119029
12-0.231779-2.5390.006198
13-0.060442-0.66210.254586
14-0.029519-0.32340.37349
150.0141850.15540.438387
16-0.170987-1.87310.031746
170.0031130.03410.486427
18-0.019213-0.21050.416831
19-0.126555-1.38630.084106
200.0905990.99250.161485
21-0.070321-0.77030.221309
22-0.142531-1.56130.060538
230.056580.61980.268282
24-0.071504-0.78330.2175
25-0.07071-0.77460.220052
260.1757931.92570.028253
270.1688561.84970.033407
28-0.116621-1.27750.101942
29-0.07291-0.79870.213023
300.0201560.22080.412812
310.0605540.66330.254196
320.047710.52260.301096
330.0199710.21880.413601
34-0.074139-0.81220.209157
350.0337050.36920.356307
36-0.092419-1.01240.156692
370.012450.13640.445875
380.0185030.20270.41986
390.0124080.13590.446054
40-0.138033-1.51210.066572
410.0725070.79430.214301
420.0668750.73260.232622
43-0.074091-0.81160.209307
44-0.038028-0.41660.338865
450.0351850.38540.350301
46-0.014574-0.15970.436711
470.0805450.88230.189683
48-0.073786-0.80830.210262


Parameters (Session):
par1 = 1 ; par2 = 2 ; par3 = Exact Pearson Chi-Squared by Simulation ;
Parameters (R input):
par1 = 48 ; par2 = -0.3 ; par3 = 0 ; par4 = 1 ; par5 = 12 ; par6 = White Noise ; par7 = 0.95 ; par8 = ;
R code (references can be found in the software module):
par8 <- ''
par7 <- ''
par6 <- 'White Noise'
par5 <- '12'
par4 <- '1'
par3 <- '0'
par2 <- '-0.3'
par1 <- '48'
if (par1 == 'Default') {
par1 = 10*log10(length(x))
} else {
par1 <- as.numeric(par1)
}
par2 <- as.numeric(par2)
par3 <- as.numeric(par3)
par4 <- as.numeric(par4)
par5 <- as.numeric(par5)
if (par6 == 'White Noise') par6 <- 'white' else par6 <- 'ma'
par7 <- as.numeric(par7)
if (par8 != '') par8 <- as.numeric(par8)
x <- na.omit(x)
ox <- x
if (par8 == '') {
if (par2 == 0) {
x <- log(x)
} else {
x <- (x ^ par2 - 1) / par2
}
} else {
x <- log(x,base=par8)
}
if (par3 > 0) x <- diff(x,lag=1,difference=par3)
if (par4 > 0) x <- diff(x,lag=par5,difference=par4)
bitmap(file='picts.png')
op <- par(mfrow=c(2,1))
plot(ox,type='l',main='Original Time Series',xlab='time',ylab='value')
if (par8=='') {
mytitle <- paste('Working Time Series (lambda=',par2,', d=',par3,', D=',par4,')',sep='')
mysub <- paste('(lambda=',par2,', d=',par3,', D=',par4,', CI=', par7, ', CI type=',par6,')',sep='')
} else {
mytitle <- paste('Working Time Series (base=',par8,', d=',par3,', D=',par4,')',sep='')
mysub <- paste('(base=',par8,', d=',par3,', D=',par4,', CI=', par7, ', CI type=',par6,')',sep='')
}
plot(x,type='l', main=mytitle,xlab='time',ylab='value')
par(op)
dev.off()
bitmap(file='pic1.png')
racf <- acf(x, par1, main='Autocorrelation', xlab='time lag', ylab='ACF', ci.type=par6, ci=par7, sub=mysub)
dev.off()
bitmap(file='pic2.png')
rpacf <- pacf(x,par1,main='Partial Autocorrelation',xlab='lags',ylab='PACF',sub=mysub)
dev.off()
(myacf <- c(racf$acf))
(mypacf <- c(rpacf$acf))
lengthx <- length(x)
sqrtn <- sqrt(lengthx)
load(file='createtable')
a<-table.start()
a<-table.row.start(a)
a<-table.element(a,'Autocorrelation Function',4,TRUE)
a<-table.row.end(a)
a<-table.row.start(a)
a<-table.element(a,'Time lag k',header=TRUE)
a<-table.element(a,'ACF(k)',header=TRUE)
a<-table.element(a,'T-STAT',header=TRUE)
a<-table.element(a,'P-value',header=TRUE)
a<-table.row.end(a)
for (i in 2:(par1+1)) {
a<-table.row.start(a)
a<-table.element(a,i-1,header=TRUE)
a<-table.element(a,round(myacf[i],6))
mytstat <- myacf[i]*sqrtn
a<-table.element(a,round(mytstat,4))
a<-table.element(a,round(1-pt(abs(mytstat),lengthx),6))
a<-table.row.end(a)
}
a<-table.end(a)
table.save(a,file='mytable.tab')
a<-table.start()
a<-table.row.start(a)
a<-table.element(a,'Partial Autocorrelation Function',4,TRUE)
a<-table.row.end(a)
a<-table.row.start(a)
a<-table.element(a,'Time lag k',header=TRUE)
a<-table.element(a,'PACF(k)',header=TRUE)
a<-table.element(a,'T-STAT',header=TRUE)
a<-table.element(a,'P-value',header=TRUE)
a<-table.row.end(a)
for (i in 1:par1) {
a<-table.row.start(a)
a<-table.element(a,i,header=TRUE)
a<-table.element(a,round(mypacf[i],6))
mytstat <- mypacf[i]*sqrtn
a<-table.element(a,round(mytstat,4))
a<-table.element(a,round(1-pt(abs(mytstat),lengthx),6))
a<-table.row.end(a)
}
a<-table.end(a)
table.save(a,file='mytable1.tab')