Free Statistics

of Irreproducible Research!

Author's title

Author*The author of this computation has been verified*
R Software Modulerwasp_exponentialsmoothing.wasp
Title produced by softwareExponential Smoothing
Date of computationWed, 25 Jan 2017 08:18:41 +0100
Cite this page as followsStatistical Computations at FreeStatistics.org, Office for Research Development and Education, URL https://freestatistics.org/blog/index.php?v=date/2017/Jan/25/t1485328759q830kmgqouh3jen.htm/, Retrieved Tue, 14 May 2024 07:04:20 +0000
Statistical Computations at FreeStatistics.org, Office for Research Development and Education, URL https://freestatistics.org/blog/index.php?pk=305272, Retrieved Tue, 14 May 2024 07:04:20 +0000
QR Codes:

Original text written by user:
IsPrivate?No (this computation is public)
User-defined keywords
Estimated Impact97
Family? (F = Feedback message, R = changed R code, M = changed R Module, P = changed Parameters, D = changed Data)
-       [Exponential Smoothing] [] [2017-01-25 07:18:41] [7a1d1ad32a278442444f0033012c5937] [Current]
Feedback Forum

Post a new message
Dataseries X:
6
7
2
11
13
3
17
10
4
12
7
11
3
5
1
12
18
8
6
1


Summary of computational transaction
Raw Input view raw input (R code)
Raw Outputview raw output of R engine
Computing time1 seconds
R ServerBig Analytics Cloud Computing Center

\begin{tabular}{lllllllll}
\hline
Summary of computational transaction \tabularnewline
Raw Input view raw input (R code)  \tabularnewline
Raw Outputview raw output of R engine  \tabularnewline
Computing time1 seconds \tabularnewline
R ServerBig Analytics Cloud Computing Center \tabularnewline
\hline
\end{tabular}
%Source: https://freestatistics.org/blog/index.php?pk=305272&T=0

[TABLE]
[ROW]
Summary of computational transaction[/C][/ROW] [ROW]Raw Input[/C] view raw input (R code) [/C][/ROW] [ROW]Raw Output[/C]view raw output of R engine [/C][/ROW] [ROW]Computing time[/C]1 seconds[/C][/ROW] [ROW]R Server[/C]Big Analytics Cloud Computing Center[/C][/ROW] [/TABLE] Source: https://freestatistics.org/blog/index.php?pk=305272&T=0

Globally Unique Identifier (entire table): ba.freestatistics.org/blog/index.php?pk=305272&T=0

As an alternative you can also use a QR Code:  

The GUIDs for individual cells are displayed in the table below:

Summary of computational transaction
Raw Input view raw input (R code)
Raw Outputview raw output of R engine
Computing time1 seconds
R ServerBig Analytics Cloud Computing Center


Estimated Parameters of Exponential Smoothing
ParameterValue
alpha0.0443446079803638
betaFALSE
gammaFALSE

\begin{tabular}{lllllllll}
\hline
Estimated Parameters of Exponential Smoothing \tabularnewline
Parameter & Value \tabularnewline
alpha & 0.0443446079803638 \tabularnewline
beta & FALSE \tabularnewline
gamma & FALSE \tabularnewline
\hline
\end{tabular}
%Source: https://freestatistics.org/blog/index.php?pk=305272&T=1

[TABLE]
[ROW][C]Estimated Parameters of Exponential Smoothing[/C][/ROW]
[ROW][C]Parameter[/C][C]Value[/C][/ROW]
[ROW][C]alpha[/C][C]0.0443446079803638[/C][/ROW]
[ROW][C]beta[/C][C]FALSE[/C][/ROW]
[ROW][C]gamma[/C][C]FALSE[/C][/ROW]
[/TABLE]
Source: https://freestatistics.org/blog/index.php?pk=305272&T=1

Globally Unique Identifier (entire table): ba.freestatistics.org/blog/index.php?pk=305272&T=1

As an alternative you can also use a QR Code:  

The GUIDs for individual cells are displayed in the table below:

Estimated Parameters of Exponential Smoothing
ParameterValue
alpha0.0443446079803638
betaFALSE
gammaFALSE


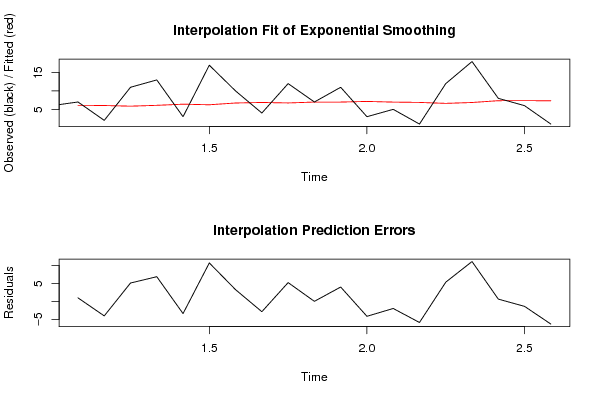
Interpolation Forecasts of Exponential Smoothing
tObservedFittedResiduals
2761
326.04434460798036-4.04434460798036
4115.864999731801985.13500026819802
5136.092709305674286.90729069432572
636.39901040372057-3.39901040372057
7176.248282619846410.7517173801536
8106.725063312184983.27493668781502
946.87028909576664-2.87028909576664
10126.743007251024565.25699274897544
1176.976126533633490.023873466366509
12116.977185193140654.02281480685935
1337.15557533872843-4.15557533872843
1456.97129797939965-1.97129797939965
1516.88388154329069-5.88388154329069
16126.622963122850565.37703687714944
17186.8614057152637111.1385942847363
1887.355342312272660.644657687727335
1967.38392940471646-1.38392940471646
2017.32255959779181-6.32255959779181

\begin{tabular}{lllllllll}
\hline
Interpolation Forecasts of Exponential Smoothing \tabularnewline
t & Observed & Fitted & Residuals \tabularnewline
2 & 7 & 6 & 1 \tabularnewline
3 & 2 & 6.04434460798036 & -4.04434460798036 \tabularnewline
4 & 11 & 5.86499973180198 & 5.13500026819802 \tabularnewline
5 & 13 & 6.09270930567428 & 6.90729069432572 \tabularnewline
6 & 3 & 6.39901040372057 & -3.39901040372057 \tabularnewline
7 & 17 & 6.2482826198464 & 10.7517173801536 \tabularnewline
8 & 10 & 6.72506331218498 & 3.27493668781502 \tabularnewline
9 & 4 & 6.87028909576664 & -2.87028909576664 \tabularnewline
10 & 12 & 6.74300725102456 & 5.25699274897544 \tabularnewline
11 & 7 & 6.97612653363349 & 0.023873466366509 \tabularnewline
12 & 11 & 6.97718519314065 & 4.02281480685935 \tabularnewline
13 & 3 & 7.15557533872843 & -4.15557533872843 \tabularnewline
14 & 5 & 6.97129797939965 & -1.97129797939965 \tabularnewline
15 & 1 & 6.88388154329069 & -5.88388154329069 \tabularnewline
16 & 12 & 6.62296312285056 & 5.37703687714944 \tabularnewline
17 & 18 & 6.86140571526371 & 11.1385942847363 \tabularnewline
18 & 8 & 7.35534231227266 & 0.644657687727335 \tabularnewline
19 & 6 & 7.38392940471646 & -1.38392940471646 \tabularnewline
20 & 1 & 7.32255959779181 & -6.32255959779181 \tabularnewline
\hline
\end{tabular}
%Source: https://freestatistics.org/blog/index.php?pk=305272&T=2

[TABLE]
[ROW][C]Interpolation Forecasts of Exponential Smoothing[/C][/ROW]
[ROW][C]t[/C][C]Observed[/C][C]Fitted[/C][C]Residuals[/C][/ROW]
[ROW][C]2[/C][C]7[/C][C]6[/C][C]1[/C][/ROW]
[ROW][C]3[/C][C]2[/C][C]6.04434460798036[/C][C]-4.04434460798036[/C][/ROW]
[ROW][C]4[/C][C]11[/C][C]5.86499973180198[/C][C]5.13500026819802[/C][/ROW]
[ROW][C]5[/C][C]13[/C][C]6.09270930567428[/C][C]6.90729069432572[/C][/ROW]
[ROW][C]6[/C][C]3[/C][C]6.39901040372057[/C][C]-3.39901040372057[/C][/ROW]
[ROW][C]7[/C][C]17[/C][C]6.2482826198464[/C][C]10.7517173801536[/C][/ROW]
[ROW][C]8[/C][C]10[/C][C]6.72506331218498[/C][C]3.27493668781502[/C][/ROW]
[ROW][C]9[/C][C]4[/C][C]6.87028909576664[/C][C]-2.87028909576664[/C][/ROW]
[ROW][C]10[/C][C]12[/C][C]6.74300725102456[/C][C]5.25699274897544[/C][/ROW]
[ROW][C]11[/C][C]7[/C][C]6.97612653363349[/C][C]0.023873466366509[/C][/ROW]
[ROW][C]12[/C][C]11[/C][C]6.97718519314065[/C][C]4.02281480685935[/C][/ROW]
[ROW][C]13[/C][C]3[/C][C]7.15557533872843[/C][C]-4.15557533872843[/C][/ROW]
[ROW][C]14[/C][C]5[/C][C]6.97129797939965[/C][C]-1.97129797939965[/C][/ROW]
[ROW][C]15[/C][C]1[/C][C]6.88388154329069[/C][C]-5.88388154329069[/C][/ROW]
[ROW][C]16[/C][C]12[/C][C]6.62296312285056[/C][C]5.37703687714944[/C][/ROW]
[ROW][C]17[/C][C]18[/C][C]6.86140571526371[/C][C]11.1385942847363[/C][/ROW]
[ROW][C]18[/C][C]8[/C][C]7.35534231227266[/C][C]0.644657687727335[/C][/ROW]
[ROW][C]19[/C][C]6[/C][C]7.38392940471646[/C][C]-1.38392940471646[/C][/ROW]
[ROW][C]20[/C][C]1[/C][C]7.32255959779181[/C][C]-6.32255959779181[/C][/ROW]
[/TABLE]
Source: https://freestatistics.org/blog/index.php?pk=305272&T=2

Globally Unique Identifier (entire table): ba.freestatistics.org/blog/index.php?pk=305272&T=2

As an alternative you can also use a QR Code:  

The GUIDs for individual cells are displayed in the table below:

Interpolation Forecasts of Exponential Smoothing
tObservedFittedResiduals
2761
326.04434460798036-4.04434460798036
4115.864999731801985.13500026819802
5136.092709305674286.90729069432572
636.39901040372057-3.39901040372057
7176.248282619846410.7517173801536
8106.725063312184983.27493668781502
946.87028909576664-2.87028909576664
10126.743007251024565.25699274897544
1176.976126533633490.023873466366509
12116.977185193140654.02281480685935
1337.15557533872843-4.15557533872843
1456.97129797939965-1.97129797939965
1516.88388154329069-5.88388154329069
16126.622963122850565.37703687714944
17186.8614057152637111.1385942847363
1887.355342312272660.644657687727335
1967.38392940471646-1.38392940471646
2017.32255959779181-6.32255959779181


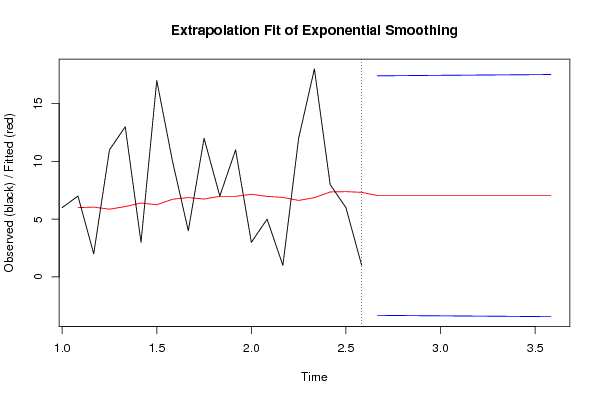
Extrapolation Forecasts of Exponential Smoothing
tForecast95% Lower Bound95% Upper Bound
217.04218817099525-3.3224016611675317.406778003158
227.04218817099525-3.3325873503047917.4169636922953
237.04218817099525-3.3427630491964417.4271393911869
247.04218817099525-3.352928787180617.4373051291711
257.04218817099525-3.3630845934520817.4474609354426
267.04218817099525-3.3732304970633617.4576068390538
277.04218817099525-3.3833665269255317.467742868916
287.04218817099525-3.393492711809317.4778690537998
297.04218817099525-3.4036090803459217.4879854223364
307.04218817099525-3.4137156610281217.4980920030186
317.04218817099525-3.4238124822110817.5081888242016
327.04218817099525-3.4338995721133217.5182759141038

\begin{tabular}{lllllllll}
\hline
Extrapolation Forecasts of Exponential Smoothing \tabularnewline
t & Forecast & 95% Lower Bound & 95% Upper Bound \tabularnewline
21 & 7.04218817099525 & -3.32240166116753 & 17.406778003158 \tabularnewline
22 & 7.04218817099525 & -3.33258735030479 & 17.4169636922953 \tabularnewline
23 & 7.04218817099525 & -3.34276304919644 & 17.4271393911869 \tabularnewline
24 & 7.04218817099525 & -3.3529287871806 & 17.4373051291711 \tabularnewline
25 & 7.04218817099525 & -3.36308459345208 & 17.4474609354426 \tabularnewline
26 & 7.04218817099525 & -3.37323049706336 & 17.4576068390538 \tabularnewline
27 & 7.04218817099525 & -3.38336652692553 & 17.467742868916 \tabularnewline
28 & 7.04218817099525 & -3.3934927118093 & 17.4778690537998 \tabularnewline
29 & 7.04218817099525 & -3.40360908034592 & 17.4879854223364 \tabularnewline
30 & 7.04218817099525 & -3.41371566102812 & 17.4980920030186 \tabularnewline
31 & 7.04218817099525 & -3.42381248221108 & 17.5081888242016 \tabularnewline
32 & 7.04218817099525 & -3.43389957211332 & 17.5182759141038 \tabularnewline
\hline
\end{tabular}
%Source: https://freestatistics.org/blog/index.php?pk=305272&T=3

[TABLE]
[ROW][C]Extrapolation Forecasts of Exponential Smoothing[/C][/ROW]
[ROW][C]t[/C][C]Forecast[/C][C]95% Lower Bound[/C][C]95% Upper Bound[/C][/ROW]
[ROW][C]21[/C][C]7.04218817099525[/C][C]-3.32240166116753[/C][C]17.406778003158[/C][/ROW]
[ROW][C]22[/C][C]7.04218817099525[/C][C]-3.33258735030479[/C][C]17.4169636922953[/C][/ROW]
[ROW][C]23[/C][C]7.04218817099525[/C][C]-3.34276304919644[/C][C]17.4271393911869[/C][/ROW]
[ROW][C]24[/C][C]7.04218817099525[/C][C]-3.3529287871806[/C][C]17.4373051291711[/C][/ROW]
[ROW][C]25[/C][C]7.04218817099525[/C][C]-3.36308459345208[/C][C]17.4474609354426[/C][/ROW]
[ROW][C]26[/C][C]7.04218817099525[/C][C]-3.37323049706336[/C][C]17.4576068390538[/C][/ROW]
[ROW][C]27[/C][C]7.04218817099525[/C][C]-3.38336652692553[/C][C]17.467742868916[/C][/ROW]
[ROW][C]28[/C][C]7.04218817099525[/C][C]-3.3934927118093[/C][C]17.4778690537998[/C][/ROW]
[ROW][C]29[/C][C]7.04218817099525[/C][C]-3.40360908034592[/C][C]17.4879854223364[/C][/ROW]
[ROW][C]30[/C][C]7.04218817099525[/C][C]-3.41371566102812[/C][C]17.4980920030186[/C][/ROW]
[ROW][C]31[/C][C]7.04218817099525[/C][C]-3.42381248221108[/C][C]17.5081888242016[/C][/ROW]
[ROW][C]32[/C][C]7.04218817099525[/C][C]-3.43389957211332[/C][C]17.5182759141038[/C][/ROW]
[/TABLE]
Source: https://freestatistics.org/blog/index.php?pk=305272&T=3

Globally Unique Identifier (entire table): ba.freestatistics.org/blog/index.php?pk=305272&T=3

As an alternative you can also use a QR Code:  

The GUIDs for individual cells are displayed in the table below:

Extrapolation Forecasts of Exponential Smoothing
tForecast95% Lower Bound95% Upper Bound
217.04218817099525-3.3224016611675317.406778003158
227.04218817099525-3.3325873503047917.4169636922953
237.04218817099525-3.3427630491964417.4271393911869
247.04218817099525-3.352928787180617.4373051291711
257.04218817099525-3.3630845934520817.4474609354426
267.04218817099525-3.3732304970633617.4576068390538
277.04218817099525-3.3833665269255317.467742868916
287.04218817099525-3.393492711809317.4778690537998
297.04218817099525-3.4036090803459217.4879854223364
307.04218817099525-3.4137156610281217.4980920030186
317.04218817099525-3.4238124822110817.5081888242016
327.04218817099525-3.4338995721133217.5182759141038


Parameters (Session):
par1 = 12 ; par2 = Single ; par3 = additive ; par4 = 12 ;
Parameters (R input):
par1 = 12 ; par2 = Single ; par3 = additive ; par4 = 12 ;
R code (references can be found in the software module):
par1 <- as.numeric(par1)
par4 <- as.numeric(par4)
if (par2 == 'Single') K <- 1
if (par2 == 'Double') K <- 2
if (par2 == 'Triple') K <- par1
nx <- length(x)
nxmK <- nx - K
x <- ts(x, frequency = par1)
if (par2 == 'Single') fit <- HoltWinters(x, gamma=F, beta=F)
if (par2 == 'Double') fit <- HoltWinters(x, gamma=F)
if (par2 == 'Triple') fit <- HoltWinters(x, seasonal=par3)
fit
myresid <- x - fit$fitted[,'xhat']
bitmap(file='test1.png')
op <- par(mfrow=c(2,1))
plot(fit,ylab='Observed (black) / Fitted (red)',main='Interpolation Fit of Exponential Smoothing')
plot(myresid,ylab='Residuals',main='Interpolation Prediction Errors')
par(op)
dev.off()
bitmap(file='test2.png')
p <- predict(fit, par4, prediction.interval=TRUE)
np <- length(p[,1])
plot(fit,p,ylab='Observed (black) / Fitted (red)',main='Extrapolation Fit of Exponential Smoothing')
dev.off()
bitmap(file='test3.png')
op <- par(mfrow = c(2,2))
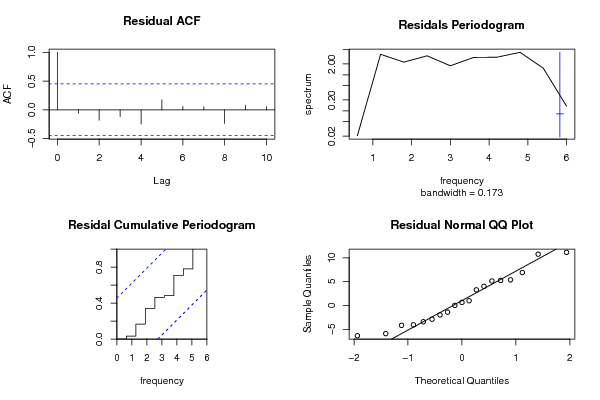
acf(as.numeric(myresid),lag.max = nx/2,main='Residual ACF')
spectrum(myresid,main='Residals Periodogram')
cpgram(myresid,main='Residal Cumulative Periodogram')
qqnorm(myresid,main='Residual Normal QQ Plot')
qqline(myresid)
par(op)
dev.off()
load(file='createtable')
a<-table.start()
a<-table.row.start(a)
a<-table.element(a,'Estimated Parameters of Exponential Smoothing',2,TRUE)
a<-table.row.end(a)
a<-table.row.start(a)
a<-table.element(a,'Parameter',header=TRUE)
a<-table.element(a,'Value',header=TRUE)
a<-table.row.end(a)
a<-table.row.start(a)
a<-table.element(a,'alpha',header=TRUE)
a<-table.element(a,fit$alpha)
a<-table.row.end(a)
a<-table.row.start(a)
a<-table.element(a,'beta',header=TRUE)
a<-table.element(a,fit$beta)
a<-table.row.end(a)
a<-table.row.start(a)
a<-table.element(a,'gamma',header=TRUE)
a<-table.element(a,fit$gamma)
a<-table.row.end(a)
a<-table.end(a)
table.save(a,file='mytable.tab')
a<-table.start()
a<-table.row.start(a)
a<-table.element(a,'Interpolation Forecasts of Exponential Smoothing',4,TRUE)
a<-table.row.end(a)
a<-table.row.start(a)
a<-table.element(a,'t',header=TRUE)
a<-table.element(a,'Observed',header=TRUE)
a<-table.element(a,'Fitted',header=TRUE)
a<-table.element(a,'Residuals',header=TRUE)
a<-table.row.end(a)
for (i in 1:nxmK) {
a<-table.row.start(a)
a<-table.element(a,i+K,header=TRUE)
a<-table.element(a,x[i+K])
a<-table.element(a,fit$fitted[i,'xhat'])
a<-table.element(a,myresid[i])
a<-table.row.end(a)
}
a<-table.end(a)
table.save(a,file='mytable1.tab')
a<-table.start()
a<-table.row.start(a)
a<-table.element(a,'Extrapolation Forecasts of Exponential Smoothing',4,TRUE)
a<-table.row.end(a)
a<-table.row.start(a)
a<-table.element(a,'t',header=TRUE)
a<-table.element(a,'Forecast',header=TRUE)
a<-table.element(a,'95% Lower Bound',header=TRUE)
a<-table.element(a,'95% Upper Bound',header=TRUE)
a<-table.row.end(a)
for (i in 1:np) {
a<-table.row.start(a)
a<-table.element(a,nx+i,header=TRUE)
a<-table.element(a,p[i,'fit'])
a<-table.element(a,p[i,'lwr'])
a<-table.element(a,p[i,'upr'])
a<-table.row.end(a)
}
a<-table.end(a)
table.save(a,file='mytable2.tab')