Free Statistics

of Irreproducible Research!

Author's title

Author*Unverified author*
R Software Modulerwasp_harrell_davis.wasp
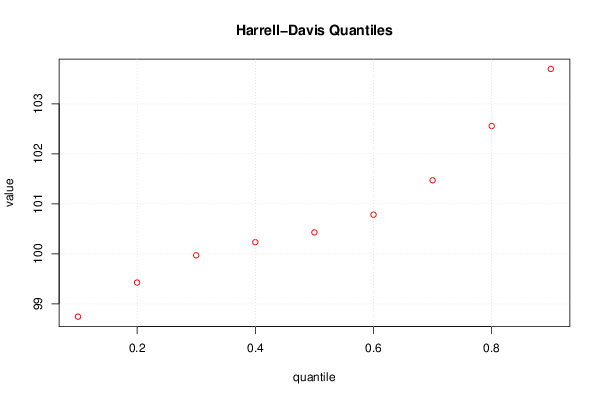
Title produced by softwareHarrell-Davis Quantiles
Date of computationWed, 08 Mar 2017 20:23:56 +0000
Cite this page as followsStatistical Computations at FreeStatistics.org, Office for Research Development and Education, URL https://freestatistics.org/blog/index.php?v=date/2017/Mar/08/t1489004809b08vgnfbouhvwlr.htm/, Retrieved Wed, 15 May 2024 12:32:49 +0200
Statistical Computations at FreeStatistics.org, Office for Research Development and Education, URL https://freestatistics.org/blog/index.php?pk=, Retrieved Wed, 15 May 2024 12:32:49 +0200
QR Codes:

Original text written by user:
IsPrivate?No (this computation is public)
User-defined keywords
Estimated Impact0
Dataseries X:
97.91	
98.51	
98.54	
98.52	
98.66	
98.53	
98.71	
98.92	
98.96	
99.25	
99.32	
99.41	
99.36	
99.58	
99.77	
99.77	
100.03	
100.2	
100.24	
100.1	
100.03	
100.18	
100.29	
100.41	
100.6	
100.75	
100.79	
100.44	
100.29	
100.34	
100.46	
100.12	
100.06	
100.28	
100.28	
100.4	
100.61	
100.89	
100.73	
101.12	
101.16	
101.33	
101.37	
101.61	
101.85	
102.27	
102.28	
102.23	
102.42	
102.53	
103.47	
103.53	
103.77	
103.74	
103.93	
103.97	
103.68	
103.86	
103.97	
104.05	


Summary of computational transaction
Raw Inputview raw input (R code)
Raw Outputview raw output of R engine
Computing time1 seconds
R Server'Sir Ronald Aylmer Fisher' @ fisher.wessa.net

\begin{tabular}{lllllllll}
\hline
Summary of computational transaction \tabularnewline
Raw Input & view raw input (R code)  \tabularnewline
Raw Output & view raw output of R engine  \tabularnewline
Computing time & 1 seconds \tabularnewline
R Server & 'Sir Ronald Aylmer Fisher' @ fisher.wessa.net \tabularnewline
\hline
\end{tabular}
%Source: https://freestatistics.org/blog/index.php?pk=&T=0

[TABLE]
[ROW][C]Summary of computational transaction[/C][/ROW]
[ROW][C]Raw Input[/C][C]view raw input (R code) [/C][/ROW]
[ROW][C]Raw Output[/C][C]view raw output of R engine [/C][/ROW]
[ROW][C]Computing time[/C][C]1 seconds[/C][/ROW]
[ROW][C]R Server[/C][C]'Sir Ronald Aylmer Fisher' @ fisher.wessa.net[/C][/ROW]
[/TABLE]
Source: https://freestatistics.org/blog/index.php?pk=&T=0

Globally Unique Identifier (entire table): ba.freestatistics.org/blog/index.php?pk=&T=0

As an alternative you can also use a QR Code:  

The GUIDs for individual cells are displayed in the table below:

Summary of computational transaction
Raw Inputview raw input (R code)
Raw Outputview raw output of R engine
Computing time1 seconds
R Server'Sir Ronald Aylmer Fisher' @ fisher.wessa.net


Harrell-Davis Quantiles
quantilesvaluestandard error
0.198.74335860907980.222596550410351
0.299.42479554168140.305601224220376
0.399.96966185845540.207906207074301
0.4100.2321974424060.103900624633309
0.5100.4279998862420.145578530404966
0.6100.7820106382290.280352115664249
0.7101.4699529052640.485177111805688
0.8102.5558416036620.605924934691647
0.9103.696441952520.261036504660318

\begin{tabular}{lllllllll}
\hline
Harrell-Davis Quantiles \tabularnewline
quantiles & value & standard error \tabularnewline
0.1 & 98.7433586090798 & 0.222596550410351 \tabularnewline
0.2 & 99.4247955416814 & 0.305601224220376 \tabularnewline
0.3 & 99.9696618584554 & 0.207906207074301 \tabularnewline
0.4 & 100.232197442406 & 0.103900624633309 \tabularnewline
0.5 & 100.427999886242 & 0.145578530404966 \tabularnewline
0.6 & 100.782010638229 & 0.280352115664249 \tabularnewline
0.7 & 101.469952905264 & 0.485177111805688 \tabularnewline
0.8 & 102.555841603662 & 0.605924934691647 \tabularnewline
0.9 & 103.69644195252 & 0.261036504660318 \tabularnewline
\hline
\end{tabular}
%Source: https://freestatistics.org/blog/index.php?pk=&T=1

[TABLE]
[ROW][C]Harrell-Davis Quantiles[/C][/ROW]
[ROW][C]quantiles[/C][C]value[/C][C]standard error[/C][/ROW]
[ROW][C]0.1[/C][C]98.7433586090798[/C][C]0.222596550410351[/C][/ROW]
[ROW][C]0.2[/C][C]99.4247955416814[/C][C]0.305601224220376[/C][/ROW]
[ROW][C]0.3[/C][C]99.9696618584554[/C][C]0.207906207074301[/C][/ROW]
[ROW][C]0.4[/C][C]100.232197442406[/C][C]0.103900624633309[/C][/ROW]
[ROW][C]0.5[/C][C]100.427999886242[/C][C]0.145578530404966[/C][/ROW]
[ROW][C]0.6[/C][C]100.782010638229[/C][C]0.280352115664249[/C][/ROW]
[ROW][C]0.7[/C][C]101.469952905264[/C][C]0.485177111805688[/C][/ROW]
[ROW][C]0.8[/C][C]102.555841603662[/C][C]0.605924934691647[/C][/ROW]
[ROW][C]0.9[/C][C]103.69644195252[/C][C]0.261036504660318[/C][/ROW]
[/TABLE]
Source: https://freestatistics.org/blog/index.php?pk=&T=1

Globally Unique Identifier (entire table): ba.freestatistics.org/blog/index.php?pk=&T=1

As an alternative you can also use a QR Code:  

The GUIDs for individual cells are displayed in the table below:

Harrell-Davis Quantiles
quantilesvaluestandard error
0.198.74335860907980.222596550410351
0.299.42479554168140.305601224220376
0.399.96966185845540.207906207074301
0.4100.2321974424060.103900624633309
0.5100.4279998862420.145578530404966
0.6100.7820106382290.280352115664249
0.7101.4699529052640.485177111805688
0.8102.5558416036620.605924934691647
0.9103.696441952520.261036504660318


Parameters (Session):
par1 = 0.1 ; par2 = 0.9 ; par3 = 0.1 ;
Parameters (R input):
par1 = 0.1 ; par2 = 0.9 ; par3 = 0.1 ;
R code (references can be found in the software module):
par3 <- '0.01'
par2 <- '0.99'
par1 <- '0.01'
par1 <- as(par1,'numeric')
par2 <- as(par2,'numeric')
par3 <- as(par3,'numeric')
library(Hmisc)
myseq <- seq(par1, par2, par3)
hd <- hdquantile(x, probs = myseq, se = TRUE, na.rm = FALSE, names = TRUE, weights=FALSE)
bitmap(file='test1.png')
plot(myseq,hd,col=2,main=main,xlab=xlab,ylab=ylab)
grid()
dev.off()
load(file='createtable')
a<-table.start()
a<-table.row.start(a)
a<-table.element(a,'Harrell-Davis Quantiles',3,TRUE)
a<-table.row.end(a)
a<-table.row.start(a)
a<-table.element(a,'quantiles',header=TRUE)
a<-table.element(a,'value',header=TRUE)
a<-table.element(a,'standard error',header=TRUE)
a<-table.row.end(a)
length(hd)
for (i in 1:length(hd))
{
a<-table.row.start(a)
a<-table.element(a,as(labels(hd)[i],'numeric'),header=TRUE)
a<-table.element(a,as.matrix(hd[i])[1,1])
a<-table.element(a,as.matrix(attr(hd,'se')[i])[1,1])
a<-table.row.end(a)
}
a<-table.end(a)
table.save(a,file='mytable.tab')