Free Statistics

of Irreproducible Research!

Author's title

Author*Unverified author*
R Software Modulerwasp_centraltendency.wasp
Title produced by softwareCentral Tendency
Date of computationThu, 09 Mar 2017 15:51:59 +0000
Cite this page as followsStatistical Computations at FreeStatistics.org, Office for Research Development and Education, URL https://freestatistics.org/blog/index.php?v=date/2017/Mar/09/t1489074810gd9f9u9724paxxx.htm/, Retrieved Thu, 16 May 2024 00:10:30 +0200
Statistical Computations at FreeStatistics.org, Office for Research Development and Education, URL https://freestatistics.org/blog/index.php?pk=, Retrieved Thu, 16 May 2024 00:10:30 +0200
QR Codes:

Original text written by user:
IsPrivate?No (this computation is public)
User-defined keywords
Estimated Impact0
Dataseries X:
70,3
90,2
107,3
104,6
102,7
124,5
117,8
104,2
99,9
91,5
95,7
91,4
86,2
91,5
115,5
113,9
131,9
121,2
105,2
107,5
113,8
100,5
104,8
103,8
93,1
106,2
117,5
109,9
123,6
139,3
111
122
110,9
108
103,7
107,3
92
83,4
110,7
109
121,3
121,4
129,9
109,7
113,1
109,4
101
109
92,8
91,1
114,5
118,6
120,2
135,9
122,8
106
118,1
108,9
97,3
113,9
88,3
88,3
114,6
118,8
111,9
130,1
124,3
112,2
110
105,8
105,1
106,7


Summary of computational transaction
Raw Inputview raw input (R code)
Raw Outputview raw output of R engine
Computing time1 seconds
R Server'Sir Ronald Aylmer Fisher' @ fisher.wessa.net

\begin{tabular}{lllllllll}
\hline
Summary of computational transaction \tabularnewline
Raw Input & view raw input (R code)  \tabularnewline
Raw Output & view raw output of R engine  \tabularnewline
Computing time & 1 seconds \tabularnewline
R Server & 'Sir Ronald Aylmer Fisher' @ fisher.wessa.net \tabularnewline
\hline
\end{tabular}
%Source: https://freestatistics.org/blog/index.php?pk=&T=0

[TABLE]
[ROW][C]Summary of computational transaction[/C][/ROW]
[ROW][C]Raw Input[/C][C]view raw input (R code) [/C][/ROW]
[ROW][C]Raw Output[/C][C]view raw output of R engine [/C][/ROW]
[ROW][C]Computing time[/C][C]1 seconds[/C][/ROW]
[ROW][C]R Server[/C][C]'Sir Ronald Aylmer Fisher' @ fisher.wessa.net[/C][/ROW]
[/TABLE]
Source: https://freestatistics.org/blog/index.php?pk=&T=0

Globally Unique Identifier (entire table): ba.freestatistics.org/blog/index.php?pk=&T=0

As an alternative you can also use a QR Code:  

The GUIDs for individual cells are displayed in the table below:

Summary of computational transaction
Raw Inputview raw input (R code)
Raw Outputview raw output of R engine
Computing time1 seconds
R Server'Sir Ronald Aylmer Fisher' @ fisher.wessa.net


Central Tendency - Ungrouped Data
MeasureValueS.E.Value/S.E.
Arithmetic Mean108.5347222222221.5316077243000170.863263811121
Geometric Mean107.738645400597
Harmonic Mean106.906874456237
Quadratic Mean109.299310636232
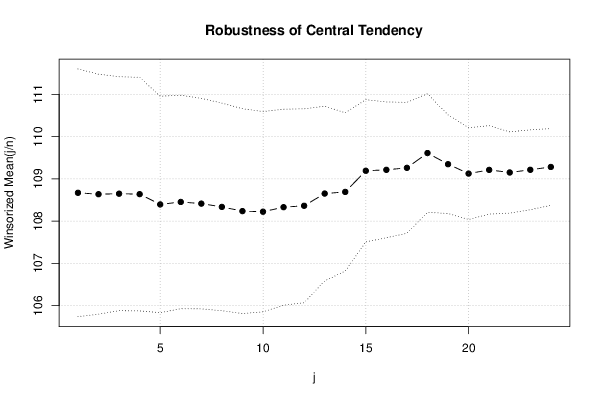
Winsorized Mean ( 1 / 24 )108.6694444444441.4644157381638274.2066898165827
Winsorized Mean ( 2 / 24 )108.6361111111111.4188843530527376.5644577568149
Winsorized Mean ( 3 / 24 )108.6486111111111.3832102907204978.5481512391856
Winsorized Mean ( 4 / 24 )108.63751.3807918810237578.6776787240768
Winsorized Mean ( 5 / 24 )108.3944444444441.2796925505065484.7035050735729
Winsorized Mean ( 6 / 24 )108.4527777777781.261967705265285.9394240639354
Winsorized Mean ( 7 / 24 )108.4138888888891.2444671062518587.116717142822
Winsorized Mean ( 8 / 24 )108.3361111111111.2273062120625388.2714599228245
Winsorized Mean ( 9 / 24 )108.2361111111111.2110008689829489.3774016875916
Winsorized Mean ( 10 / 24 )108.2222222222221.1843416688873491.3775349337279
Winsorized Mean ( 11 / 24 )108.3291666666671.1586114225242993.4991357418589
Winsorized Mean ( 12 / 24 )108.36251.146576583527594.5096049900285
Winsorized Mean ( 13 / 24 )108.6513888888891.032509502462105.230400911384
Winsorized Mean ( 14 / 24 )108.6902777777780.936148420031751116.103681266793
Winsorized Mean ( 15 / 24 )109.1902777777780.840918902066186129.846382938344
Winsorized Mean ( 16 / 24 )109.21250.80293363105813136.016845945382
Winsorized Mean ( 17 / 24 )109.2597222222220.774012217501278141.160203614024
Winsorized Mean ( 18 / 24 )109.6097222222220.700668023863232156.436027461156
Winsorized Mean ( 19 / 24 )109.3458333333330.582984260075765187.562239363242
Winsorized Mean ( 20 / 24 )109.1236111111110.542794935641339201.040216011183
Winsorized Mean ( 21 / 24 )109.2111111111110.522706464795892208.933920788135
Winsorized Mean ( 22 / 24 )109.150.480459319879913227.178442552184
Winsorized Mean ( 23 / 24 )109.2138888888890.471990530475964231.390000089103
Winsorized Mean ( 24 / 24 )109.2805555555560.454255822703949240.570511358699
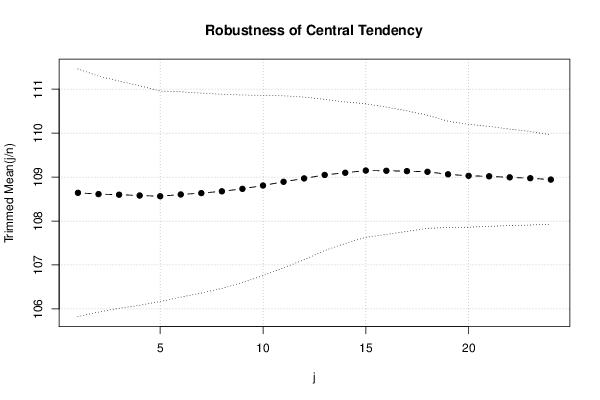
Trimmed Mean ( 1 / 24 )108.6414285714291.4085401938423177.130513595831
Trimmed Mean ( 2 / 24 )108.6117647058821.3417741609845880.946382680513
Trimmed Mean ( 3 / 24 )108.5984848484851.291697519609184.0742381245336
Trimmed Mean ( 4 / 24 )108.57968751.2483544320954886.9782528970866
Trimmed Mean ( 5 / 24 )108.5629032258061.1968565249681890.7066978881977
Trimmed Mean ( 6 / 24 )108.6033333333331.1676306751695993.0117164980782
Trimmed Mean ( 7 / 24 )108.6344827586211.1369463557595995.5493477843489
Trimmed Mean ( 8 / 24 )108.6751.1037723097126198.4578060563013
Trimmed Mean ( 9 / 24 )108.7314814814811.06689863854077101.913600368069
Trimmed Mean ( 10 / 24 )108.8076923076921.02466875107309106.188162948995
Trimmed Mean ( 11 / 24 )108.8920.977927170611599111.349805253799
Trimmed Mean ( 12 / 24 )108.968750.924892921969851117.817692633993
Trimmed Mean ( 13 / 24 )109.0478260869570.859202748819555126.917454857745
Trimmed Mean ( 14 / 24 )109.0977272727270.80481169672912135.55683610976
Trimmed Mean ( 15 / 24 )109.1476190476190.759020382276552143.800643034446
Trimmed Mean ( 16 / 24 )109.14250.723771173464695150.796970094201
Trimmed Mean ( 17 / 24 )109.1342105263160.686314878609035159.014781593399
Trimmed Mean ( 18 / 24 )109.1194444444440.643031257040328169.695396996232
Trimmed Mean ( 19 / 24 )109.0617647058820.604086126502833180.540091753574
Trimmed Mean ( 20 / 24 )109.0281250.584756538375919186.450459028318
Trimmed Mean ( 21 / 24 )109.0166666666670.568140409497701191.883317652144
Trimmed Mean ( 22 / 24 )108.9928571428570.548613658537672198.669601907793
Trimmed Mean ( 23 / 24 )108.9730769230770.532268228861747204.733386315609
Trimmed Mean ( 24 / 24 )108.9416666666670.507976829134163214.46188176015
Median109
Midrange104.8
Midmean - Weighted Average at Xnp108.9
Midmean - Weighted Average at X(n+1)p109.119444444444
Midmean - Empirical Distribution Function108.9
Midmean - Empirical Distribution Function - Averaging109.119444444444
Midmean - Empirical Distribution Function - Interpolation109.119444444444
Midmean - Closest Observation108.9
Midmean - True Basic - Statistics Graphics Toolkit109.119444444444
Midmean - MS Excel (old versions)109.134210526316
Number of observations72

\begin{tabular}{lllllllll}
\hline
Central Tendency - Ungrouped Data \tabularnewline
Measure & Value & S.E. & Value/S.E. \tabularnewline
Arithmetic Mean & 108.534722222222 & 1.53160772430001 & 70.863263811121 \tabularnewline
Geometric Mean & 107.738645400597 &  &  \tabularnewline
Harmonic Mean & 106.906874456237 &  &  \tabularnewline
Quadratic Mean & 109.299310636232 &  &  \tabularnewline
Winsorized Mean ( 1 / 24 ) & 108.669444444444 & 1.46441573816382 & 74.2066898165827 \tabularnewline
Winsorized Mean ( 2 / 24 ) & 108.636111111111 & 1.41888435305273 & 76.5644577568149 \tabularnewline
Winsorized Mean ( 3 / 24 ) & 108.648611111111 & 1.38321029072049 & 78.5481512391856 \tabularnewline
Winsorized Mean ( 4 / 24 ) & 108.6375 & 1.38079188102375 & 78.6776787240768 \tabularnewline
Winsorized Mean ( 5 / 24 ) & 108.394444444444 & 1.27969255050654 & 84.7035050735729 \tabularnewline
Winsorized Mean ( 6 / 24 ) & 108.452777777778 & 1.2619677052652 & 85.9394240639354 \tabularnewline
Winsorized Mean ( 7 / 24 ) & 108.413888888889 & 1.24446710625185 & 87.116717142822 \tabularnewline
Winsorized Mean ( 8 / 24 ) & 108.336111111111 & 1.22730621206253 & 88.2714599228245 \tabularnewline
Winsorized Mean ( 9 / 24 ) & 108.236111111111 & 1.21100086898294 & 89.3774016875916 \tabularnewline
Winsorized Mean ( 10 / 24 ) & 108.222222222222 & 1.18434166888734 & 91.3775349337279 \tabularnewline
Winsorized Mean ( 11 / 24 ) & 108.329166666667 & 1.15861142252429 & 93.4991357418589 \tabularnewline
Winsorized Mean ( 12 / 24 ) & 108.3625 & 1.1465765835275 & 94.5096049900285 \tabularnewline
Winsorized Mean ( 13 / 24 ) & 108.651388888889 & 1.032509502462 & 105.230400911384 \tabularnewline
Winsorized Mean ( 14 / 24 ) & 108.690277777778 & 0.936148420031751 & 116.103681266793 \tabularnewline
Winsorized Mean ( 15 / 24 ) & 109.190277777778 & 0.840918902066186 & 129.846382938344 \tabularnewline
Winsorized Mean ( 16 / 24 ) & 109.2125 & 0.80293363105813 & 136.016845945382 \tabularnewline
Winsorized Mean ( 17 / 24 ) & 109.259722222222 & 0.774012217501278 & 141.160203614024 \tabularnewline
Winsorized Mean ( 18 / 24 ) & 109.609722222222 & 0.700668023863232 & 156.436027461156 \tabularnewline
Winsorized Mean ( 19 / 24 ) & 109.345833333333 & 0.582984260075765 & 187.562239363242 \tabularnewline
Winsorized Mean ( 20 / 24 ) & 109.123611111111 & 0.542794935641339 & 201.040216011183 \tabularnewline
Winsorized Mean ( 21 / 24 ) & 109.211111111111 & 0.522706464795892 & 208.933920788135 \tabularnewline
Winsorized Mean ( 22 / 24 ) & 109.15 & 0.480459319879913 & 227.178442552184 \tabularnewline
Winsorized Mean ( 23 / 24 ) & 109.213888888889 & 0.471990530475964 & 231.390000089103 \tabularnewline
Winsorized Mean ( 24 / 24 ) & 109.280555555556 & 0.454255822703949 & 240.570511358699 \tabularnewline
Trimmed Mean ( 1 / 24 ) & 108.641428571429 & 1.40854019384231 & 77.130513595831 \tabularnewline
Trimmed Mean ( 2 / 24 ) & 108.611764705882 & 1.34177416098458 & 80.946382680513 \tabularnewline
Trimmed Mean ( 3 / 24 ) & 108.598484848485 & 1.2916975196091 & 84.0742381245336 \tabularnewline
Trimmed Mean ( 4 / 24 ) & 108.5796875 & 1.24835443209548 & 86.9782528970866 \tabularnewline
Trimmed Mean ( 5 / 24 ) & 108.562903225806 & 1.19685652496818 & 90.7066978881977 \tabularnewline
Trimmed Mean ( 6 / 24 ) & 108.603333333333 & 1.16763067516959 & 93.0117164980782 \tabularnewline
Trimmed Mean ( 7 / 24 ) & 108.634482758621 & 1.13694635575959 & 95.5493477843489 \tabularnewline
Trimmed Mean ( 8 / 24 ) & 108.675 & 1.10377230971261 & 98.4578060563013 \tabularnewline
Trimmed Mean ( 9 / 24 ) & 108.731481481481 & 1.06689863854077 & 101.913600368069 \tabularnewline
Trimmed Mean ( 10 / 24 ) & 108.807692307692 & 1.02466875107309 & 106.188162948995 \tabularnewline
Trimmed Mean ( 11 / 24 ) & 108.892 & 0.977927170611599 & 111.349805253799 \tabularnewline
Trimmed Mean ( 12 / 24 ) & 108.96875 & 0.924892921969851 & 117.817692633993 \tabularnewline
Trimmed Mean ( 13 / 24 ) & 109.047826086957 & 0.859202748819555 & 126.917454857745 \tabularnewline
Trimmed Mean ( 14 / 24 ) & 109.097727272727 & 0.80481169672912 & 135.55683610976 \tabularnewline
Trimmed Mean ( 15 / 24 ) & 109.147619047619 & 0.759020382276552 & 143.800643034446 \tabularnewline
Trimmed Mean ( 16 / 24 ) & 109.1425 & 0.723771173464695 & 150.796970094201 \tabularnewline
Trimmed Mean ( 17 / 24 ) & 109.134210526316 & 0.686314878609035 & 159.014781593399 \tabularnewline
Trimmed Mean ( 18 / 24 ) & 109.119444444444 & 0.643031257040328 & 169.695396996232 \tabularnewline
Trimmed Mean ( 19 / 24 ) & 109.061764705882 & 0.604086126502833 & 180.540091753574 \tabularnewline
Trimmed Mean ( 20 / 24 ) & 109.028125 & 0.584756538375919 & 186.450459028318 \tabularnewline
Trimmed Mean ( 21 / 24 ) & 109.016666666667 & 0.568140409497701 & 191.883317652144 \tabularnewline
Trimmed Mean ( 22 / 24 ) & 108.992857142857 & 0.548613658537672 & 198.669601907793 \tabularnewline
Trimmed Mean ( 23 / 24 ) & 108.973076923077 & 0.532268228861747 & 204.733386315609 \tabularnewline
Trimmed Mean ( 24 / 24 ) & 108.941666666667 & 0.507976829134163 & 214.46188176015 \tabularnewline
Median & 109 &  &  \tabularnewline
Midrange & 104.8 &  &  \tabularnewline
Midmean - Weighted Average at Xnp & 108.9 &  &  \tabularnewline
Midmean - Weighted Average at X(n+1)p & 109.119444444444 &  &  \tabularnewline
Midmean - Empirical Distribution Function & 108.9 &  &  \tabularnewline
Midmean - Empirical Distribution Function - Averaging & 109.119444444444 &  &  \tabularnewline
Midmean - Empirical Distribution Function - Interpolation & 109.119444444444 &  &  \tabularnewline
Midmean - Closest Observation & 108.9 &  &  \tabularnewline
Midmean - True Basic - Statistics Graphics Toolkit & 109.119444444444 &  &  \tabularnewline
Midmean - MS Excel (old versions) & 109.134210526316 &  &  \tabularnewline
Number of observations & 72 &  &  \tabularnewline
\hline
\end{tabular}
%Source: https://freestatistics.org/blog/index.php?pk=&T=1

[TABLE]
[ROW][C]Central Tendency - Ungrouped Data[/C][/ROW]
[ROW][C]Measure[/C][C]Value[/C][C]S.E.[/C][C]Value/S.E.[/C][/ROW]
[ROW][C]Arithmetic Mean[/C][C]108.534722222222[/C][C]1.53160772430001[/C][C]70.863263811121[/C][/ROW]
[ROW][C]Geometric Mean[/C][C]107.738645400597[/C][C][/C][C][/C][/ROW]
[ROW][C]Harmonic Mean[/C][C]106.906874456237[/C][C][/C][C][/C][/ROW]
[ROW][C]Quadratic Mean[/C][C]109.299310636232[/C][C][/C][C][/C][/ROW]
[ROW][C]Winsorized Mean ( 1 / 24 )[/C][C]108.669444444444[/C][C]1.46441573816382[/C][C]74.2066898165827[/C][/ROW]
[ROW][C]Winsorized Mean ( 2 / 24 )[/C][C]108.636111111111[/C][C]1.41888435305273[/C][C]76.5644577568149[/C][/ROW]
[ROW][C]Winsorized Mean ( 3 / 24 )[/C][C]108.648611111111[/C][C]1.38321029072049[/C][C]78.5481512391856[/C][/ROW]
[ROW][C]Winsorized Mean ( 4 / 24 )[/C][C]108.6375[/C][C]1.38079188102375[/C][C]78.6776787240768[/C][/ROW]
[ROW][C]Winsorized Mean ( 5 / 24 )[/C][C]108.394444444444[/C][C]1.27969255050654[/C][C]84.7035050735729[/C][/ROW]
[ROW][C]Winsorized Mean ( 6 / 24 )[/C][C]108.452777777778[/C][C]1.2619677052652[/C][C]85.9394240639354[/C][/ROW]
[ROW][C]Winsorized Mean ( 7 / 24 )[/C][C]108.413888888889[/C][C]1.24446710625185[/C][C]87.116717142822[/C][/ROW]
[ROW][C]Winsorized Mean ( 8 / 24 )[/C][C]108.336111111111[/C][C]1.22730621206253[/C][C]88.2714599228245[/C][/ROW]
[ROW][C]Winsorized Mean ( 9 / 24 )[/C][C]108.236111111111[/C][C]1.21100086898294[/C][C]89.3774016875916[/C][/ROW]
[ROW][C]Winsorized Mean ( 10 / 24 )[/C][C]108.222222222222[/C][C]1.18434166888734[/C][C]91.3775349337279[/C][/ROW]
[ROW][C]Winsorized Mean ( 11 / 24 )[/C][C]108.329166666667[/C][C]1.15861142252429[/C][C]93.4991357418589[/C][/ROW]
[ROW][C]Winsorized Mean ( 12 / 24 )[/C][C]108.3625[/C][C]1.1465765835275[/C][C]94.5096049900285[/C][/ROW]
[ROW][C]Winsorized Mean ( 13 / 24 )[/C][C]108.651388888889[/C][C]1.032509502462[/C][C]105.230400911384[/C][/ROW]
[ROW][C]Winsorized Mean ( 14 / 24 )[/C][C]108.690277777778[/C][C]0.936148420031751[/C][C]116.103681266793[/C][/ROW]
[ROW][C]Winsorized Mean ( 15 / 24 )[/C][C]109.190277777778[/C][C]0.840918902066186[/C][C]129.846382938344[/C][/ROW]
[ROW][C]Winsorized Mean ( 16 / 24 )[/C][C]109.2125[/C][C]0.80293363105813[/C][C]136.016845945382[/C][/ROW]
[ROW][C]Winsorized Mean ( 17 / 24 )[/C][C]109.259722222222[/C][C]0.774012217501278[/C][C]141.160203614024[/C][/ROW]
[ROW][C]Winsorized Mean ( 18 / 24 )[/C][C]109.609722222222[/C][C]0.700668023863232[/C][C]156.436027461156[/C][/ROW]
[ROW][C]Winsorized Mean ( 19 / 24 )[/C][C]109.345833333333[/C][C]0.582984260075765[/C][C]187.562239363242[/C][/ROW]
[ROW][C]Winsorized Mean ( 20 / 24 )[/C][C]109.123611111111[/C][C]0.542794935641339[/C][C]201.040216011183[/C][/ROW]
[ROW][C]Winsorized Mean ( 21 / 24 )[/C][C]109.211111111111[/C][C]0.522706464795892[/C][C]208.933920788135[/C][/ROW]
[ROW][C]Winsorized Mean ( 22 / 24 )[/C][C]109.15[/C][C]0.480459319879913[/C][C]227.178442552184[/C][/ROW]
[ROW][C]Winsorized Mean ( 23 / 24 )[/C][C]109.213888888889[/C][C]0.471990530475964[/C][C]231.390000089103[/C][/ROW]
[ROW][C]Winsorized Mean ( 24 / 24 )[/C][C]109.280555555556[/C][C]0.454255822703949[/C][C]240.570511358699[/C][/ROW]
[ROW][C]Trimmed Mean ( 1 / 24 )[/C][C]108.641428571429[/C][C]1.40854019384231[/C][C]77.130513595831[/C][/ROW]
[ROW][C]Trimmed Mean ( 2 / 24 )[/C][C]108.611764705882[/C][C]1.34177416098458[/C][C]80.946382680513[/C][/ROW]
[ROW][C]Trimmed Mean ( 3 / 24 )[/C][C]108.598484848485[/C][C]1.2916975196091[/C][C]84.0742381245336[/C][/ROW]
[ROW][C]Trimmed Mean ( 4 / 24 )[/C][C]108.5796875[/C][C]1.24835443209548[/C][C]86.9782528970866[/C][/ROW]
[ROW][C]Trimmed Mean ( 5 / 24 )[/C][C]108.562903225806[/C][C]1.19685652496818[/C][C]90.7066978881977[/C][/ROW]
[ROW][C]Trimmed Mean ( 6 / 24 )[/C][C]108.603333333333[/C][C]1.16763067516959[/C][C]93.0117164980782[/C][/ROW]
[ROW][C]Trimmed Mean ( 7 / 24 )[/C][C]108.634482758621[/C][C]1.13694635575959[/C][C]95.5493477843489[/C][/ROW]
[ROW][C]Trimmed Mean ( 8 / 24 )[/C][C]108.675[/C][C]1.10377230971261[/C][C]98.4578060563013[/C][/ROW]
[ROW][C]Trimmed Mean ( 9 / 24 )[/C][C]108.731481481481[/C][C]1.06689863854077[/C][C]101.913600368069[/C][/ROW]
[ROW][C]Trimmed Mean ( 10 / 24 )[/C][C]108.807692307692[/C][C]1.02466875107309[/C][C]106.188162948995[/C][/ROW]
[ROW][C]Trimmed Mean ( 11 / 24 )[/C][C]108.892[/C][C]0.977927170611599[/C][C]111.349805253799[/C][/ROW]
[ROW][C]Trimmed Mean ( 12 / 24 )[/C][C]108.96875[/C][C]0.924892921969851[/C][C]117.817692633993[/C][/ROW]
[ROW][C]Trimmed Mean ( 13 / 24 )[/C][C]109.047826086957[/C][C]0.859202748819555[/C][C]126.917454857745[/C][/ROW]
[ROW][C]Trimmed Mean ( 14 / 24 )[/C][C]109.097727272727[/C][C]0.80481169672912[/C][C]135.55683610976[/C][/ROW]
[ROW][C]Trimmed Mean ( 15 / 24 )[/C][C]109.147619047619[/C][C]0.759020382276552[/C][C]143.800643034446[/C][/ROW]
[ROW][C]Trimmed Mean ( 16 / 24 )[/C][C]109.1425[/C][C]0.723771173464695[/C][C]150.796970094201[/C][/ROW]
[ROW][C]Trimmed Mean ( 17 / 24 )[/C][C]109.134210526316[/C][C]0.686314878609035[/C][C]159.014781593399[/C][/ROW]
[ROW][C]Trimmed Mean ( 18 / 24 )[/C][C]109.119444444444[/C][C]0.643031257040328[/C][C]169.695396996232[/C][/ROW]
[ROW][C]Trimmed Mean ( 19 / 24 )[/C][C]109.061764705882[/C][C]0.604086126502833[/C][C]180.540091753574[/C][/ROW]
[ROW][C]Trimmed Mean ( 20 / 24 )[/C][C]109.028125[/C][C]0.584756538375919[/C][C]186.450459028318[/C][/ROW]
[ROW][C]Trimmed Mean ( 21 / 24 )[/C][C]109.016666666667[/C][C]0.568140409497701[/C][C]191.883317652144[/C][/ROW]
[ROW][C]Trimmed Mean ( 22 / 24 )[/C][C]108.992857142857[/C][C]0.548613658537672[/C][C]198.669601907793[/C][/ROW]
[ROW][C]Trimmed Mean ( 23 / 24 )[/C][C]108.973076923077[/C][C]0.532268228861747[/C][C]204.733386315609[/C][/ROW]
[ROW][C]Trimmed Mean ( 24 / 24 )[/C][C]108.941666666667[/C][C]0.507976829134163[/C][C]214.46188176015[/C][/ROW]
[ROW][C]Median[/C][C]109[/C][C][/C][C][/C][/ROW]
[ROW][C]Midrange[/C][C]104.8[/C][C][/C][C][/C][/ROW]
[ROW][C]Midmean - Weighted Average at Xnp[/C][C]108.9[/C][C][/C][C][/C][/ROW]
[ROW][C]Midmean - Weighted Average at X(n+1)p[/C][C]109.119444444444[/C][C][/C][C][/C][/ROW]
[ROW][C]Midmean - Empirical Distribution Function[/C][C]108.9[/C][C][/C][C][/C][/ROW]
[ROW][C]Midmean - Empirical Distribution Function - Averaging[/C][C]109.119444444444[/C][C][/C][C][/C][/ROW]
[ROW][C]Midmean - Empirical Distribution Function - Interpolation[/C][C]109.119444444444[/C][C][/C][C][/C][/ROW]
[ROW][C]Midmean - Closest Observation[/C][C]108.9[/C][C][/C][C][/C][/ROW]
[ROW][C]Midmean - True Basic - Statistics Graphics Toolkit[/C][C]109.119444444444[/C][C][/C][C][/C][/ROW]
[ROW][C]Midmean - MS Excel (old versions)[/C][C]109.134210526316[/C][C][/C][C][/C][/ROW]
[ROW][C]Number of observations[/C][C]72[/C][C][/C][C][/C][/ROW]
[/TABLE]
Source: https://freestatistics.org/blog/index.php?pk=&T=1

Globally Unique Identifier (entire table): ba.freestatistics.org/blog/index.php?pk=&T=1

As an alternative you can also use a QR Code:  

The GUIDs for individual cells are displayed in the table below:

Central Tendency - Ungrouped Data
MeasureValueS.E.Value/S.E.
Arithmetic Mean108.5347222222221.5316077243000170.863263811121
Geometric Mean107.738645400597
Harmonic Mean106.906874456237
Quadratic Mean109.299310636232
Winsorized Mean ( 1 / 24 )108.6694444444441.4644157381638274.2066898165827
Winsorized Mean ( 2 / 24 )108.6361111111111.4188843530527376.5644577568149
Winsorized Mean ( 3 / 24 )108.6486111111111.3832102907204978.5481512391856
Winsorized Mean ( 4 / 24 )108.63751.3807918810237578.6776787240768
Winsorized Mean ( 5 / 24 )108.3944444444441.2796925505065484.7035050735729
Winsorized Mean ( 6 / 24 )108.4527777777781.261967705265285.9394240639354
Winsorized Mean ( 7 / 24 )108.4138888888891.2444671062518587.116717142822
Winsorized Mean ( 8 / 24 )108.3361111111111.2273062120625388.2714599228245
Winsorized Mean ( 9 / 24 )108.2361111111111.2110008689829489.3774016875916
Winsorized Mean ( 10 / 24 )108.2222222222221.1843416688873491.3775349337279
Winsorized Mean ( 11 / 24 )108.3291666666671.1586114225242993.4991357418589
Winsorized Mean ( 12 / 24 )108.36251.146576583527594.5096049900285
Winsorized Mean ( 13 / 24 )108.6513888888891.032509502462105.230400911384
Winsorized Mean ( 14 / 24 )108.6902777777780.936148420031751116.103681266793
Winsorized Mean ( 15 / 24 )109.1902777777780.840918902066186129.846382938344
Winsorized Mean ( 16 / 24 )109.21250.80293363105813136.016845945382
Winsorized Mean ( 17 / 24 )109.2597222222220.774012217501278141.160203614024
Winsorized Mean ( 18 / 24 )109.6097222222220.700668023863232156.436027461156
Winsorized Mean ( 19 / 24 )109.3458333333330.582984260075765187.562239363242
Winsorized Mean ( 20 / 24 )109.1236111111110.542794935641339201.040216011183
Winsorized Mean ( 21 / 24 )109.2111111111110.522706464795892208.933920788135
Winsorized Mean ( 22 / 24 )109.150.480459319879913227.178442552184
Winsorized Mean ( 23 / 24 )109.2138888888890.471990530475964231.390000089103
Winsorized Mean ( 24 / 24 )109.2805555555560.454255822703949240.570511358699
Trimmed Mean ( 1 / 24 )108.6414285714291.4085401938423177.130513595831
Trimmed Mean ( 2 / 24 )108.6117647058821.3417741609845880.946382680513
Trimmed Mean ( 3 / 24 )108.5984848484851.291697519609184.0742381245336
Trimmed Mean ( 4 / 24 )108.57968751.2483544320954886.9782528970866
Trimmed Mean ( 5 / 24 )108.5629032258061.1968565249681890.7066978881977
Trimmed Mean ( 6 / 24 )108.6033333333331.1676306751695993.0117164980782
Trimmed Mean ( 7 / 24 )108.6344827586211.1369463557595995.5493477843489
Trimmed Mean ( 8 / 24 )108.6751.1037723097126198.4578060563013
Trimmed Mean ( 9 / 24 )108.7314814814811.06689863854077101.913600368069
Trimmed Mean ( 10 / 24 )108.8076923076921.02466875107309106.188162948995
Trimmed Mean ( 11 / 24 )108.8920.977927170611599111.349805253799
Trimmed Mean ( 12 / 24 )108.968750.924892921969851117.817692633993
Trimmed Mean ( 13 / 24 )109.0478260869570.859202748819555126.917454857745
Trimmed Mean ( 14 / 24 )109.0977272727270.80481169672912135.55683610976
Trimmed Mean ( 15 / 24 )109.1476190476190.759020382276552143.800643034446
Trimmed Mean ( 16 / 24 )109.14250.723771173464695150.796970094201
Trimmed Mean ( 17 / 24 )109.1342105263160.686314878609035159.014781593399
Trimmed Mean ( 18 / 24 )109.1194444444440.643031257040328169.695396996232
Trimmed Mean ( 19 / 24 )109.0617647058820.604086126502833180.540091753574
Trimmed Mean ( 20 / 24 )109.0281250.584756538375919186.450459028318
Trimmed Mean ( 21 / 24 )109.0166666666670.568140409497701191.883317652144
Trimmed Mean ( 22 / 24 )108.9928571428570.548613658537672198.669601907793
Trimmed Mean ( 23 / 24 )108.9730769230770.532268228861747204.733386315609
Trimmed Mean ( 24 / 24 )108.9416666666670.507976829134163214.46188176015
Median109
Midrange104.8
Midmean - Weighted Average at Xnp108.9
Midmean - Weighted Average at X(n+1)p109.119444444444
Midmean - Empirical Distribution Function108.9
Midmean - Empirical Distribution Function - Averaging109.119444444444
Midmean - Empirical Distribution Function - Interpolation109.119444444444
Midmean - Closest Observation108.9
Midmean - True Basic - Statistics Graphics Toolkit109.119444444444
Midmean - MS Excel (old versions)109.134210526316
Number of observations72


Parameters (Session):
Parameters (R input):
R code (references can be found in the software module):
geomean <- function(x) {
return(exp(mean(log(x))))
}
harmean <- function(x) {
return(1/mean(1/x))
}
quamean <- function(x) {
return(sqrt(mean(x*x)))
}
winmean <- function(x) {
x <-sort(x[!is.na(x)])
n<-length(x)
denom <- 3
nodenom <- n/denom
if (nodenom>40) denom <- n/40
sqrtn = sqrt(n)
roundnodenom = floor(nodenom)
win <- array(NA,dim=c(roundnodenom,2))
for (j in 1:roundnodenom) {
win[j,1] <- (j*x[j+1]+sum(x[(j+1):(n-j)])+j*x[n-j])/n
win[j,2] <- sd(c(rep(x[j+1],j),x[(j+1):(n-j)],rep(x[n-j],j)))/sqrtn
}
return(win)
}
trimean <- function(x) {
x <-sort(x[!is.na(x)])
n<-length(x)
denom <- 3
nodenom <- n/denom
if (nodenom>40) denom <- n/40
sqrtn = sqrt(n)
roundnodenom = floor(nodenom)
tri <- array(NA,dim=c(roundnodenom,2))
for (j in 1:roundnodenom) {
tri[j,1] <- mean(x,trim=j/n)
tri[j,2] <- sd(x[(j+1):(n-j)]) / sqrt(n-j*2)
}
return(tri)
}
midrange <- function(x) {
return((max(x)+min(x))/2)
}
q1 <- function(data,n,p,i,f) {
np <- n*p;
i <<- floor(np)
f <<- np - i
qvalue <- (1-f)*data[i] + f*data[i+1]
}
q2 <- function(data,n,p,i,f) {
np <- (n+1)*p
i <<- floor(np)
f <<- np - i
qvalue <- (1-f)*data[i] + f*data[i+1]
}
q3 <- function(data,n,p,i,f) {
np <- n*p
i <<- floor(np)
f <<- np - i
if (f==0) {
qvalue <- data[i]
} else {
qvalue <- data[i+1]
}
}
q4 <- function(data,n,p,i,f) {
np <- n*p
i <<- floor(np)
f <<- np - i
if (f==0) {
qvalue <- (data[i]+data[i+1])/2
} else {
qvalue <- data[i+1]
}
}
q5 <- function(data,n,p,i,f) {
np <- (n-1)*p
i <<- floor(np)
f <<- np - i
if (f==0) {
qvalue <- data[i+1]
} else {
qvalue <- data[i+1] + f*(data[i+2]-data[i+1])
}
}
q6 <- function(data,n,p,i,f) {
np <- n*p+0.5
i <<- floor(np)
f <<- np - i
qvalue <- data[i]
}
q7 <- function(data,n,p,i,f) {
np <- (n+1)*p
i <<- floor(np)
f <<- np - i
if (f==0) {
qvalue <- data[i]
} else {
qvalue <- f*data[i] + (1-f)*data[i+1]
}
}
q8 <- function(data,n,p,i,f) {
np <- (n+1)*p
i <<- floor(np)
f <<- np - i
if (f==0) {
qvalue <- data[i]
} else {
if (f == 0.5) {
qvalue <- (data[i]+data[i+1])/2
} else {
if (f < 0.5) {
qvalue <- data[i]
} else {
qvalue <- data[i+1]
}
}
}
}
midmean <- function(x,def) {
x <-sort(x[!is.na(x)])
n<-length(x)
if (def==1) {
qvalue1 <- q1(x,n,0.25,i,f)
qvalue3 <- q1(x,n,0.75,i,f)
}
if (def==2) {
qvalue1 <- q2(x,n,0.25,i,f)
qvalue3 <- q2(x,n,0.75,i,f)
}
if (def==3) {
qvalue1 <- q3(x,n,0.25,i,f)
qvalue3 <- q3(x,n,0.75,i,f)
}
if (def==4) {
qvalue1 <- q4(x,n,0.25,i,f)
qvalue3 <- q4(x,n,0.75,i,f)
}
if (def==5) {
qvalue1 <- q5(x,n,0.25,i,f)
qvalue3 <- q5(x,n,0.75,i,f)
}
if (def==6) {
qvalue1 <- q6(x,n,0.25,i,f)
qvalue3 <- q6(x,n,0.75,i,f)
}
if (def==7) {
qvalue1 <- q7(x,n,0.25,i,f)
qvalue3 <- q7(x,n,0.75,i,f)
}
if (def==8) {
qvalue1 <- q8(x,n,0.25,i,f)
qvalue3 <- q8(x,n,0.75,i,f)
}
midm <- 0
myn <- 0
roundno4 <- round(n/4)
round3no4 <- round(3*n/4)
for (i in 1:n) {
if ((x[i]>=qvalue1) & (x[i]<=qvalue3)){
midm = midm + x[i]
myn = myn + 1
}
}
midm = midm / myn
return(midm)
}
(arm <- mean(x))
sqrtn <- sqrt(length(x))
(armse <- sd(x) / sqrtn)
(armose <- arm / armse)
(geo <- geomean(x))
(har <- harmean(x))
(qua <- quamean(x))
(win <- winmean(x))
(tri <- trimean(x))
(midr <- midrange(x))
midm <- array(NA,dim=8)
for (j in 1:8) midm[j] <- midmean(x,j)
midm
bitmap(file='test1.png')
lb <- win[,1] - 2*win[,2]
ub <- win[,1] + 2*win[,2]
if ((ylimmin == '') | (ylimmax == '')) plot(win[,1],type='b',main=main, xlab='j', pch=19, ylab='Winsorized Mean(j/n)', ylim=c(min(lb),max(ub))) else plot(win[,1],type='l',main=main, xlab='j', pch=19, ylab='Winsorized Mean(j/n)', ylim=c(ylimmin,ylimmax))
lines(ub,lty=3)
lines(lb,lty=3)
grid()
dev.off()
bitmap(file='test2.png')
lb <- tri[,1] - 2*tri[,2]
ub <- tri[,1] + 2*tri[,2]
if ((ylimmin == '') | (ylimmax == '')) plot(tri[,1],type='b',main=main, xlab='j', pch=19, ylab='Trimmed Mean(j/n)', ylim=c(min(lb),max(ub))) else plot(tri[,1],type='l',main=main, xlab='j', pch=19, ylab='Trimmed Mean(j/n)', ylim=c(ylimmin,ylimmax))
lines(ub,lty=3)
lines(lb,lty=3)
grid()
dev.off()
load(file='createtable')
a<-table.start()
a<-table.row.start(a)
a<-table.element(a,'Central Tendency - Ungrouped Data',4,TRUE)
a<-table.row.end(a)
a<-table.row.start(a)
a<-table.element(a,'Measure',header=TRUE)
a<-table.element(a,'Value',header=TRUE)
a<-table.element(a,'S.E.',header=TRUE)
a<-table.element(a,'Value/S.E.',header=TRUE)
a<-table.row.end(a)
a<-table.row.start(a)
a<-table.element(a,hyperlink('arithmetic_mean.htm', 'Arithmetic Mean', 'click to view the definition of the Arithmetic Mean'),header=TRUE)
a<-table.element(a,arm)
a<-table.element(a,hyperlink('arithmetic_mean_standard_error.htm', armse, 'click to view the definition of the Standard Error of the Arithmetic Mean'))
a<-table.element(a,armose)
a<-table.row.end(a)
a<-table.row.start(a)
a<-table.element(a,hyperlink('geometric_mean.htm', 'Geometric Mean', 'click to view the definition of the Geometric Mean'),header=TRUE)
a<-table.element(a,geo)
a<-table.element(a,'')
a<-table.row.end(a)
a<-table.row.start(a)
a<-table.element(a,hyperlink('harmonic_mean.htm', 'Harmonic Mean', 'click to view the definition of the Harmonic Mean'),header=TRUE)
a<-table.element(a,har)
a<-table.element(a,'')
a<-table.row.end(a)
a<-table.row.start(a)
a<-table.element(a,hyperlink('quadratic_mean.htm', 'Quadratic Mean', 'click to view the definition of the Quadratic Mean'),header=TRUE)
a<-table.element(a,qua)
a<-table.element(a,'')
a<-table.row.end(a)
for (j in 1:length(win[,1])) {
a<-table.row.start(a)
mylabel <- paste('Winsorized Mean (',j)
mylabel <- paste(mylabel,'/')
mylabel <- paste(mylabel,length(win[,1]))
mylabel <- paste(mylabel,')')
a<-table.element(a,hyperlink('winsorized_mean.htm', mylabel, 'click to view the definition of the Winsorized Mean'),header=TRUE)
a<-table.element(a,win[j,1])
a<-table.element(a,win[j,2])
a<-table.element(a,win[j,1]/win[j,2])
a<-table.row.end(a)
}
for (j in 1:length(tri[,1])) {
a<-table.row.start(a)
mylabel <- paste('Trimmed Mean (',j)
mylabel <- paste(mylabel,'/')
mylabel <- paste(mylabel,length(tri[,1]))
mylabel <- paste(mylabel,')')
a<-table.element(a,hyperlink('arithmetic_mean.htm', mylabel, 'click to view the definition of the Trimmed Mean'),header=TRUE)
a<-table.element(a,tri[j,1])
a<-table.element(a,tri[j,2])
a<-table.element(a,tri[j,1]/tri[j,2])
a<-table.row.end(a)
}
a<-table.row.start(a)
a<-table.element(a,hyperlink('median_1.htm', 'Median', 'click to view the definition of the Median'),header=TRUE)
a<-table.element(a,median(x))
a<-table.element(a,'')
a<-table.row.end(a)
a<-table.row.start(a)
a<-table.element(a,hyperlink('midrange.htm', 'Midrange', 'click to view the definition of the Midrange'),header=TRUE)
a<-table.element(a,midr)
a<-table.element(a,'')
a<-table.row.end(a)
a<-table.row.start(a)
mymid <- hyperlink('midmean.htm', 'Midmean', 'click to view the definition of the Midmean')
mylabel <- paste(mymid,hyperlink('method_1.htm','Weighted Average at Xnp',''),sep=' - ')
a<-table.element(a,mylabel,header=TRUE)
a<-table.element(a,midm[1])
a<-table.element(a,'')
a<-table.row.end(a)
a<-table.row.start(a)
mymid <- hyperlink('midmean.htm', 'Midmean', 'click to view the definition of the Midmean')
mylabel <- paste(mymid,hyperlink('method_2.htm','Weighted Average at X(n+1)p',''),sep=' - ')
a<-table.element(a,mylabel,header=TRUE)
a<-table.element(a,midm[2])
a<-table.element(a,'')
a<-table.row.end(a)
a<-table.row.start(a)
mymid <- hyperlink('midmean.htm', 'Midmean', 'click to view the definition of the Midmean')
mylabel <- paste(mymid,hyperlink('method_3.htm','Empirical Distribution Function',''),sep=' - ')
a<-table.element(a,mylabel,header=TRUE)
a<-table.element(a,midm[3])
a<-table.element(a,'')
a<-table.row.end(a)
a<-table.row.start(a)
mymid <- hyperlink('midmean.htm', 'Midmean', 'click to view the definition of the Midmean')
mylabel <- paste(mymid,hyperlink('method_4.htm','Empirical Distribution Function - Averaging',''),sep=' - ')
a<-table.element(a,mylabel,header=TRUE)
a<-table.element(a,midm[4])
a<-table.element(a,'')
a<-table.row.end(a)
a<-table.row.start(a)
mymid <- hyperlink('midmean.htm', 'Midmean', 'click to view the definition of the Midmean')
mylabel <- paste(mymid,hyperlink('method_5.htm','Empirical Distribution Function - Interpolation',''),sep=' - ')
a<-table.element(a,mylabel,header=TRUE)
a<-table.element(a,midm[5])
a<-table.element(a,'')
a<-table.row.end(a)
a<-table.row.start(a)
mymid <- hyperlink('midmean.htm', 'Midmean', 'click to view the definition of the Midmean')
mylabel <- paste(mymid,hyperlink('method_6.htm','Closest Observation',''),sep=' - ')
a<-table.element(a,mylabel,header=TRUE)
a<-table.element(a,midm[6])
a<-table.element(a,'')
a<-table.row.end(a)
a<-table.row.start(a)
mymid <- hyperlink('midmean.htm', 'Midmean', 'click to view the definition of the Midmean')
mylabel <- paste(mymid,hyperlink('method_7.htm','True Basic - Statistics Graphics Toolkit',''),sep=' - ')
a<-table.element(a,mylabel,header=TRUE)
a<-table.element(a,midm[7])
a<-table.element(a,'')
a<-table.row.end(a)
a<-table.row.start(a)
mymid <- hyperlink('midmean.htm', 'Midmean', 'click to view the definition of the Midmean')
mylabel <- paste(mymid,hyperlink('method_8.htm','MS Excel (old versions)',''),sep=' - ')
a<-table.element(a,mylabel,header=TRUE)
a<-table.element(a,midm[8])
a<-table.element(a,'')
a<-table.row.end(a)
a<-table.row.start(a)
a<-table.element(a,'Number of observations',header=TRUE)
a<-table.element(a,length(x))
a<-table.element(a,'')
a<-table.row.end(a)
a<-table.end(a)
table.save(a,file='mytable.tab')