Free Statistics

of Irreproducible Research!

Author's title

Author*Unverified author*
R Software Modulerwasp_harrell_davis.wasp
Title produced by softwareHarrell-Davis Quantiles
Date of computationThu, 09 Mar 2017 20:38:19 +0000
Cite this page as followsStatistical Computations at FreeStatistics.org, Office for Research Development and Education, URL https://freestatistics.org/blog/index.php?v=date/2017/Mar/09/t1489091931el8nntxb9613l4p.htm/, Retrieved Wed, 15 May 2024 07:16:24 +0200
Statistical Computations at FreeStatistics.org, Office for Research Development and Education, URL https://freestatistics.org/blog/index.php?pk=, Retrieved Wed, 15 May 2024 07:16:24 +0200
QR Codes:

Original text written by user:
IsPrivate?No (this computation is public)
User-defined keywords
Estimated Impact0
Dataseries X:
93.55
94.11
94.34
94.38
94.39
94.42
94.42
94.47
94.59
94.63
94.84
94.98
95.19
95.76
96.04
96.08
96.2
96.29
96.3
96.31
96.46
96.66
96.83
97
97.1
97.16
97.31
97.33
97.4
97.4
97.52
97.77
98
98.2
98.48
98.53
98.71
99.03
99.52
99.65
99.94
99.98
100.12
100.17
100.38
100.75
100.84
100.9
100.91
101.15
101.25
101.39
101.4
101.53
101.55
101.58
101.58
101.65
101.7
101.71
101.71
101.73
101.73
101.75
101.84
101.95
101.95
101.98
101.99
102.03
102.11
102.14
102.18
102.2
102.28
102.29
102.32
102.33
102.33
102.36
102.54
102.58
102.79
103.01


Summary of computational transaction
Raw Inputview raw input (R code)
Raw Outputview raw output of R engine
Computing time1 seconds
R Server'Gertrude Mary Cox' @ cox.wessa.net

\begin{tabular}{lllllllll}
\hline
Summary of computational transaction \tabularnewline
Raw Input & view raw input (R code)  \tabularnewline
Raw Output & view raw output of R engine  \tabularnewline
Computing time & 1 seconds \tabularnewline
R Server & 'Gertrude Mary Cox' @ cox.wessa.net \tabularnewline
\hline
\end{tabular}
%Source: https://freestatistics.org/blog/index.php?pk=&T=0

[TABLE]
[ROW][C]Summary of computational transaction[/C][/ROW]
[ROW][C]Raw Input[/C][C]view raw input (R code) [/C][/ROW]
[ROW][C]Raw Output[/C][C]view raw output of R engine [/C][/ROW]
[ROW][C]Computing time[/C][C]1 seconds[/C][/ROW]
[ROW][C]R Server[/C][C]'Gertrude Mary Cox' @ cox.wessa.net[/C][/ROW]
[/TABLE]
Source: https://freestatistics.org/blog/index.php?pk=&T=0

Globally Unique Identifier (entire table): ba.freestatistics.org/blog/index.php?pk=&T=0

As an alternative you can also use a QR Code:  

The GUIDs for individual cells are displayed in the table below:

Summary of computational transaction
Raw Inputview raw input (R code)
Raw Outputview raw output of R engine
Computing time1 seconds
R Server'Gertrude Mary Cox' @ cox.wessa.net


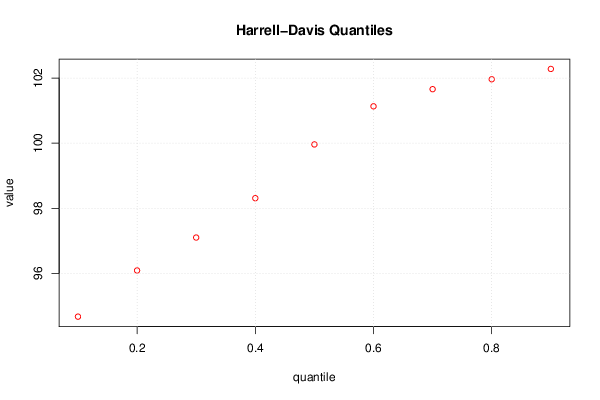
Harrell-Davis Quantiles
quantilesvaluestandard error
0.194.67126748844710.324109456129327
0.296.08932499056190.471985438315813
0.397.10108773691030.448222283936299
0.498.3093919982490.793959541619011
0.599.9608939424310.765545626387888
0.6101.1315251224550.421255424979395
0.7101.6572902412870.141951389154459
0.8101.9618806045650.134529481793977
0.9102.2788859017160.0799448104805899

\begin{tabular}{lllllllll}
\hline
Harrell-Davis Quantiles \tabularnewline
quantiles & value & standard error \tabularnewline
0.1 & 94.6712674884471 & 0.324109456129327 \tabularnewline
0.2 & 96.0893249905619 & 0.471985438315813 \tabularnewline
0.3 & 97.1010877369103 & 0.448222283936299 \tabularnewline
0.4 & 98.309391998249 & 0.793959541619011 \tabularnewline
0.5 & 99.960893942431 & 0.765545626387888 \tabularnewline
0.6 & 101.131525122455 & 0.421255424979395 \tabularnewline
0.7 & 101.657290241287 & 0.141951389154459 \tabularnewline
0.8 & 101.961880604565 & 0.134529481793977 \tabularnewline
0.9 & 102.278885901716 & 0.0799448104805899 \tabularnewline
\hline
\end{tabular}
%Source: https://freestatistics.org/blog/index.php?pk=&T=1

[TABLE]
[ROW][C]Harrell-Davis Quantiles[/C][/ROW]
[ROW][C]quantiles[/C][C]value[/C][C]standard error[/C][/ROW]
[ROW][C]0.1[/C][C]94.6712674884471[/C][C]0.324109456129327[/C][/ROW]
[ROW][C]0.2[/C][C]96.0893249905619[/C][C]0.471985438315813[/C][/ROW]
[ROW][C]0.3[/C][C]97.1010877369103[/C][C]0.448222283936299[/C][/ROW]
[ROW][C]0.4[/C][C]98.309391998249[/C][C]0.793959541619011[/C][/ROW]
[ROW][C]0.5[/C][C]99.960893942431[/C][C]0.765545626387888[/C][/ROW]
[ROW][C]0.6[/C][C]101.131525122455[/C][C]0.421255424979395[/C][/ROW]
[ROW][C]0.7[/C][C]101.657290241287[/C][C]0.141951389154459[/C][/ROW]
[ROW][C]0.8[/C][C]101.961880604565[/C][C]0.134529481793977[/C][/ROW]
[ROW][C]0.9[/C][C]102.278885901716[/C][C]0.0799448104805899[/C][/ROW]
[/TABLE]
Source: https://freestatistics.org/blog/index.php?pk=&T=1

Globally Unique Identifier (entire table): ba.freestatistics.org/blog/index.php?pk=&T=1

As an alternative you can also use a QR Code:  

The GUIDs for individual cells are displayed in the table below:

Harrell-Davis Quantiles
quantilesvaluestandard error
0.194.67126748844710.324109456129327
0.296.08932499056190.471985438315813
0.397.10108773691030.448222283936299
0.498.3093919982490.793959541619011
0.599.9608939424310.765545626387888
0.6101.1315251224550.421255424979395
0.7101.6572902412870.141951389154459
0.8101.9618806045650.134529481793977
0.9102.2788859017160.0799448104805899


Parameters (Session):
par1 = 0.1 ; par2 = 0.9 ; par3 = 0.1 ;
Parameters (R input):
par1 = 0.1 ; par2 = 0.9 ; par3 = 0.1 ;
R code (references can be found in the software module):
par3 <- '0.01'
par2 <- '0.99'
par1 <- '0.01'
par1 <- as(par1,'numeric')
par2 <- as(par2,'numeric')
par3 <- as(par3,'numeric')
library(Hmisc)
myseq <- seq(par1, par2, par3)
hd <- hdquantile(x, probs = myseq, se = TRUE, na.rm = FALSE, names = TRUE, weights=FALSE)
bitmap(file='test1.png')
plot(myseq,hd,col=2,main=main,xlab=xlab,ylab=ylab)
grid()
dev.off()
load(file='createtable')
a<-table.start()
a<-table.row.start(a)
a<-table.element(a,'Harrell-Davis Quantiles',3,TRUE)
a<-table.row.end(a)
a<-table.row.start(a)
a<-table.element(a,'quantiles',header=TRUE)
a<-table.element(a,'value',header=TRUE)
a<-table.element(a,'standard error',header=TRUE)
a<-table.row.end(a)
length(hd)
for (i in 1:length(hd))
{
a<-table.row.start(a)
a<-table.element(a,as(labels(hd)[i],'numeric'),header=TRUE)
a<-table.element(a,as.matrix(hd[i])[1,1])
a<-table.element(a,as.matrix(attr(hd,'se')[i])[1,1])
a<-table.row.end(a)
}
a<-table.end(a)
table.save(a,file='mytable.tab')