Free Statistics

of Irreproducible Research!

Author's title

Author*Unverified author*
R Software Modulerwasp_centraltendency.wasp
Title produced by softwareCentral Tendency
Date of computationFri, 10 Mar 2017 15:46:46 +0000
Cite this page as followsStatistical Computations at FreeStatistics.org, Office for Research Development and Education, URL https://freestatistics.org/blog/index.php?v=date/2017/Mar/10/t148916084030kpcg0durelpa3.htm/, Retrieved Wed, 15 May 2024 09:24:16 +0200
Statistical Computations at FreeStatistics.org, Office for Research Development and Education, URL https://freestatistics.org/blog/index.php?pk=, Retrieved Wed, 15 May 2024 09:24:16 +0200
QR Codes:

Original text written by user:
IsPrivate?No (this computation is public)
User-defined keywords
Estimated Impact0
Dataseries X:
79,92
80,26
80,69
84,5
85,45
85,87
85,98
86,06
86,19
86,37
86,4
86,43
86,43
86,73
86,84
90,99
92,61
93,27
93,47
93,83
94,01
94,2
94,3
94,53
94,59
94,67
94,69
96,55
97,14
97,32
97,97
98,49
98,76
99,09
99,11
99,17
99,17
99,2
99,54
99,59
99,61
99,68
99,68
99,96
100
100,12
100,38
100,39
100,39
100,75
100,79
100,99
101,03
101,22
101,37
101,38
101,45
101,52
101,84
101,99
104,05
104,49
104,5
104,59
104,61
104,61
104,71
104,8
104,81
104,83
105,06
105,4


Summary of computational transaction
Raw Inputview raw input (R code)
Raw Outputview raw output of R engine
Computing time1 seconds
R Server'Herman Ole Andreas Wold' @ wold.wessa.net

\begin{tabular}{lllllllll}
\hline
Summary of computational transaction \tabularnewline
Raw Input & view raw input (R code)  \tabularnewline
Raw Output & view raw output of R engine  \tabularnewline
Computing time & 1 seconds \tabularnewline
R Server & 'Herman Ole Andreas Wold' @ wold.wessa.net \tabularnewline
\hline
\end{tabular}
%Source: https://freestatistics.org/blog/index.php?pk=&T=0

[TABLE]
[ROW][C]Summary of computational transaction[/C][/ROW]
[ROW][C]Raw Input[/C][C]view raw input (R code) [/C][/ROW]
[ROW][C]Raw Output[/C][C]view raw output of R engine [/C][/ROW]
[ROW][C]Computing time[/C][C]1 seconds[/C][/ROW]
[ROW][C]R Server[/C][C]'Herman Ole Andreas Wold' @ wold.wessa.net[/C][/ROW]
[/TABLE]
Source: https://freestatistics.org/blog/index.php?pk=&T=0

Globally Unique Identifier (entire table): ba.freestatistics.org/blog/index.php?pk=&T=0

As an alternative you can also use a QR Code:  

The GUIDs for individual cells are displayed in the table below:

Summary of computational transaction
Raw Inputview raw input (R code)
Raw Outputview raw output of R engine
Computing time1 seconds
R Server'Herman Ole Andreas Wold' @ wold.wessa.net


Central Tendency - Ungrouped Data
MeasureValueS.E.Value/S.E.
Arithmetic Mean96.54694444444440.819784329793129117.771151430533
Geometric Mean96.289062300908
Harmonic Mean96.0202826893552
Quadratic Mean96.7937382903575
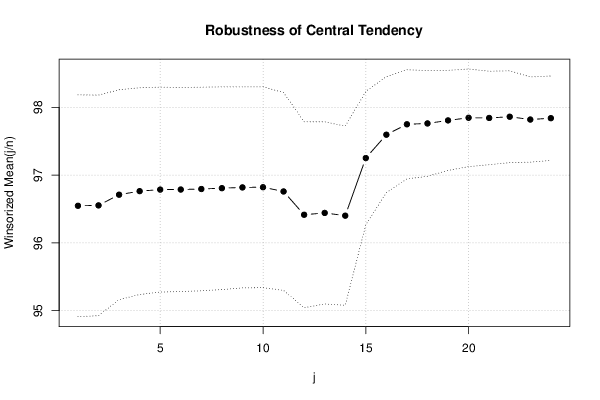
Winsorized Mean ( 1 / 24 )96.54694444444450.817742145128261118.065266685382
Winsorized Mean ( 2 / 24 )96.55250.813500323184691118.687721747935
Winsorized Mean ( 3 / 24 )96.71041666666670.773835827049985124.975367236932
Winsorized Mean ( 4 / 24 )96.76263888888890.762371156744519126.923268322591
Winsorized Mean ( 5 / 24 )96.78555555555560.755429276361508128.119942639394
Winsorized Mean ( 6 / 24 )96.78638888888890.752343373640352128.646562566997
Winsorized Mean ( 7 / 24 )96.79416666666670.75077351217822128.925921195378
Winsorized Mean ( 8 / 24 )96.80638888888890.747548662338962129.498444403602
Winsorized Mean ( 9 / 24 )96.81763888888890.741419711300022130.584117758519
Winsorized Mean ( 10 / 24 )96.82041666666670.740390589658123130.769377702887
Winsorized Mean ( 11 / 24 )96.75777777777780.729844593567608132.573123964389
Winsorized Mean ( 12 / 24 )96.41444444444440.685892604894882140.567843648381
Winsorized Mean ( 13 / 24 )96.44152777777780.671741239925287143.569461045006
Winsorized Mean ( 14 / 24 )96.40069444444450.660464261666392145.958986790927
Winsorized Mean ( 15 / 24 )97.25069444444440.491567202734222197.838045141155
Winsorized Mean ( 16 / 24 )97.59513888888890.427630586313884228.223008391765
Winsorized Mean ( 17 / 24 )97.74861111111110.402306160400543242.970704236274
Winsorized Mean ( 18 / 24 )97.76111111111110.389788150978219250.805754012194
Winsorized Mean ( 19 / 24 )97.80597222222220.368990324976868265.063785150339
Winsorized Mean ( 20 / 24 )97.84486111111110.360078510015011271.732020628035
Winsorized Mean ( 21 / 24 )97.84194444444440.344694963859198283.850809274983
Winsorized Mean ( 22 / 24 )97.86027777777780.338688842351762288.938593601912
Winsorized Mean ( 23 / 24 )97.818750.314288695463652311.238524999105
Winsorized Mean ( 24 / 24 )97.838750.311345201987231314.245247318803
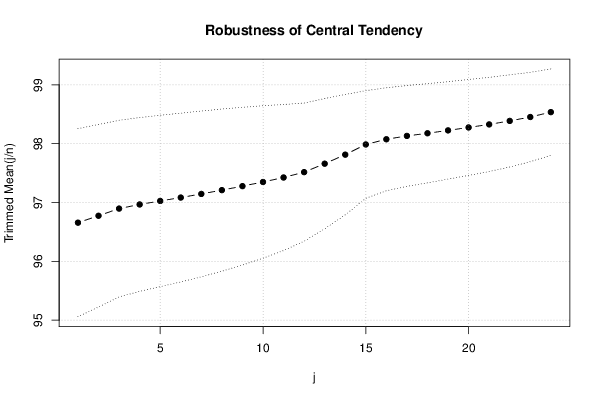
Trimmed Mean ( 1 / 24 )96.6580.798524223688803121.045795647233
Trimmed Mean ( 2 / 24 )96.77558823529410.775414794045726124.804928895369
Trimmed Mean ( 3 / 24 )96.89727272727270.750257222261132129.152069253319
Trimmed Mean ( 4 / 24 )96.967343750.738362531743797131.327551956071
Trimmed Mean ( 5 / 24 )97.02677419354840.727917270237906133.293683445424
Trimmed Mean ( 6 / 24 )97.08466666666670.717071353353609135.3905245449
Trimmed Mean ( 7 / 24 )97.14637931034480.704336266582392137.926135454763
Trimmed Mean ( 8 / 24 )97.21107142857140.688784063129745141.13432152721
Trimmed Mean ( 9 / 24 )97.27851851851850.670081944122055145.174063219944
Trimmed Mean ( 10 / 24 )97.34942307692310.648021435451049150.225621794693
Trimmed Mean ( 11 / 24 )97.42560.620234067732102157.078762790697
Trimmed Mean ( 12 / 24 )97.51666666666670.586984747144774166.131517285602
Trimmed Mean ( 13 / 24 )97.66043478260870.55317772882134176.544408233308
Trimmed Mean ( 14 / 24 )97.81386363636360.511729564867128191.143663278007
Trimmed Mean ( 15 / 24 )97.98690476190480.45725148275097214.295433603374
Trimmed Mean ( 16 / 24 )98.075250.437630564766618224.105119468294
Trimmed Mean ( 17 / 24 )98.13210526315790.42825095969542229.146258850071
Trimmed Mean ( 18 / 24 )98.17722222222220.421318341187292233.023850672047
Trimmed Mean ( 19 / 24 )98.22617647058820.413846358357144237.349379756582
Trimmed Mean ( 20 / 24 )98.27593750.407708698629926241.044495322883
Trimmed Mean ( 21 / 24 )98.32766666666670.40007461468832245.773320917323
Trimmed Mean ( 22 / 24 )98.38714285714290.391801178233688251.114974438541
Trimmed Mean ( 23 / 24 )98.45346153846150.379574637357982259.378398471889
Trimmed Mean ( 24 / 24 )98.536250.366983795252952268.503000063209
Median99.17
Midrange92.66
Midmean - Weighted Average at Xnp98.0445945945946
Midmean - Weighted Average at X(n+1)p98.1772222222222
Midmean - Empirical Distribution Function98.0445945945946
Midmean - Empirical Distribution Function - Averaging98.1772222222222
Midmean - Empirical Distribution Function - Interpolation98.1772222222222
Midmean - Closest Observation98.0445945945946
Midmean - True Basic - Statistics Graphics Toolkit98.1772222222222
Midmean - MS Excel (old versions)98.1321052631579
Number of observations72

\begin{tabular}{lllllllll}
\hline
Central Tendency - Ungrouped Data \tabularnewline
Measure & Value & S.E. & Value/S.E. \tabularnewline
Arithmetic Mean & 96.5469444444444 & 0.819784329793129 & 117.771151430533 \tabularnewline
Geometric Mean & 96.289062300908 &  &  \tabularnewline
Harmonic Mean & 96.0202826893552 &  &  \tabularnewline
Quadratic Mean & 96.7937382903575 &  &  \tabularnewline
Winsorized Mean ( 1 / 24 ) & 96.5469444444445 & 0.817742145128261 & 118.065266685382 \tabularnewline
Winsorized Mean ( 2 / 24 ) & 96.5525 & 0.813500323184691 & 118.687721747935 \tabularnewline
Winsorized Mean ( 3 / 24 ) & 96.7104166666667 & 0.773835827049985 & 124.975367236932 \tabularnewline
Winsorized Mean ( 4 / 24 ) & 96.7626388888889 & 0.762371156744519 & 126.923268322591 \tabularnewline
Winsorized Mean ( 5 / 24 ) & 96.7855555555556 & 0.755429276361508 & 128.119942639394 \tabularnewline
Winsorized Mean ( 6 / 24 ) & 96.7863888888889 & 0.752343373640352 & 128.646562566997 \tabularnewline
Winsorized Mean ( 7 / 24 ) & 96.7941666666667 & 0.75077351217822 & 128.925921195378 \tabularnewline
Winsorized Mean ( 8 / 24 ) & 96.8063888888889 & 0.747548662338962 & 129.498444403602 \tabularnewline
Winsorized Mean ( 9 / 24 ) & 96.8176388888889 & 0.741419711300022 & 130.584117758519 \tabularnewline
Winsorized Mean ( 10 / 24 ) & 96.8204166666667 & 0.740390589658123 & 130.769377702887 \tabularnewline
Winsorized Mean ( 11 / 24 ) & 96.7577777777778 & 0.729844593567608 & 132.573123964389 \tabularnewline
Winsorized Mean ( 12 / 24 ) & 96.4144444444444 & 0.685892604894882 & 140.567843648381 \tabularnewline
Winsorized Mean ( 13 / 24 ) & 96.4415277777778 & 0.671741239925287 & 143.569461045006 \tabularnewline
Winsorized Mean ( 14 / 24 ) & 96.4006944444445 & 0.660464261666392 & 145.958986790927 \tabularnewline
Winsorized Mean ( 15 / 24 ) & 97.2506944444444 & 0.491567202734222 & 197.838045141155 \tabularnewline
Winsorized Mean ( 16 / 24 ) & 97.5951388888889 & 0.427630586313884 & 228.223008391765 \tabularnewline
Winsorized Mean ( 17 / 24 ) & 97.7486111111111 & 0.402306160400543 & 242.970704236274 \tabularnewline
Winsorized Mean ( 18 / 24 ) & 97.7611111111111 & 0.389788150978219 & 250.805754012194 \tabularnewline
Winsorized Mean ( 19 / 24 ) & 97.8059722222222 & 0.368990324976868 & 265.063785150339 \tabularnewline
Winsorized Mean ( 20 / 24 ) & 97.8448611111111 & 0.360078510015011 & 271.732020628035 \tabularnewline
Winsorized Mean ( 21 / 24 ) & 97.8419444444444 & 0.344694963859198 & 283.850809274983 \tabularnewline
Winsorized Mean ( 22 / 24 ) & 97.8602777777778 & 0.338688842351762 & 288.938593601912 \tabularnewline
Winsorized Mean ( 23 / 24 ) & 97.81875 & 0.314288695463652 & 311.238524999105 \tabularnewline
Winsorized Mean ( 24 / 24 ) & 97.83875 & 0.311345201987231 & 314.245247318803 \tabularnewline
Trimmed Mean ( 1 / 24 ) & 96.658 & 0.798524223688803 & 121.045795647233 \tabularnewline
Trimmed Mean ( 2 / 24 ) & 96.7755882352941 & 0.775414794045726 & 124.804928895369 \tabularnewline
Trimmed Mean ( 3 / 24 ) & 96.8972727272727 & 0.750257222261132 & 129.152069253319 \tabularnewline
Trimmed Mean ( 4 / 24 ) & 96.96734375 & 0.738362531743797 & 131.327551956071 \tabularnewline
Trimmed Mean ( 5 / 24 ) & 97.0267741935484 & 0.727917270237906 & 133.293683445424 \tabularnewline
Trimmed Mean ( 6 / 24 ) & 97.0846666666667 & 0.717071353353609 & 135.3905245449 \tabularnewline
Trimmed Mean ( 7 / 24 ) & 97.1463793103448 & 0.704336266582392 & 137.926135454763 \tabularnewline
Trimmed Mean ( 8 / 24 ) & 97.2110714285714 & 0.688784063129745 & 141.13432152721 \tabularnewline
Trimmed Mean ( 9 / 24 ) & 97.2785185185185 & 0.670081944122055 & 145.174063219944 \tabularnewline
Trimmed Mean ( 10 / 24 ) & 97.3494230769231 & 0.648021435451049 & 150.225621794693 \tabularnewline
Trimmed Mean ( 11 / 24 ) & 97.4256 & 0.620234067732102 & 157.078762790697 \tabularnewline
Trimmed Mean ( 12 / 24 ) & 97.5166666666667 & 0.586984747144774 & 166.131517285602 \tabularnewline
Trimmed Mean ( 13 / 24 ) & 97.6604347826087 & 0.55317772882134 & 176.544408233308 \tabularnewline
Trimmed Mean ( 14 / 24 ) & 97.8138636363636 & 0.511729564867128 & 191.143663278007 \tabularnewline
Trimmed Mean ( 15 / 24 ) & 97.9869047619048 & 0.45725148275097 & 214.295433603374 \tabularnewline
Trimmed Mean ( 16 / 24 ) & 98.07525 & 0.437630564766618 & 224.105119468294 \tabularnewline
Trimmed Mean ( 17 / 24 ) & 98.1321052631579 & 0.42825095969542 & 229.146258850071 \tabularnewline
Trimmed Mean ( 18 / 24 ) & 98.1772222222222 & 0.421318341187292 & 233.023850672047 \tabularnewline
Trimmed Mean ( 19 / 24 ) & 98.2261764705882 & 0.413846358357144 & 237.349379756582 \tabularnewline
Trimmed Mean ( 20 / 24 ) & 98.2759375 & 0.407708698629926 & 241.044495322883 \tabularnewline
Trimmed Mean ( 21 / 24 ) & 98.3276666666667 & 0.40007461468832 & 245.773320917323 \tabularnewline
Trimmed Mean ( 22 / 24 ) & 98.3871428571429 & 0.391801178233688 & 251.114974438541 \tabularnewline
Trimmed Mean ( 23 / 24 ) & 98.4534615384615 & 0.379574637357982 & 259.378398471889 \tabularnewline
Trimmed Mean ( 24 / 24 ) & 98.53625 & 0.366983795252952 & 268.503000063209 \tabularnewline
Median & 99.17 &  &  \tabularnewline
Midrange & 92.66 &  &  \tabularnewline
Midmean - Weighted Average at Xnp & 98.0445945945946 &  &  \tabularnewline
Midmean - Weighted Average at X(n+1)p & 98.1772222222222 &  &  \tabularnewline
Midmean - Empirical Distribution Function & 98.0445945945946 &  &  \tabularnewline
Midmean - Empirical Distribution Function - Averaging & 98.1772222222222 &  &  \tabularnewline
Midmean - Empirical Distribution Function - Interpolation & 98.1772222222222 &  &  \tabularnewline
Midmean - Closest Observation & 98.0445945945946 &  &  \tabularnewline
Midmean - True Basic - Statistics Graphics Toolkit & 98.1772222222222 &  &  \tabularnewline
Midmean - MS Excel (old versions) & 98.1321052631579 &  &  \tabularnewline
Number of observations & 72 &  &  \tabularnewline
\hline
\end{tabular}
%Source: https://freestatistics.org/blog/index.php?pk=&T=1

[TABLE]
[ROW][C]Central Tendency - Ungrouped Data[/C][/ROW]
[ROW][C]Measure[/C][C]Value[/C][C]S.E.[/C][C]Value/S.E.[/C][/ROW]
[ROW][C]Arithmetic Mean[/C][C]96.5469444444444[/C][C]0.819784329793129[/C][C]117.771151430533[/C][/ROW]
[ROW][C]Geometric Mean[/C][C]96.289062300908[/C][C][/C][C][/C][/ROW]
[ROW][C]Harmonic Mean[/C][C]96.0202826893552[/C][C][/C][C][/C][/ROW]
[ROW][C]Quadratic Mean[/C][C]96.7937382903575[/C][C][/C][C][/C][/ROW]
[ROW][C]Winsorized Mean ( 1 / 24 )[/C][C]96.5469444444445[/C][C]0.817742145128261[/C][C]118.065266685382[/C][/ROW]
[ROW][C]Winsorized Mean ( 2 / 24 )[/C][C]96.5525[/C][C]0.813500323184691[/C][C]118.687721747935[/C][/ROW]
[ROW][C]Winsorized Mean ( 3 / 24 )[/C][C]96.7104166666667[/C][C]0.773835827049985[/C][C]124.975367236932[/C][/ROW]
[ROW][C]Winsorized Mean ( 4 / 24 )[/C][C]96.7626388888889[/C][C]0.762371156744519[/C][C]126.923268322591[/C][/ROW]
[ROW][C]Winsorized Mean ( 5 / 24 )[/C][C]96.7855555555556[/C][C]0.755429276361508[/C][C]128.119942639394[/C][/ROW]
[ROW][C]Winsorized Mean ( 6 / 24 )[/C][C]96.7863888888889[/C][C]0.752343373640352[/C][C]128.646562566997[/C][/ROW]
[ROW][C]Winsorized Mean ( 7 / 24 )[/C][C]96.7941666666667[/C][C]0.75077351217822[/C][C]128.925921195378[/C][/ROW]
[ROW][C]Winsorized Mean ( 8 / 24 )[/C][C]96.8063888888889[/C][C]0.747548662338962[/C][C]129.498444403602[/C][/ROW]
[ROW][C]Winsorized Mean ( 9 / 24 )[/C][C]96.8176388888889[/C][C]0.741419711300022[/C][C]130.584117758519[/C][/ROW]
[ROW][C]Winsorized Mean ( 10 / 24 )[/C][C]96.8204166666667[/C][C]0.740390589658123[/C][C]130.769377702887[/C][/ROW]
[ROW][C]Winsorized Mean ( 11 / 24 )[/C][C]96.7577777777778[/C][C]0.729844593567608[/C][C]132.573123964389[/C][/ROW]
[ROW][C]Winsorized Mean ( 12 / 24 )[/C][C]96.4144444444444[/C][C]0.685892604894882[/C][C]140.567843648381[/C][/ROW]
[ROW][C]Winsorized Mean ( 13 / 24 )[/C][C]96.4415277777778[/C][C]0.671741239925287[/C][C]143.569461045006[/C][/ROW]
[ROW][C]Winsorized Mean ( 14 / 24 )[/C][C]96.4006944444445[/C][C]0.660464261666392[/C][C]145.958986790927[/C][/ROW]
[ROW][C]Winsorized Mean ( 15 / 24 )[/C][C]97.2506944444444[/C][C]0.491567202734222[/C][C]197.838045141155[/C][/ROW]
[ROW][C]Winsorized Mean ( 16 / 24 )[/C][C]97.5951388888889[/C][C]0.427630586313884[/C][C]228.223008391765[/C][/ROW]
[ROW][C]Winsorized Mean ( 17 / 24 )[/C][C]97.7486111111111[/C][C]0.402306160400543[/C][C]242.970704236274[/C][/ROW]
[ROW][C]Winsorized Mean ( 18 / 24 )[/C][C]97.7611111111111[/C][C]0.389788150978219[/C][C]250.805754012194[/C][/ROW]
[ROW][C]Winsorized Mean ( 19 / 24 )[/C][C]97.8059722222222[/C][C]0.368990324976868[/C][C]265.063785150339[/C][/ROW]
[ROW][C]Winsorized Mean ( 20 / 24 )[/C][C]97.8448611111111[/C][C]0.360078510015011[/C][C]271.732020628035[/C][/ROW]
[ROW][C]Winsorized Mean ( 21 / 24 )[/C][C]97.8419444444444[/C][C]0.344694963859198[/C][C]283.850809274983[/C][/ROW]
[ROW][C]Winsorized Mean ( 22 / 24 )[/C][C]97.8602777777778[/C][C]0.338688842351762[/C][C]288.938593601912[/C][/ROW]
[ROW][C]Winsorized Mean ( 23 / 24 )[/C][C]97.81875[/C][C]0.314288695463652[/C][C]311.238524999105[/C][/ROW]
[ROW][C]Winsorized Mean ( 24 / 24 )[/C][C]97.83875[/C][C]0.311345201987231[/C][C]314.245247318803[/C][/ROW]
[ROW][C]Trimmed Mean ( 1 / 24 )[/C][C]96.658[/C][C]0.798524223688803[/C][C]121.045795647233[/C][/ROW]
[ROW][C]Trimmed Mean ( 2 / 24 )[/C][C]96.7755882352941[/C][C]0.775414794045726[/C][C]124.804928895369[/C][/ROW]
[ROW][C]Trimmed Mean ( 3 / 24 )[/C][C]96.8972727272727[/C][C]0.750257222261132[/C][C]129.152069253319[/C][/ROW]
[ROW][C]Trimmed Mean ( 4 / 24 )[/C][C]96.96734375[/C][C]0.738362531743797[/C][C]131.327551956071[/C][/ROW]
[ROW][C]Trimmed Mean ( 5 / 24 )[/C][C]97.0267741935484[/C][C]0.727917270237906[/C][C]133.293683445424[/C][/ROW]
[ROW][C]Trimmed Mean ( 6 / 24 )[/C][C]97.0846666666667[/C][C]0.717071353353609[/C][C]135.3905245449[/C][/ROW]
[ROW][C]Trimmed Mean ( 7 / 24 )[/C][C]97.1463793103448[/C][C]0.704336266582392[/C][C]137.926135454763[/C][/ROW]
[ROW][C]Trimmed Mean ( 8 / 24 )[/C][C]97.2110714285714[/C][C]0.688784063129745[/C][C]141.13432152721[/C][/ROW]
[ROW][C]Trimmed Mean ( 9 / 24 )[/C][C]97.2785185185185[/C][C]0.670081944122055[/C][C]145.174063219944[/C][/ROW]
[ROW][C]Trimmed Mean ( 10 / 24 )[/C][C]97.3494230769231[/C][C]0.648021435451049[/C][C]150.225621794693[/C][/ROW]
[ROW][C]Trimmed Mean ( 11 / 24 )[/C][C]97.4256[/C][C]0.620234067732102[/C][C]157.078762790697[/C][/ROW]
[ROW][C]Trimmed Mean ( 12 / 24 )[/C][C]97.5166666666667[/C][C]0.586984747144774[/C][C]166.131517285602[/C][/ROW]
[ROW][C]Trimmed Mean ( 13 / 24 )[/C][C]97.6604347826087[/C][C]0.55317772882134[/C][C]176.544408233308[/C][/ROW]
[ROW][C]Trimmed Mean ( 14 / 24 )[/C][C]97.8138636363636[/C][C]0.511729564867128[/C][C]191.143663278007[/C][/ROW]
[ROW][C]Trimmed Mean ( 15 / 24 )[/C][C]97.9869047619048[/C][C]0.45725148275097[/C][C]214.295433603374[/C][/ROW]
[ROW][C]Trimmed Mean ( 16 / 24 )[/C][C]98.07525[/C][C]0.437630564766618[/C][C]224.105119468294[/C][/ROW]
[ROW][C]Trimmed Mean ( 17 / 24 )[/C][C]98.1321052631579[/C][C]0.42825095969542[/C][C]229.146258850071[/C][/ROW]
[ROW][C]Trimmed Mean ( 18 / 24 )[/C][C]98.1772222222222[/C][C]0.421318341187292[/C][C]233.023850672047[/C][/ROW]
[ROW][C]Trimmed Mean ( 19 / 24 )[/C][C]98.2261764705882[/C][C]0.413846358357144[/C][C]237.349379756582[/C][/ROW]
[ROW][C]Trimmed Mean ( 20 / 24 )[/C][C]98.2759375[/C][C]0.407708698629926[/C][C]241.044495322883[/C][/ROW]
[ROW][C]Trimmed Mean ( 21 / 24 )[/C][C]98.3276666666667[/C][C]0.40007461468832[/C][C]245.773320917323[/C][/ROW]
[ROW][C]Trimmed Mean ( 22 / 24 )[/C][C]98.3871428571429[/C][C]0.391801178233688[/C][C]251.114974438541[/C][/ROW]
[ROW][C]Trimmed Mean ( 23 / 24 )[/C][C]98.4534615384615[/C][C]0.379574637357982[/C][C]259.378398471889[/C][/ROW]
[ROW][C]Trimmed Mean ( 24 / 24 )[/C][C]98.53625[/C][C]0.366983795252952[/C][C]268.503000063209[/C][/ROW]
[ROW][C]Median[/C][C]99.17[/C][C][/C][C][/C][/ROW]
[ROW][C]Midrange[/C][C]92.66[/C][C][/C][C][/C][/ROW]
[ROW][C]Midmean - Weighted Average at Xnp[/C][C]98.0445945945946[/C][C][/C][C][/C][/ROW]
[ROW][C]Midmean - Weighted Average at X(n+1)p[/C][C]98.1772222222222[/C][C][/C][C][/C][/ROW]
[ROW][C]Midmean - Empirical Distribution Function[/C][C]98.0445945945946[/C][C][/C][C][/C][/ROW]
[ROW][C]Midmean - Empirical Distribution Function - Averaging[/C][C]98.1772222222222[/C][C][/C][C][/C][/ROW]
[ROW][C]Midmean - Empirical Distribution Function - Interpolation[/C][C]98.1772222222222[/C][C][/C][C][/C][/ROW]
[ROW][C]Midmean - Closest Observation[/C][C]98.0445945945946[/C][C][/C][C][/C][/ROW]
[ROW][C]Midmean - True Basic - Statistics Graphics Toolkit[/C][C]98.1772222222222[/C][C][/C][C][/C][/ROW]
[ROW][C]Midmean - MS Excel (old versions)[/C][C]98.1321052631579[/C][C][/C][C][/C][/ROW]
[ROW][C]Number of observations[/C][C]72[/C][C][/C][C][/C][/ROW]
[/TABLE]
Source: https://freestatistics.org/blog/index.php?pk=&T=1

Globally Unique Identifier (entire table): ba.freestatistics.org/blog/index.php?pk=&T=1

As an alternative you can also use a QR Code:  

The GUIDs for individual cells are displayed in the table below:

Central Tendency - Ungrouped Data
MeasureValueS.E.Value/S.E.
Arithmetic Mean96.54694444444440.819784329793129117.771151430533
Geometric Mean96.289062300908
Harmonic Mean96.0202826893552
Quadratic Mean96.7937382903575
Winsorized Mean ( 1 / 24 )96.54694444444450.817742145128261118.065266685382
Winsorized Mean ( 2 / 24 )96.55250.813500323184691118.687721747935
Winsorized Mean ( 3 / 24 )96.71041666666670.773835827049985124.975367236932
Winsorized Mean ( 4 / 24 )96.76263888888890.762371156744519126.923268322591
Winsorized Mean ( 5 / 24 )96.78555555555560.755429276361508128.119942639394
Winsorized Mean ( 6 / 24 )96.78638888888890.752343373640352128.646562566997
Winsorized Mean ( 7 / 24 )96.79416666666670.75077351217822128.925921195378
Winsorized Mean ( 8 / 24 )96.80638888888890.747548662338962129.498444403602
Winsorized Mean ( 9 / 24 )96.81763888888890.741419711300022130.584117758519
Winsorized Mean ( 10 / 24 )96.82041666666670.740390589658123130.769377702887
Winsorized Mean ( 11 / 24 )96.75777777777780.729844593567608132.573123964389
Winsorized Mean ( 12 / 24 )96.41444444444440.685892604894882140.567843648381
Winsorized Mean ( 13 / 24 )96.44152777777780.671741239925287143.569461045006
Winsorized Mean ( 14 / 24 )96.40069444444450.660464261666392145.958986790927
Winsorized Mean ( 15 / 24 )97.25069444444440.491567202734222197.838045141155
Winsorized Mean ( 16 / 24 )97.59513888888890.427630586313884228.223008391765
Winsorized Mean ( 17 / 24 )97.74861111111110.402306160400543242.970704236274
Winsorized Mean ( 18 / 24 )97.76111111111110.389788150978219250.805754012194
Winsorized Mean ( 19 / 24 )97.80597222222220.368990324976868265.063785150339
Winsorized Mean ( 20 / 24 )97.84486111111110.360078510015011271.732020628035
Winsorized Mean ( 21 / 24 )97.84194444444440.344694963859198283.850809274983
Winsorized Mean ( 22 / 24 )97.86027777777780.338688842351762288.938593601912
Winsorized Mean ( 23 / 24 )97.818750.314288695463652311.238524999105
Winsorized Mean ( 24 / 24 )97.838750.311345201987231314.245247318803
Trimmed Mean ( 1 / 24 )96.6580.798524223688803121.045795647233
Trimmed Mean ( 2 / 24 )96.77558823529410.775414794045726124.804928895369
Trimmed Mean ( 3 / 24 )96.89727272727270.750257222261132129.152069253319
Trimmed Mean ( 4 / 24 )96.967343750.738362531743797131.327551956071
Trimmed Mean ( 5 / 24 )97.02677419354840.727917270237906133.293683445424
Trimmed Mean ( 6 / 24 )97.08466666666670.717071353353609135.3905245449
Trimmed Mean ( 7 / 24 )97.14637931034480.704336266582392137.926135454763
Trimmed Mean ( 8 / 24 )97.21107142857140.688784063129745141.13432152721
Trimmed Mean ( 9 / 24 )97.27851851851850.670081944122055145.174063219944
Trimmed Mean ( 10 / 24 )97.34942307692310.648021435451049150.225621794693
Trimmed Mean ( 11 / 24 )97.42560.620234067732102157.078762790697
Trimmed Mean ( 12 / 24 )97.51666666666670.586984747144774166.131517285602
Trimmed Mean ( 13 / 24 )97.66043478260870.55317772882134176.544408233308
Trimmed Mean ( 14 / 24 )97.81386363636360.511729564867128191.143663278007
Trimmed Mean ( 15 / 24 )97.98690476190480.45725148275097214.295433603374
Trimmed Mean ( 16 / 24 )98.075250.437630564766618224.105119468294
Trimmed Mean ( 17 / 24 )98.13210526315790.42825095969542229.146258850071
Trimmed Mean ( 18 / 24 )98.17722222222220.421318341187292233.023850672047
Trimmed Mean ( 19 / 24 )98.22617647058820.413846358357144237.349379756582
Trimmed Mean ( 20 / 24 )98.27593750.407708698629926241.044495322883
Trimmed Mean ( 21 / 24 )98.32766666666670.40007461468832245.773320917323
Trimmed Mean ( 22 / 24 )98.38714285714290.391801178233688251.114974438541
Trimmed Mean ( 23 / 24 )98.45346153846150.379574637357982259.378398471889
Trimmed Mean ( 24 / 24 )98.536250.366983795252952268.503000063209
Median99.17
Midrange92.66
Midmean - Weighted Average at Xnp98.0445945945946
Midmean - Weighted Average at X(n+1)p98.1772222222222
Midmean - Empirical Distribution Function98.0445945945946
Midmean - Empirical Distribution Function - Averaging98.1772222222222
Midmean - Empirical Distribution Function - Interpolation98.1772222222222
Midmean - Closest Observation98.0445945945946
Midmean - True Basic - Statistics Graphics Toolkit98.1772222222222
Midmean - MS Excel (old versions)98.1321052631579
Number of observations72


Parameters (Session):
Parameters (R input):
R code (references can be found in the software module):
geomean <- function(x) {
return(exp(mean(log(x))))
}
harmean <- function(x) {
return(1/mean(1/x))
}
quamean <- function(x) {
return(sqrt(mean(x*x)))
}
winmean <- function(x) {
x <-sort(x[!is.na(x)])
n<-length(x)
denom <- 3
nodenom <- n/denom
if (nodenom>40) denom <- n/40
sqrtn = sqrt(n)
roundnodenom = floor(nodenom)
win <- array(NA,dim=c(roundnodenom,2))
for (j in 1:roundnodenom) {
win[j,1] <- (j*x[j+1]+sum(x[(j+1):(n-j)])+j*x[n-j])/n
win[j,2] <- sd(c(rep(x[j+1],j),x[(j+1):(n-j)],rep(x[n-j],j)))/sqrtn
}
return(win)
}
trimean <- function(x) {
x <-sort(x[!is.na(x)])
n<-length(x)
denom <- 3
nodenom <- n/denom
if (nodenom>40) denom <- n/40
sqrtn = sqrt(n)
roundnodenom = floor(nodenom)
tri <- array(NA,dim=c(roundnodenom,2))
for (j in 1:roundnodenom) {
tri[j,1] <- mean(x,trim=j/n)
tri[j,2] <- sd(x[(j+1):(n-j)]) / sqrt(n-j*2)
}
return(tri)
}
midrange <- function(x) {
return((max(x)+min(x))/2)
}
q1 <- function(data,n,p,i,f) {
np <- n*p;
i <<- floor(np)
f <<- np - i
qvalue <- (1-f)*data[i] + f*data[i+1]
}
q2 <- function(data,n,p,i,f) {
np <- (n+1)*p
i <<- floor(np)
f <<- np - i
qvalue <- (1-f)*data[i] + f*data[i+1]
}
q3 <- function(data,n,p,i,f) {
np <- n*p
i <<- floor(np)
f <<- np - i
if (f==0) {
qvalue <- data[i]
} else {
qvalue <- data[i+1]
}
}
q4 <- function(data,n,p,i,f) {
np <- n*p
i <<- floor(np)
f <<- np - i
if (f==0) {
qvalue <- (data[i]+data[i+1])/2
} else {
qvalue <- data[i+1]
}
}
q5 <- function(data,n,p,i,f) {
np <- (n-1)*p
i <<- floor(np)
f <<- np - i
if (f==0) {
qvalue <- data[i+1]
} else {
qvalue <- data[i+1] + f*(data[i+2]-data[i+1])
}
}
q6 <- function(data,n,p,i,f) {
np <- n*p+0.5
i <<- floor(np)
f <<- np - i
qvalue <- data[i]
}
q7 <- function(data,n,p,i,f) {
np <- (n+1)*p
i <<- floor(np)
f <<- np - i
if (f==0) {
qvalue <- data[i]
} else {
qvalue <- f*data[i] + (1-f)*data[i+1]
}
}
q8 <- function(data,n,p,i,f) {
np <- (n+1)*p
i <<- floor(np)
f <<- np - i
if (f==0) {
qvalue <- data[i]
} else {
if (f == 0.5) {
qvalue <- (data[i]+data[i+1])/2
} else {
if (f < 0.5) {
qvalue <- data[i]
} else {
qvalue <- data[i+1]
}
}
}
}
midmean <- function(x,def) {
x <-sort(x[!is.na(x)])
n<-length(x)
if (def==1) {
qvalue1 <- q1(x,n,0.25,i,f)
qvalue3 <- q1(x,n,0.75,i,f)
}
if (def==2) {
qvalue1 <- q2(x,n,0.25,i,f)
qvalue3 <- q2(x,n,0.75,i,f)
}
if (def==3) {
qvalue1 <- q3(x,n,0.25,i,f)
qvalue3 <- q3(x,n,0.75,i,f)
}
if (def==4) {
qvalue1 <- q4(x,n,0.25,i,f)
qvalue3 <- q4(x,n,0.75,i,f)
}
if (def==5) {
qvalue1 <- q5(x,n,0.25,i,f)
qvalue3 <- q5(x,n,0.75,i,f)
}
if (def==6) {
qvalue1 <- q6(x,n,0.25,i,f)
qvalue3 <- q6(x,n,0.75,i,f)
}
if (def==7) {
qvalue1 <- q7(x,n,0.25,i,f)
qvalue3 <- q7(x,n,0.75,i,f)
}
if (def==8) {
qvalue1 <- q8(x,n,0.25,i,f)
qvalue3 <- q8(x,n,0.75,i,f)
}
midm <- 0
myn <- 0
roundno4 <- round(n/4)
round3no4 <- round(3*n/4)
for (i in 1:n) {
if ((x[i]>=qvalue1) & (x[i]<=qvalue3)){
midm = midm + x[i]
myn = myn + 1
}
}
midm = midm / myn
return(midm)
}
(arm <- mean(x))
sqrtn <- sqrt(length(x))
(armse <- sd(x) / sqrtn)
(armose <- arm / armse)
(geo <- geomean(x))
(har <- harmean(x))
(qua <- quamean(x))
(win <- winmean(x))
(tri <- trimean(x))
(midr <- midrange(x))
midm <- array(NA,dim=8)
for (j in 1:8) midm[j] <- midmean(x,j)
midm
bitmap(file='test1.png')
lb <- win[,1] - 2*win[,2]
ub <- win[,1] + 2*win[,2]
if ((ylimmin == '') | (ylimmax == '')) plot(win[,1],type='b',main=main, xlab='j', pch=19, ylab='Winsorized Mean(j/n)', ylim=c(min(lb),max(ub))) else plot(win[,1],type='l',main=main, xlab='j', pch=19, ylab='Winsorized Mean(j/n)', ylim=c(ylimmin,ylimmax))
lines(ub,lty=3)
lines(lb,lty=3)
grid()
dev.off()
bitmap(file='test2.png')
lb <- tri[,1] - 2*tri[,2]
ub <- tri[,1] + 2*tri[,2]
if ((ylimmin == '') | (ylimmax == '')) plot(tri[,1],type='b',main=main, xlab='j', pch=19, ylab='Trimmed Mean(j/n)', ylim=c(min(lb),max(ub))) else plot(tri[,1],type='l',main=main, xlab='j', pch=19, ylab='Trimmed Mean(j/n)', ylim=c(ylimmin,ylimmax))
lines(ub,lty=3)
lines(lb,lty=3)
grid()
dev.off()
load(file='createtable')
a<-table.start()
a<-table.row.start(a)
a<-table.element(a,'Central Tendency - Ungrouped Data',4,TRUE)
a<-table.row.end(a)
a<-table.row.start(a)
a<-table.element(a,'Measure',header=TRUE)
a<-table.element(a,'Value',header=TRUE)
a<-table.element(a,'S.E.',header=TRUE)
a<-table.element(a,'Value/S.E.',header=TRUE)
a<-table.row.end(a)
a<-table.row.start(a)
a<-table.element(a,hyperlink('arithmetic_mean.htm', 'Arithmetic Mean', 'click to view the definition of the Arithmetic Mean'),header=TRUE)
a<-table.element(a,arm)
a<-table.element(a,hyperlink('arithmetic_mean_standard_error.htm', armse, 'click to view the definition of the Standard Error of the Arithmetic Mean'))
a<-table.element(a,armose)
a<-table.row.end(a)
a<-table.row.start(a)
a<-table.element(a,hyperlink('geometric_mean.htm', 'Geometric Mean', 'click to view the definition of the Geometric Mean'),header=TRUE)
a<-table.element(a,geo)
a<-table.element(a,'')
a<-table.row.end(a)
a<-table.row.start(a)
a<-table.element(a,hyperlink('harmonic_mean.htm', 'Harmonic Mean', 'click to view the definition of the Harmonic Mean'),header=TRUE)
a<-table.element(a,har)
a<-table.element(a,'')
a<-table.row.end(a)
a<-table.row.start(a)
a<-table.element(a,hyperlink('quadratic_mean.htm', 'Quadratic Mean', 'click to view the definition of the Quadratic Mean'),header=TRUE)
a<-table.element(a,qua)
a<-table.element(a,'')
a<-table.row.end(a)
for (j in 1:length(win[,1])) {
a<-table.row.start(a)
mylabel <- paste('Winsorized Mean (',j)
mylabel <- paste(mylabel,'/')
mylabel <- paste(mylabel,length(win[,1]))
mylabel <- paste(mylabel,')')
a<-table.element(a,hyperlink('winsorized_mean.htm', mylabel, 'click to view the definition of the Winsorized Mean'),header=TRUE)
a<-table.element(a,win[j,1])
a<-table.element(a,win[j,2])
a<-table.element(a,win[j,1]/win[j,2])
a<-table.row.end(a)
}
for (j in 1:length(tri[,1])) {
a<-table.row.start(a)
mylabel <- paste('Trimmed Mean (',j)
mylabel <- paste(mylabel,'/')
mylabel <- paste(mylabel,length(tri[,1]))
mylabel <- paste(mylabel,')')
a<-table.element(a,hyperlink('arithmetic_mean.htm', mylabel, 'click to view the definition of the Trimmed Mean'),header=TRUE)
a<-table.element(a,tri[j,1])
a<-table.element(a,tri[j,2])
a<-table.element(a,tri[j,1]/tri[j,2])
a<-table.row.end(a)
}
a<-table.row.start(a)
a<-table.element(a,hyperlink('median_1.htm', 'Median', 'click to view the definition of the Median'),header=TRUE)
a<-table.element(a,median(x))
a<-table.element(a,'')
a<-table.row.end(a)
a<-table.row.start(a)
a<-table.element(a,hyperlink('midrange.htm', 'Midrange', 'click to view the definition of the Midrange'),header=TRUE)
a<-table.element(a,midr)
a<-table.element(a,'')
a<-table.row.end(a)
a<-table.row.start(a)
mymid <- hyperlink('midmean.htm', 'Midmean', 'click to view the definition of the Midmean')
mylabel <- paste(mymid,hyperlink('method_1.htm','Weighted Average at Xnp',''),sep=' - ')
a<-table.element(a,mylabel,header=TRUE)
a<-table.element(a,midm[1])
a<-table.element(a,'')
a<-table.row.end(a)
a<-table.row.start(a)
mymid <- hyperlink('midmean.htm', 'Midmean', 'click to view the definition of the Midmean')
mylabel <- paste(mymid,hyperlink('method_2.htm','Weighted Average at X(n+1)p',''),sep=' - ')
a<-table.element(a,mylabel,header=TRUE)
a<-table.element(a,midm[2])
a<-table.element(a,'')
a<-table.row.end(a)
a<-table.row.start(a)
mymid <- hyperlink('midmean.htm', 'Midmean', 'click to view the definition of the Midmean')
mylabel <- paste(mymid,hyperlink('method_3.htm','Empirical Distribution Function',''),sep=' - ')
a<-table.element(a,mylabel,header=TRUE)
a<-table.element(a,midm[3])
a<-table.element(a,'')
a<-table.row.end(a)
a<-table.row.start(a)
mymid <- hyperlink('midmean.htm', 'Midmean', 'click to view the definition of the Midmean')
mylabel <- paste(mymid,hyperlink('method_4.htm','Empirical Distribution Function - Averaging',''),sep=' - ')
a<-table.element(a,mylabel,header=TRUE)
a<-table.element(a,midm[4])
a<-table.element(a,'')
a<-table.row.end(a)
a<-table.row.start(a)
mymid <- hyperlink('midmean.htm', 'Midmean', 'click to view the definition of the Midmean')
mylabel <- paste(mymid,hyperlink('method_5.htm','Empirical Distribution Function - Interpolation',''),sep=' - ')
a<-table.element(a,mylabel,header=TRUE)
a<-table.element(a,midm[5])
a<-table.element(a,'')
a<-table.row.end(a)
a<-table.row.start(a)
mymid <- hyperlink('midmean.htm', 'Midmean', 'click to view the definition of the Midmean')
mylabel <- paste(mymid,hyperlink('method_6.htm','Closest Observation',''),sep=' - ')
a<-table.element(a,mylabel,header=TRUE)
a<-table.element(a,midm[6])
a<-table.element(a,'')
a<-table.row.end(a)
a<-table.row.start(a)
mymid <- hyperlink('midmean.htm', 'Midmean', 'click to view the definition of the Midmean')
mylabel <- paste(mymid,hyperlink('method_7.htm','True Basic - Statistics Graphics Toolkit',''),sep=' - ')
a<-table.element(a,mylabel,header=TRUE)
a<-table.element(a,midm[7])
a<-table.element(a,'')
a<-table.row.end(a)
a<-table.row.start(a)
mymid <- hyperlink('midmean.htm', 'Midmean', 'click to view the definition of the Midmean')
mylabel <- paste(mymid,hyperlink('method_8.htm','MS Excel (old versions)',''),sep=' - ')
a<-table.element(a,mylabel,header=TRUE)
a<-table.element(a,midm[8])
a<-table.element(a,'')
a<-table.row.end(a)
a<-table.row.start(a)
a<-table.element(a,'Number of observations',header=TRUE)
a<-table.element(a,length(x))
a<-table.element(a,'')
a<-table.row.end(a)
a<-table.end(a)
table.save(a,file='mytable.tab')