Free Statistics

of Irreproducible Research!

Author's title

Author*Unverified author*
R Software Modulerwasp_harrell_davis.wasp
Title produced by softwareHarrell-Davis Quantiles
Date of computationSat, 11 Mar 2017 13:41:16 +0000
Cite this page as followsStatistical Computations at FreeStatistics.org, Office for Research Development and Education, URL https://freestatistics.org/blog/index.php?v=date/2017/Mar/11/t14892397426x113xv4gfzq3mi.htm/, Retrieved Tue, 14 May 2024 05:27:35 +0200
Statistical Computations at FreeStatistics.org, Office for Research Development and Education, URL https://freestatistics.org/blog/index.php?pk=, Retrieved Tue, 14 May 2024 05:27:35 +0200
QR Codes:

Original text written by user:
IsPrivate?No (this computation is public)
User-defined keywords
Estimated Impact0
Dataseries X:
92.76
93.12
93.6
93.24
93.4
93.32
93.13
93.19
93.84
94.01
93.78
93.47
93.6
92.85
92.91
92.29
92.5
93.1
92.86
93.19
93.73
93.88
93.85
93.45
93.43
93.59
95.28
94.95
94.49
94.45
94.35
95.52
96.89
97.54
97.65
97.35
98.2
99.46
100.35
99.72
99.69
99.62
99.77
100.19
100.82
100.36
101.08
100.73
101.51
102.12
102.88
103.47
103.53
103.67
103.68
103.76
103.67
103.01
103.39
103.43
103.4
104.8


Summary of computational transaction
Raw Inputview raw input (R code)
Raw Outputview raw output of R engine
Computing time1 seconds
R Server'Herman Ole Andreas Wold' @ wold.wessa.net

\begin{tabular}{lllllllll}
\hline
Summary of computational transaction \tabularnewline
Raw Input & view raw input (R code)  \tabularnewline
Raw Output & view raw output of R engine  \tabularnewline
Computing time & 1 seconds \tabularnewline
R Server & 'Herman Ole Andreas Wold' @ wold.wessa.net \tabularnewline
\hline
\end{tabular}
%Source: https://freestatistics.org/blog/index.php?pk=&T=0

[TABLE]
[ROW][C]Summary of computational transaction[/C][/ROW]
[ROW][C]Raw Input[/C][C]view raw input (R code) [/C][/ROW]
[ROW][C]Raw Output[/C][C]view raw output of R engine [/C][/ROW]
[ROW][C]Computing time[/C][C]1 seconds[/C][/ROW]
[ROW][C]R Server[/C][C]'Herman Ole Andreas Wold' @ wold.wessa.net[/C][/ROW]
[/TABLE]
Source: https://freestatistics.org/blog/index.php?pk=&T=0

Globally Unique Identifier (entire table): ba.freestatistics.org/blog/index.php?pk=&T=0

As an alternative you can also use a QR Code:  

The GUIDs for individual cells are displayed in the table below:

Summary of computational transaction
Raw Inputview raw input (R code)
Raw Outputview raw output of R engine
Computing time1 seconds
R Server'Herman Ole Andreas Wold' @ wold.wessa.net


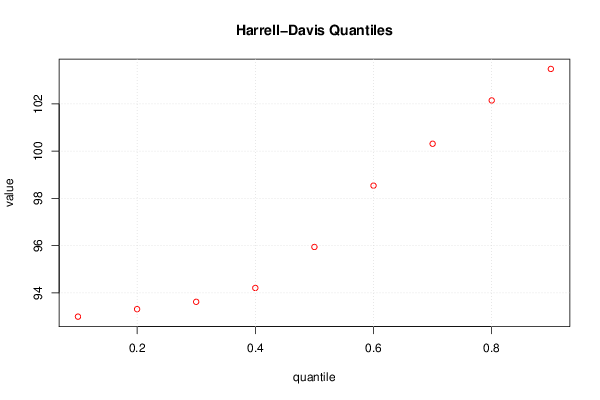
Harrell-Davis Quantiles
quantilesvaluestandard error
0.192.99620719171460.134200564945889
0.293.31314139423480.136930482262164
0.393.62445844419430.190305427024753
0.494.21042113028230.578510155856687
0.595.94625768243271.47250864655728
0.698.5413989985031.35630452795635
0.7100.31372808840.771963961740655
0.8102.146551462981.00206519657321
0.9103.4797054331530.206308502170555

\begin{tabular}{lllllllll}
\hline
Harrell-Davis Quantiles \tabularnewline
quantiles & value & standard error \tabularnewline
0.1 & 92.9962071917146 & 0.134200564945889 \tabularnewline
0.2 & 93.3131413942348 & 0.136930482262164 \tabularnewline
0.3 & 93.6244584441943 & 0.190305427024753 \tabularnewline
0.4 & 94.2104211302823 & 0.578510155856687 \tabularnewline
0.5 & 95.9462576824327 & 1.47250864655728 \tabularnewline
0.6 & 98.541398998503 & 1.35630452795635 \tabularnewline
0.7 & 100.3137280884 & 0.771963961740655 \tabularnewline
0.8 & 102.14655146298 & 1.00206519657321 \tabularnewline
0.9 & 103.479705433153 & 0.206308502170555 \tabularnewline
\hline
\end{tabular}
%Source: https://freestatistics.org/blog/index.php?pk=&T=1

[TABLE]
[ROW][C]Harrell-Davis Quantiles[/C][/ROW]
[ROW][C]quantiles[/C][C]value[/C][C]standard error[/C][/ROW]
[ROW][C]0.1[/C][C]92.9962071917146[/C][C]0.134200564945889[/C][/ROW]
[ROW][C]0.2[/C][C]93.3131413942348[/C][C]0.136930482262164[/C][/ROW]
[ROW][C]0.3[/C][C]93.6244584441943[/C][C]0.190305427024753[/C][/ROW]
[ROW][C]0.4[/C][C]94.2104211302823[/C][C]0.578510155856687[/C][/ROW]
[ROW][C]0.5[/C][C]95.9462576824327[/C][C]1.47250864655728[/C][/ROW]
[ROW][C]0.6[/C][C]98.541398998503[/C][C]1.35630452795635[/C][/ROW]
[ROW][C]0.7[/C][C]100.3137280884[/C][C]0.771963961740655[/C][/ROW]
[ROW][C]0.8[/C][C]102.14655146298[/C][C]1.00206519657321[/C][/ROW]
[ROW][C]0.9[/C][C]103.479705433153[/C][C]0.206308502170555[/C][/ROW]
[/TABLE]
Source: https://freestatistics.org/blog/index.php?pk=&T=1

Globally Unique Identifier (entire table): ba.freestatistics.org/blog/index.php?pk=&T=1

As an alternative you can also use a QR Code:  

The GUIDs for individual cells are displayed in the table below:

Harrell-Davis Quantiles
quantilesvaluestandard error
0.192.99620719171460.134200564945889
0.293.31314139423480.136930482262164
0.393.62445844419430.190305427024753
0.494.21042113028230.578510155856687
0.595.94625768243271.47250864655728
0.698.5413989985031.35630452795635
0.7100.31372808840.771963961740655
0.8102.146551462981.00206519657321
0.9103.4797054331530.206308502170555


Parameters (Session):
par1 = 0.1 ; par2 = 0.9 ; par3 = 0.1 ;
Parameters (R input):
par1 = 0.1 ; par2 = 0.9 ; par3 = 0.1 ;
R code (references can be found in the software module):
par3 <- '0.1'
par2 <- '0.9'
par1 <- '0.1'
par1 <- as(par1,'numeric')
par2 <- as(par2,'numeric')
par3 <- as(par3,'numeric')
library(Hmisc)
myseq <- seq(par1, par2, par3)
hd <- hdquantile(x, probs = myseq, se = TRUE, na.rm = FALSE, names = TRUE, weights=FALSE)
bitmap(file='test1.png')
plot(myseq,hd,col=2,main=main,xlab=xlab,ylab=ylab)
grid()
dev.off()
load(file='createtable')
a<-table.start()
a<-table.row.start(a)
a<-table.element(a,'Harrell-Davis Quantiles',3,TRUE)
a<-table.row.end(a)
a<-table.row.start(a)
a<-table.element(a,'quantiles',header=TRUE)
a<-table.element(a,'value',header=TRUE)
a<-table.element(a,'standard error',header=TRUE)
a<-table.row.end(a)
length(hd)
for (i in 1:length(hd))
{
a<-table.row.start(a)
a<-table.element(a,as(labels(hd)[i],'numeric'),header=TRUE)
a<-table.element(a,as.matrix(hd[i])[1,1])
a<-table.element(a,as.matrix(attr(hd,'se')[i])[1,1])
a<-table.row.end(a)
}
a<-table.end(a)
table.save(a,file='mytable.tab')