Free Statistics

of Irreproducible Research!

Author's title

Author*Unverified author*
R Software Modulerwasp_harrell_davis.wasp
Title produced by softwareHarrell-Davis Quantiles
Date of computationSat, 11 Mar 2017 15:04:14 +0000
Cite this page as followsStatistical Computations at FreeStatistics.org, Office for Research Development and Education, URL https://freestatistics.org/blog/index.php?v=date/2017/Mar/11/t1489244781kcfyukdfcnyabhk.htm/, Retrieved Tue, 14 May 2024 02:46:41 +0200
Statistical Computations at FreeStatistics.org, Office for Research Development and Education, URL https://freestatistics.org/blog/index.php?pk=, Retrieved Tue, 14 May 2024 02:46:41 +0200
QR Codes:

Original text written by user:
IsPrivate?No (this computation is public)
User-defined keywords
Estimated Impact0
Dataseries X:
86.88
90.65
90.68
89.64
102.62
101.84
92.51
94.29
94.68
96.94
94.03
89.65
84.9
89.07
89.8
93.22
92.23
98.41
96.63
89.8
90
92.13
93.27
90.81
85.42
88.28
88.73
90.18
92.74
96.13
94.85
94.25
96.94
101.22
98.71
95.51
93.91
98.17
97.59
99.64
107.88
108.49
100.25
99.27
101.73
101.25
97.09
94.74
94.53
93.48
96.05
106.22
98.33
99.86
93.78
88.96
83.77
89.46
86.78
88.4
87.19
92.23
95.99
104.75
105.63
108.71
96.4
93.31
93.77
98.7
95.04
95.61


Summary of computational transaction
Raw Inputview raw input (R code)
Raw Outputview raw output of R engine
Computing time1 seconds
R Server'Sir Maurice George Kendall' @ kendall.wessa.net

\begin{tabular}{lllllllll}
\hline
Summary of computational transaction \tabularnewline
Raw Input & view raw input (R code)  \tabularnewline
Raw Output & view raw output of R engine  \tabularnewline
Computing time & 1 seconds \tabularnewline
R Server & 'Sir Maurice George Kendall' @ kendall.wessa.net \tabularnewline
\hline
\end{tabular}
%Source: https://freestatistics.org/blog/index.php?pk=&T=0

[TABLE]
[ROW][C]Summary of computational transaction[/C][/ROW]
[ROW][C]Raw Input[/C][C]view raw input (R code) [/C][/ROW]
[ROW][C]Raw Output[/C][C]view raw output of R engine [/C][/ROW]
[ROW][C]Computing time[/C][C]1 seconds[/C][/ROW]
[ROW][C]R Server[/C][C]'Sir Maurice George Kendall' @ kendall.wessa.net[/C][/ROW]
[/TABLE]
Source: https://freestatistics.org/blog/index.php?pk=&T=0

Globally Unique Identifier (entire table): ba.freestatistics.org/blog/index.php?pk=&T=0

As an alternative you can also use a QR Code:  

The GUIDs for individual cells are displayed in the table below:

Summary of computational transaction
Raw Inputview raw input (R code)
Raw Outputview raw output of R engine
Computing time1 seconds
R Server'Sir Maurice George Kendall' @ kendall.wessa.net


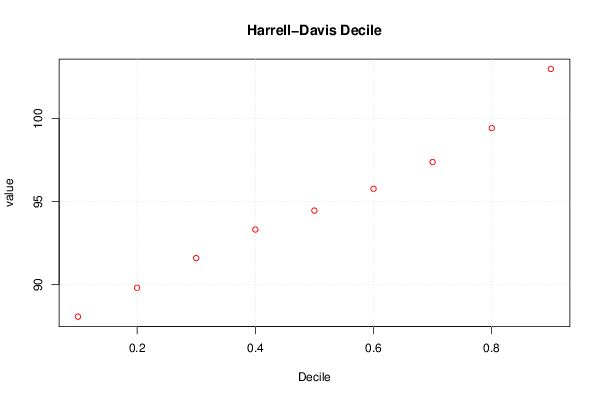
Harrell-Davis Quantiles
quantilesvaluestandard error
0.188.07932179080270.833226226895435
0.289.81809012159530.579795811240612
0.391.60152617669571.05847613775647
0.493.32243436461350.68161912536507
0.594.4604597688590.620375230548895
0.695.7710257804680.780297409295604
0.797.38183220656780.900092567009653
0.899.42830398963571.03201030059089
0.9102.9841528285131.74113929617927

\begin{tabular}{lllllllll}
\hline
Harrell-Davis Quantiles \tabularnewline
quantiles & value & standard error \tabularnewline
0.1 & 88.0793217908027 & 0.833226226895435 \tabularnewline
0.2 & 89.8180901215953 & 0.579795811240612 \tabularnewline
0.3 & 91.6015261766957 & 1.05847613775647 \tabularnewline
0.4 & 93.3224343646135 & 0.68161912536507 \tabularnewline
0.5 & 94.460459768859 & 0.620375230548895 \tabularnewline
0.6 & 95.771025780468 & 0.780297409295604 \tabularnewline
0.7 & 97.3818322065678 & 0.900092567009653 \tabularnewline
0.8 & 99.4283039896357 & 1.03201030059089 \tabularnewline
0.9 & 102.984152828513 & 1.74113929617927 \tabularnewline
\hline
\end{tabular}
%Source: https://freestatistics.org/blog/index.php?pk=&T=1

[TABLE]
[ROW][C]Harrell-Davis Quantiles[/C][/ROW]
[ROW][C]quantiles[/C][C]value[/C][C]standard error[/C][/ROW]
[ROW][C]0.1[/C][C]88.0793217908027[/C][C]0.833226226895435[/C][/ROW]
[ROW][C]0.2[/C][C]89.8180901215953[/C][C]0.579795811240612[/C][/ROW]
[ROW][C]0.3[/C][C]91.6015261766957[/C][C]1.05847613775647[/C][/ROW]
[ROW][C]0.4[/C][C]93.3224343646135[/C][C]0.68161912536507[/C][/ROW]
[ROW][C]0.5[/C][C]94.460459768859[/C][C]0.620375230548895[/C][/ROW]
[ROW][C]0.6[/C][C]95.771025780468[/C][C]0.780297409295604[/C][/ROW]
[ROW][C]0.7[/C][C]97.3818322065678[/C][C]0.900092567009653[/C][/ROW]
[ROW][C]0.8[/C][C]99.4283039896357[/C][C]1.03201030059089[/C][/ROW]
[ROW][C]0.9[/C][C]102.984152828513[/C][C]1.74113929617927[/C][/ROW]
[/TABLE]
Source: https://freestatistics.org/blog/index.php?pk=&T=1

Globally Unique Identifier (entire table): ba.freestatistics.org/blog/index.php?pk=&T=1

As an alternative you can also use a QR Code:  

The GUIDs for individual cells are displayed in the table below:

Harrell-Davis Quantiles
quantilesvaluestandard error
0.188.07932179080270.833226226895435
0.289.81809012159530.579795811240612
0.391.60152617669571.05847613775647
0.493.32243436461350.68161912536507
0.594.4604597688590.620375230548895
0.695.7710257804680.780297409295604
0.797.38183220656780.900092567009653
0.899.42830398963571.03201030059089
0.9102.9841528285131.74113929617927


Parameters (Session):
par1 = 0.1 ; par2 = 0.9 ; par3 = 0.1 ;
Parameters (R input):
par1 = 0.1 ; par2 = 0.9 ; par3 = 0.1 ;
R code (references can be found in the software module):
par3 <- '0.1'
par2 <- '0.9'
par1 <- '0.1'
par1 <- as(par1,'numeric')
par2 <- as(par2,'numeric')
par3 <- as(par3,'numeric')
library(Hmisc)
myseq <- seq(par1, par2, par3)
hd <- hdquantile(x, probs = myseq, se = TRUE, na.rm = FALSE, names = TRUE, weights=FALSE)
bitmap(file='test1.png')
plot(myseq,hd,col=2,main=main,xlab=xlab,ylab=ylab)
grid()
dev.off()
load(file='createtable')
a<-table.start()
a<-table.row.start(a)
a<-table.element(a,'Harrell-Davis Quantiles',3,TRUE)
a<-table.row.end(a)
a<-table.row.start(a)
a<-table.element(a,'quantiles',header=TRUE)
a<-table.element(a,'value',header=TRUE)
a<-table.element(a,'standard error',header=TRUE)
a<-table.row.end(a)
length(hd)
for (i in 1:length(hd))
{
a<-table.row.start(a)
a<-table.element(a,as(labels(hd)[i],'numeric'),header=TRUE)
a<-table.element(a,as.matrix(hd[i])[1,1])
a<-table.element(a,as.matrix(attr(hd,'se')[i])[1,1])
a<-table.row.end(a)
}
a<-table.end(a)
table.save(a,file='mytable.tab')