Free Statistics

of Irreproducible Research!

Author's title

Author*Unverified author*
R Software Modulerwasp_centraltendency.wasp
Title produced by softwareCentral Tendency
Date of computationMon, 13 Mar 2017 22:26:05 +0000
Cite this page as followsStatistical Computations at FreeStatistics.org, Office for Research Development and Education, URL https://freestatistics.org/blog/index.php?v=date/2017/Mar/13/t148944407631h6zgcd3m4huxu.htm/, Retrieved Tue, 14 May 2024 12:16:59 +0200
Statistical Computations at FreeStatistics.org, Office for Research Development and Education, URL https://freestatistics.org/blog/index.php?pk=, Retrieved Tue, 14 May 2024 12:16:59 +0200
QR Codes:

Original text written by user:
IsPrivate?No (this computation is public)
User-defined keywords
Estimated Impact0
Dataseries X:
88
90
82
75
79
70
71
75
89
92
94
90
102
98
100
98
100
91
93
92
106
109
108
108
118
119
124
118
119
113
114
115
125
125
118
122
132
133
136
128
126
114
108
107
117
119
113
114
124
125
124
118
111
99
94
93
107
107
103
97
103
107
104
101
92
85
83
77
90
87
87
78


Summary of computational transaction
Raw Inputview raw input (R code)
Raw Outputview raw output of R engine
Computing time2 seconds
R Server'Herman Ole Andreas Wold' @ wold.wessa.net

\begin{tabular}{lllllllll}
\hline
Summary of computational transaction \tabularnewline
Raw Input & view raw input (R code)  \tabularnewline
Raw Output & view raw output of R engine  \tabularnewline
Computing time & 2 seconds \tabularnewline
R Server & 'Herman Ole Andreas Wold' @ wold.wessa.net \tabularnewline
\hline
\end{tabular}
%Source: https://freestatistics.org/blog/index.php?pk=&T=0

[TABLE]
[ROW][C]Summary of computational transaction[/C][/ROW]
[ROW][C]Raw Input[/C][C]view raw input (R code) [/C][/ROW]
[ROW][C]Raw Output[/C][C]view raw output of R engine [/C][/ROW]
[ROW][C]Computing time[/C][C]2 seconds[/C][/ROW]
[ROW][C]R Server[/C][C]'Herman Ole Andreas Wold' @ wold.wessa.net[/C][/ROW]
[/TABLE]
Source: https://freestatistics.org/blog/index.php?pk=&T=0

Globally Unique Identifier (entire table): ba.freestatistics.org/blog/index.php?pk=&T=0

As an alternative you can also use a QR Code:  

The GUIDs for individual cells are displayed in the table below:

Summary of computational transaction
Raw Inputview raw input (R code)
Raw Outputview raw output of R engine
Computing time2 seconds
R Server'Herman Ole Andreas Wold' @ wold.wessa.net


Central Tendency - Ungrouped Data
MeasureValueS.E.Value/S.E.
Arithmetic Mean103.7916666666671.9305161500577553.7636873245333
Geometric Mean102.471561514799
Harmonic Mean101.109542202616
Quadratic Mean105.058647642374
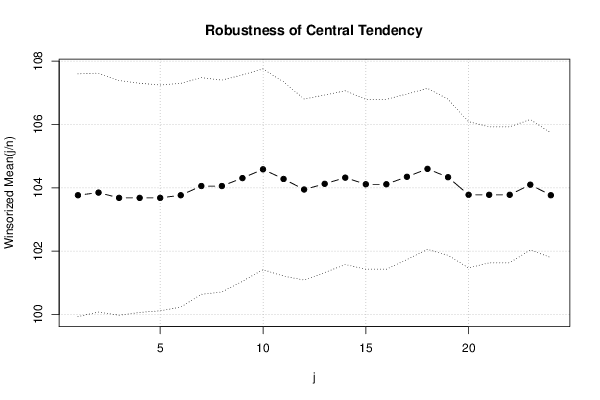
Winsorized Mean ( 1 / 24 )103.7638888888891.9177628071504754.1067375496074
Winsorized Mean ( 2 / 24 )103.8472222222221.8865162478216555.0470860466397
Winsorized Mean ( 3 / 24 )103.6805555555561.8535828340612455.9352156538855
Winsorized Mean ( 4 / 24 )103.6805555555561.8100124059190757.2816822782547
Winsorized Mean ( 5 / 24 )103.6805555555561.7838857014859258.120627049812
Winsorized Mean ( 6 / 24 )103.7638888888891.7672128059595958.7161254937521
Winsorized Mean ( 7 / 24 )104.0555555555561.7119309866370760.7825644653836
Winsorized Mean ( 8 / 24 )104.0555555555561.673096621222862.193392919236
Winsorized Mean ( 9 / 24 )104.3055555555561.6300723037729863.9882999754853
Winsorized Mean ( 10 / 24 )104.5833333333331.5851854746512765.9754552421323
Winsorized Mean ( 11 / 24 )104.2777777777781.5339433138389767.9802029429651
Winsorized Mean ( 12 / 24 )103.9444444444441.4297434147285572.7014675316264
Winsorized Mean ( 13 / 24 )104.1251.4018400466643674.2773758302617
Winsorized Mean ( 14 / 24 )104.3194444444441.3727772457849675.991530865442
Winsorized Mean ( 15 / 24 )104.1111111111111.3418967311502877.5850396638692
Winsorized Mean ( 16 / 24 )104.1111111111111.3418967311502877.5850396638692
Winsorized Mean ( 17 / 24 )104.3472222222221.3074302708873279.8109272408116
Winsorized Mean ( 18 / 24 )104.5972222222221.2720142434781182.2295998323245
Winsorized Mean ( 19 / 24 )104.3333333333331.2333396776895684.5941594360958
Winsorized Mean ( 20 / 24 )103.7777777777781.1550769443410689.8449045201745
Winsorized Mean ( 21 / 24 )103.7777777777781.0739886282635296.6283767320428
Winsorized Mean ( 22 / 24 )103.7777777777781.0739886282635296.6283767320428
Winsorized Mean ( 23 / 24 )104.0972222222221.02933493468121101.130563740617
Winsorized Mean ( 24 / 24 )103.7638888888890.984721518658796105.373841154824
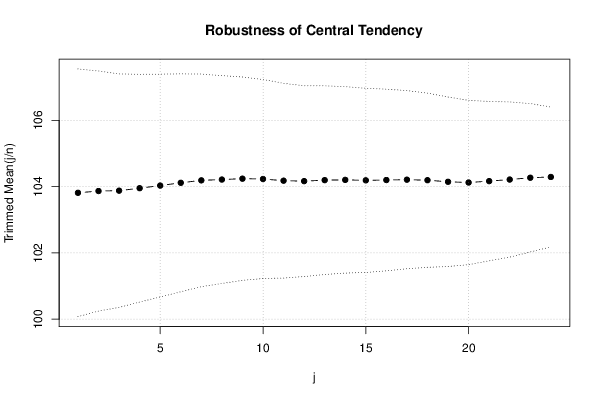
Trimmed Mean ( 1 / 24 )103.8142857142861.8690342339724655.5443468221757
Trimmed Mean ( 2 / 24 )103.8676470588241.8110848338984957.3510666726974
Trimmed Mean ( 3 / 24 )103.8787878787881.7620071135796958.9548061856277
Trimmed Mean ( 4 / 24 )103.9531251.7181670638432760.502338327609
Trimmed Mean ( 5 / 24 )104.0322580645161.6812286405784861.8787091497088
Trimmed Mean ( 6 / 24 )104.1166666666671.644386387482363.3164245698228
Trimmed Mean ( 7 / 24 )104.1896551724141.6039230671748164.9592597704429
Trimmed Mean ( 8 / 24 )104.2142857142861.5687107548181166.4330791346995
Trimmed Mean ( 9 / 24 )104.2407407407411.5343573249242567.937721577265
Trimmed Mean ( 10 / 24 )104.2307692307691.5012853679831269.4276860706348
Trimmed Mean ( 11 / 24 )104.181.4693299875265970.9030652640338
Trimmed Mean ( 12 / 24 )104.1666666666671.4397883676899372.348595810506
Trimmed Mean ( 13 / 24 )104.1956521739131.423617072902173.1907857507679
Trimmed Mean ( 14 / 24 )104.2045454545451.4069367357069674.0648408772868
Trimmed Mean ( 15 / 24 )104.1904761904761.3894567723494574.9864826771827
Trimmed Mean ( 16 / 24 )104.21.3710374136921276.0008435651624
Trimmed Mean ( 17 / 24 )104.2105263157891.344160699776477.5283240561375
Trimmed Mean ( 18 / 24 )104.1944444444441.3140386337030679.293288471144
Trimmed Mean ( 19 / 24 )104.1470588235291.2792965096528481.4096325892357
Trimmed Mean ( 20 / 24 )104.1251.2392684496599584.0213434212509
Trimmed Mean ( 21 / 24 )104.1666666666671.2025674959749686.6202246570914
Trimmed Mean ( 22 / 24 )104.2142857142861.1710316787959988.9935666142136
Trimmed Mean ( 23 / 24 )104.2692307692311.119831982325593.1114956662518
Trimmed Mean ( 24 / 24 )104.2916666666671.0554880158916298.8089538644046
Median105
Midrange103
Midmean - Weighted Average at Xnp104.9
Midmean - Weighted Average at X(n+1)p105.25641025641
Midmean - Empirical Distribution Function104.9
Midmean - Empirical Distribution Function - Averaging105.25641025641
Midmean - Empirical Distribution Function - Interpolation105.25641025641
Midmean - Closest Observation104.9
Midmean - True Basic - Statistics Graphics Toolkit105.25641025641
Midmean - MS Excel (old versions)104.9
Number of observations72

\begin{tabular}{lllllllll}
\hline
Central Tendency - Ungrouped Data \tabularnewline
Measure & Value & S.E. & Value/S.E. \tabularnewline
Arithmetic Mean & 103.791666666667 & 1.93051615005775 & 53.7636873245333 \tabularnewline
Geometric Mean & 102.471561514799 &  &  \tabularnewline
Harmonic Mean & 101.109542202616 &  &  \tabularnewline
Quadratic Mean & 105.058647642374 &  &  \tabularnewline
Winsorized Mean ( 1 / 24 ) & 103.763888888889 & 1.91776280715047 & 54.1067375496074 \tabularnewline
Winsorized Mean ( 2 / 24 ) & 103.847222222222 & 1.88651624782165 & 55.0470860466397 \tabularnewline
Winsorized Mean ( 3 / 24 ) & 103.680555555556 & 1.85358283406124 & 55.9352156538855 \tabularnewline
Winsorized Mean ( 4 / 24 ) & 103.680555555556 & 1.81001240591907 & 57.2816822782547 \tabularnewline
Winsorized Mean ( 5 / 24 ) & 103.680555555556 & 1.78388570148592 & 58.120627049812 \tabularnewline
Winsorized Mean ( 6 / 24 ) & 103.763888888889 & 1.76721280595959 & 58.7161254937521 \tabularnewline
Winsorized Mean ( 7 / 24 ) & 104.055555555556 & 1.71193098663707 & 60.7825644653836 \tabularnewline
Winsorized Mean ( 8 / 24 ) & 104.055555555556 & 1.6730966212228 & 62.193392919236 \tabularnewline
Winsorized Mean ( 9 / 24 ) & 104.305555555556 & 1.63007230377298 & 63.9882999754853 \tabularnewline
Winsorized Mean ( 10 / 24 ) & 104.583333333333 & 1.58518547465127 & 65.9754552421323 \tabularnewline
Winsorized Mean ( 11 / 24 ) & 104.277777777778 & 1.53394331383897 & 67.9802029429651 \tabularnewline
Winsorized Mean ( 12 / 24 ) & 103.944444444444 & 1.42974341472855 & 72.7014675316264 \tabularnewline
Winsorized Mean ( 13 / 24 ) & 104.125 & 1.40184004666436 & 74.2773758302617 \tabularnewline
Winsorized Mean ( 14 / 24 ) & 104.319444444444 & 1.37277724578496 & 75.991530865442 \tabularnewline
Winsorized Mean ( 15 / 24 ) & 104.111111111111 & 1.34189673115028 & 77.5850396638692 \tabularnewline
Winsorized Mean ( 16 / 24 ) & 104.111111111111 & 1.34189673115028 & 77.5850396638692 \tabularnewline
Winsorized Mean ( 17 / 24 ) & 104.347222222222 & 1.30743027088732 & 79.8109272408116 \tabularnewline
Winsorized Mean ( 18 / 24 ) & 104.597222222222 & 1.27201424347811 & 82.2295998323245 \tabularnewline
Winsorized Mean ( 19 / 24 ) & 104.333333333333 & 1.23333967768956 & 84.5941594360958 \tabularnewline
Winsorized Mean ( 20 / 24 ) & 103.777777777778 & 1.15507694434106 & 89.8449045201745 \tabularnewline
Winsorized Mean ( 21 / 24 ) & 103.777777777778 & 1.07398862826352 & 96.6283767320428 \tabularnewline
Winsorized Mean ( 22 / 24 ) & 103.777777777778 & 1.07398862826352 & 96.6283767320428 \tabularnewline
Winsorized Mean ( 23 / 24 ) & 104.097222222222 & 1.02933493468121 & 101.130563740617 \tabularnewline
Winsorized Mean ( 24 / 24 ) & 103.763888888889 & 0.984721518658796 & 105.373841154824 \tabularnewline
Trimmed Mean ( 1 / 24 ) & 103.814285714286 & 1.86903423397246 & 55.5443468221757 \tabularnewline
Trimmed Mean ( 2 / 24 ) & 103.867647058824 & 1.81108483389849 & 57.3510666726974 \tabularnewline
Trimmed Mean ( 3 / 24 ) & 103.878787878788 & 1.76200711357969 & 58.9548061856277 \tabularnewline
Trimmed Mean ( 4 / 24 ) & 103.953125 & 1.71816706384327 & 60.502338327609 \tabularnewline
Trimmed Mean ( 5 / 24 ) & 104.032258064516 & 1.68122864057848 & 61.8787091497088 \tabularnewline
Trimmed Mean ( 6 / 24 ) & 104.116666666667 & 1.6443863874823 & 63.3164245698228 \tabularnewline
Trimmed Mean ( 7 / 24 ) & 104.189655172414 & 1.60392306717481 & 64.9592597704429 \tabularnewline
Trimmed Mean ( 8 / 24 ) & 104.214285714286 & 1.56871075481811 & 66.4330791346995 \tabularnewline
Trimmed Mean ( 9 / 24 ) & 104.240740740741 & 1.53435732492425 & 67.937721577265 \tabularnewline
Trimmed Mean ( 10 / 24 ) & 104.230769230769 & 1.50128536798312 & 69.4276860706348 \tabularnewline
Trimmed Mean ( 11 / 24 ) & 104.18 & 1.46932998752659 & 70.9030652640338 \tabularnewline
Trimmed Mean ( 12 / 24 ) & 104.166666666667 & 1.43978836768993 & 72.348595810506 \tabularnewline
Trimmed Mean ( 13 / 24 ) & 104.195652173913 & 1.4236170729021 & 73.1907857507679 \tabularnewline
Trimmed Mean ( 14 / 24 ) & 104.204545454545 & 1.40693673570696 & 74.0648408772868 \tabularnewline
Trimmed Mean ( 15 / 24 ) & 104.190476190476 & 1.38945677234945 & 74.9864826771827 \tabularnewline
Trimmed Mean ( 16 / 24 ) & 104.2 & 1.37103741369212 & 76.0008435651624 \tabularnewline
Trimmed Mean ( 17 / 24 ) & 104.210526315789 & 1.3441606997764 & 77.5283240561375 \tabularnewline
Trimmed Mean ( 18 / 24 ) & 104.194444444444 & 1.31403863370306 & 79.293288471144 \tabularnewline
Trimmed Mean ( 19 / 24 ) & 104.147058823529 & 1.27929650965284 & 81.4096325892357 \tabularnewline
Trimmed Mean ( 20 / 24 ) & 104.125 & 1.23926844965995 & 84.0213434212509 \tabularnewline
Trimmed Mean ( 21 / 24 ) & 104.166666666667 & 1.20256749597496 & 86.6202246570914 \tabularnewline
Trimmed Mean ( 22 / 24 ) & 104.214285714286 & 1.17103167879599 & 88.9935666142136 \tabularnewline
Trimmed Mean ( 23 / 24 ) & 104.269230769231 & 1.1198319823255 & 93.1114956662518 \tabularnewline
Trimmed Mean ( 24 / 24 ) & 104.291666666667 & 1.05548801589162 & 98.8089538644046 \tabularnewline
Median & 105 &  &  \tabularnewline
Midrange & 103 &  &  \tabularnewline
Midmean - Weighted Average at Xnp & 104.9 &  &  \tabularnewline
Midmean - Weighted Average at X(n+1)p & 105.25641025641 &  &  \tabularnewline
Midmean - Empirical Distribution Function & 104.9 &  &  \tabularnewline
Midmean - Empirical Distribution Function - Averaging & 105.25641025641 &  &  \tabularnewline
Midmean - Empirical Distribution Function - Interpolation & 105.25641025641 &  &  \tabularnewline
Midmean - Closest Observation & 104.9 &  &  \tabularnewline
Midmean - True Basic - Statistics Graphics Toolkit & 105.25641025641 &  &  \tabularnewline
Midmean - MS Excel (old versions) & 104.9 &  &  \tabularnewline
Number of observations & 72 &  &  \tabularnewline
\hline
\end{tabular}
%Source: https://freestatistics.org/blog/index.php?pk=&T=1

[TABLE]
[ROW][C]Central Tendency - Ungrouped Data[/C][/ROW]
[ROW][C]Measure[/C][C]Value[/C][C]S.E.[/C][C]Value/S.E.[/C][/ROW]
[ROW][C]Arithmetic Mean[/C][C]103.791666666667[/C][C]1.93051615005775[/C][C]53.7636873245333[/C][/ROW]
[ROW][C]Geometric Mean[/C][C]102.471561514799[/C][C][/C][C][/C][/ROW]
[ROW][C]Harmonic Mean[/C][C]101.109542202616[/C][C][/C][C][/C][/ROW]
[ROW][C]Quadratic Mean[/C][C]105.058647642374[/C][C][/C][C][/C][/ROW]
[ROW][C]Winsorized Mean ( 1 / 24 )[/C][C]103.763888888889[/C][C]1.91776280715047[/C][C]54.1067375496074[/C][/ROW]
[ROW][C]Winsorized Mean ( 2 / 24 )[/C][C]103.847222222222[/C][C]1.88651624782165[/C][C]55.0470860466397[/C][/ROW]
[ROW][C]Winsorized Mean ( 3 / 24 )[/C][C]103.680555555556[/C][C]1.85358283406124[/C][C]55.9352156538855[/C][/ROW]
[ROW][C]Winsorized Mean ( 4 / 24 )[/C][C]103.680555555556[/C][C]1.81001240591907[/C][C]57.2816822782547[/C][/ROW]
[ROW][C]Winsorized Mean ( 5 / 24 )[/C][C]103.680555555556[/C][C]1.78388570148592[/C][C]58.120627049812[/C][/ROW]
[ROW][C]Winsorized Mean ( 6 / 24 )[/C][C]103.763888888889[/C][C]1.76721280595959[/C][C]58.7161254937521[/C][/ROW]
[ROW][C]Winsorized Mean ( 7 / 24 )[/C][C]104.055555555556[/C][C]1.71193098663707[/C][C]60.7825644653836[/C][/ROW]
[ROW][C]Winsorized Mean ( 8 / 24 )[/C][C]104.055555555556[/C][C]1.6730966212228[/C][C]62.193392919236[/C][/ROW]
[ROW][C]Winsorized Mean ( 9 / 24 )[/C][C]104.305555555556[/C][C]1.63007230377298[/C][C]63.9882999754853[/C][/ROW]
[ROW][C]Winsorized Mean ( 10 / 24 )[/C][C]104.583333333333[/C][C]1.58518547465127[/C][C]65.9754552421323[/C][/ROW]
[ROW][C]Winsorized Mean ( 11 / 24 )[/C][C]104.277777777778[/C][C]1.53394331383897[/C][C]67.9802029429651[/C][/ROW]
[ROW][C]Winsorized Mean ( 12 / 24 )[/C][C]103.944444444444[/C][C]1.42974341472855[/C][C]72.7014675316264[/C][/ROW]
[ROW][C]Winsorized Mean ( 13 / 24 )[/C][C]104.125[/C][C]1.40184004666436[/C][C]74.2773758302617[/C][/ROW]
[ROW][C]Winsorized Mean ( 14 / 24 )[/C][C]104.319444444444[/C][C]1.37277724578496[/C][C]75.991530865442[/C][/ROW]
[ROW][C]Winsorized Mean ( 15 / 24 )[/C][C]104.111111111111[/C][C]1.34189673115028[/C][C]77.5850396638692[/C][/ROW]
[ROW][C]Winsorized Mean ( 16 / 24 )[/C][C]104.111111111111[/C][C]1.34189673115028[/C][C]77.5850396638692[/C][/ROW]
[ROW][C]Winsorized Mean ( 17 / 24 )[/C][C]104.347222222222[/C][C]1.30743027088732[/C][C]79.8109272408116[/C][/ROW]
[ROW][C]Winsorized Mean ( 18 / 24 )[/C][C]104.597222222222[/C][C]1.27201424347811[/C][C]82.2295998323245[/C][/ROW]
[ROW][C]Winsorized Mean ( 19 / 24 )[/C][C]104.333333333333[/C][C]1.23333967768956[/C][C]84.5941594360958[/C][/ROW]
[ROW][C]Winsorized Mean ( 20 / 24 )[/C][C]103.777777777778[/C][C]1.15507694434106[/C][C]89.8449045201745[/C][/ROW]
[ROW][C]Winsorized Mean ( 21 / 24 )[/C][C]103.777777777778[/C][C]1.07398862826352[/C][C]96.6283767320428[/C][/ROW]
[ROW][C]Winsorized Mean ( 22 / 24 )[/C][C]103.777777777778[/C][C]1.07398862826352[/C][C]96.6283767320428[/C][/ROW]
[ROW][C]Winsorized Mean ( 23 / 24 )[/C][C]104.097222222222[/C][C]1.02933493468121[/C][C]101.130563740617[/C][/ROW]
[ROW][C]Winsorized Mean ( 24 / 24 )[/C][C]103.763888888889[/C][C]0.984721518658796[/C][C]105.373841154824[/C][/ROW]
[ROW][C]Trimmed Mean ( 1 / 24 )[/C][C]103.814285714286[/C][C]1.86903423397246[/C][C]55.5443468221757[/C][/ROW]
[ROW][C]Trimmed Mean ( 2 / 24 )[/C][C]103.867647058824[/C][C]1.81108483389849[/C][C]57.3510666726974[/C][/ROW]
[ROW][C]Trimmed Mean ( 3 / 24 )[/C][C]103.878787878788[/C][C]1.76200711357969[/C][C]58.9548061856277[/C][/ROW]
[ROW][C]Trimmed Mean ( 4 / 24 )[/C][C]103.953125[/C][C]1.71816706384327[/C][C]60.502338327609[/C][/ROW]
[ROW][C]Trimmed Mean ( 5 / 24 )[/C][C]104.032258064516[/C][C]1.68122864057848[/C][C]61.8787091497088[/C][/ROW]
[ROW][C]Trimmed Mean ( 6 / 24 )[/C][C]104.116666666667[/C][C]1.6443863874823[/C][C]63.3164245698228[/C][/ROW]
[ROW][C]Trimmed Mean ( 7 / 24 )[/C][C]104.189655172414[/C][C]1.60392306717481[/C][C]64.9592597704429[/C][/ROW]
[ROW][C]Trimmed Mean ( 8 / 24 )[/C][C]104.214285714286[/C][C]1.56871075481811[/C][C]66.4330791346995[/C][/ROW]
[ROW][C]Trimmed Mean ( 9 / 24 )[/C][C]104.240740740741[/C][C]1.53435732492425[/C][C]67.937721577265[/C][/ROW]
[ROW][C]Trimmed Mean ( 10 / 24 )[/C][C]104.230769230769[/C][C]1.50128536798312[/C][C]69.4276860706348[/C][/ROW]
[ROW][C]Trimmed Mean ( 11 / 24 )[/C][C]104.18[/C][C]1.46932998752659[/C][C]70.9030652640338[/C][/ROW]
[ROW][C]Trimmed Mean ( 12 / 24 )[/C][C]104.166666666667[/C][C]1.43978836768993[/C][C]72.348595810506[/C][/ROW]
[ROW][C]Trimmed Mean ( 13 / 24 )[/C][C]104.195652173913[/C][C]1.4236170729021[/C][C]73.1907857507679[/C][/ROW]
[ROW][C]Trimmed Mean ( 14 / 24 )[/C][C]104.204545454545[/C][C]1.40693673570696[/C][C]74.0648408772868[/C][/ROW]
[ROW][C]Trimmed Mean ( 15 / 24 )[/C][C]104.190476190476[/C][C]1.38945677234945[/C][C]74.9864826771827[/C][/ROW]
[ROW][C]Trimmed Mean ( 16 / 24 )[/C][C]104.2[/C][C]1.37103741369212[/C][C]76.0008435651624[/C][/ROW]
[ROW][C]Trimmed Mean ( 17 / 24 )[/C][C]104.210526315789[/C][C]1.3441606997764[/C][C]77.5283240561375[/C][/ROW]
[ROW][C]Trimmed Mean ( 18 / 24 )[/C][C]104.194444444444[/C][C]1.31403863370306[/C][C]79.293288471144[/C][/ROW]
[ROW][C]Trimmed Mean ( 19 / 24 )[/C][C]104.147058823529[/C][C]1.27929650965284[/C][C]81.4096325892357[/C][/ROW]
[ROW][C]Trimmed Mean ( 20 / 24 )[/C][C]104.125[/C][C]1.23926844965995[/C][C]84.0213434212509[/C][/ROW]
[ROW][C]Trimmed Mean ( 21 / 24 )[/C][C]104.166666666667[/C][C]1.20256749597496[/C][C]86.6202246570914[/C][/ROW]
[ROW][C]Trimmed Mean ( 22 / 24 )[/C][C]104.214285714286[/C][C]1.17103167879599[/C][C]88.9935666142136[/C][/ROW]
[ROW][C]Trimmed Mean ( 23 / 24 )[/C][C]104.269230769231[/C][C]1.1198319823255[/C][C]93.1114956662518[/C][/ROW]
[ROW][C]Trimmed Mean ( 24 / 24 )[/C][C]104.291666666667[/C][C]1.05548801589162[/C][C]98.8089538644046[/C][/ROW]
[ROW][C]Median[/C][C]105[/C][C][/C][C][/C][/ROW]
[ROW][C]Midrange[/C][C]103[/C][C][/C][C][/C][/ROW]
[ROW][C]Midmean - Weighted Average at Xnp[/C][C]104.9[/C][C][/C][C][/C][/ROW]
[ROW][C]Midmean - Weighted Average at X(n+1)p[/C][C]105.25641025641[/C][C][/C][C][/C][/ROW]
[ROW][C]Midmean - Empirical Distribution Function[/C][C]104.9[/C][C][/C][C][/C][/ROW]
[ROW][C]Midmean - Empirical Distribution Function - Averaging[/C][C]105.25641025641[/C][C][/C][C][/C][/ROW]
[ROW][C]Midmean - Empirical Distribution Function - Interpolation[/C][C]105.25641025641[/C][C][/C][C][/C][/ROW]
[ROW][C]Midmean - Closest Observation[/C][C]104.9[/C][C][/C][C][/C][/ROW]
[ROW][C]Midmean - True Basic - Statistics Graphics Toolkit[/C][C]105.25641025641[/C][C][/C][C][/C][/ROW]
[ROW][C]Midmean - MS Excel (old versions)[/C][C]104.9[/C][C][/C][C][/C][/ROW]
[ROW][C]Number of observations[/C][C]72[/C][C][/C][C][/C][/ROW]
[/TABLE]
Source: https://freestatistics.org/blog/index.php?pk=&T=1

Globally Unique Identifier (entire table): ba.freestatistics.org/blog/index.php?pk=&T=1

As an alternative you can also use a QR Code:  

The GUIDs for individual cells are displayed in the table below:

Central Tendency - Ungrouped Data
MeasureValueS.E.Value/S.E.
Arithmetic Mean103.7916666666671.9305161500577553.7636873245333
Geometric Mean102.471561514799
Harmonic Mean101.109542202616
Quadratic Mean105.058647642374
Winsorized Mean ( 1 / 24 )103.7638888888891.9177628071504754.1067375496074
Winsorized Mean ( 2 / 24 )103.8472222222221.8865162478216555.0470860466397
Winsorized Mean ( 3 / 24 )103.6805555555561.8535828340612455.9352156538855
Winsorized Mean ( 4 / 24 )103.6805555555561.8100124059190757.2816822782547
Winsorized Mean ( 5 / 24 )103.6805555555561.7838857014859258.120627049812
Winsorized Mean ( 6 / 24 )103.7638888888891.7672128059595958.7161254937521
Winsorized Mean ( 7 / 24 )104.0555555555561.7119309866370760.7825644653836
Winsorized Mean ( 8 / 24 )104.0555555555561.673096621222862.193392919236
Winsorized Mean ( 9 / 24 )104.3055555555561.6300723037729863.9882999754853
Winsorized Mean ( 10 / 24 )104.5833333333331.5851854746512765.9754552421323
Winsorized Mean ( 11 / 24 )104.2777777777781.5339433138389767.9802029429651
Winsorized Mean ( 12 / 24 )103.9444444444441.4297434147285572.7014675316264
Winsorized Mean ( 13 / 24 )104.1251.4018400466643674.2773758302617
Winsorized Mean ( 14 / 24 )104.3194444444441.3727772457849675.991530865442
Winsorized Mean ( 15 / 24 )104.1111111111111.3418967311502877.5850396638692
Winsorized Mean ( 16 / 24 )104.1111111111111.3418967311502877.5850396638692
Winsorized Mean ( 17 / 24 )104.3472222222221.3074302708873279.8109272408116
Winsorized Mean ( 18 / 24 )104.5972222222221.2720142434781182.2295998323245
Winsorized Mean ( 19 / 24 )104.3333333333331.2333396776895684.5941594360958
Winsorized Mean ( 20 / 24 )103.7777777777781.1550769443410689.8449045201745
Winsorized Mean ( 21 / 24 )103.7777777777781.0739886282635296.6283767320428
Winsorized Mean ( 22 / 24 )103.7777777777781.0739886282635296.6283767320428
Winsorized Mean ( 23 / 24 )104.0972222222221.02933493468121101.130563740617
Winsorized Mean ( 24 / 24 )103.7638888888890.984721518658796105.373841154824
Trimmed Mean ( 1 / 24 )103.8142857142861.8690342339724655.5443468221757
Trimmed Mean ( 2 / 24 )103.8676470588241.8110848338984957.3510666726974
Trimmed Mean ( 3 / 24 )103.8787878787881.7620071135796958.9548061856277
Trimmed Mean ( 4 / 24 )103.9531251.7181670638432760.502338327609
Trimmed Mean ( 5 / 24 )104.0322580645161.6812286405784861.8787091497088
Trimmed Mean ( 6 / 24 )104.1166666666671.644386387482363.3164245698228
Trimmed Mean ( 7 / 24 )104.1896551724141.6039230671748164.9592597704429
Trimmed Mean ( 8 / 24 )104.2142857142861.5687107548181166.4330791346995
Trimmed Mean ( 9 / 24 )104.2407407407411.5343573249242567.937721577265
Trimmed Mean ( 10 / 24 )104.2307692307691.5012853679831269.4276860706348
Trimmed Mean ( 11 / 24 )104.181.4693299875265970.9030652640338
Trimmed Mean ( 12 / 24 )104.1666666666671.4397883676899372.348595810506
Trimmed Mean ( 13 / 24 )104.1956521739131.423617072902173.1907857507679
Trimmed Mean ( 14 / 24 )104.2045454545451.4069367357069674.0648408772868
Trimmed Mean ( 15 / 24 )104.1904761904761.3894567723494574.9864826771827
Trimmed Mean ( 16 / 24 )104.21.3710374136921276.0008435651624
Trimmed Mean ( 17 / 24 )104.2105263157891.344160699776477.5283240561375
Trimmed Mean ( 18 / 24 )104.1944444444441.3140386337030679.293288471144
Trimmed Mean ( 19 / 24 )104.1470588235291.2792965096528481.4096325892357
Trimmed Mean ( 20 / 24 )104.1251.2392684496599584.0213434212509
Trimmed Mean ( 21 / 24 )104.1666666666671.2025674959749686.6202246570914
Trimmed Mean ( 22 / 24 )104.2142857142861.1710316787959988.9935666142136
Trimmed Mean ( 23 / 24 )104.2692307692311.119831982325593.1114956662518
Trimmed Mean ( 24 / 24 )104.2916666666671.0554880158916298.8089538644046
Median105
Midrange103
Midmean - Weighted Average at Xnp104.9
Midmean - Weighted Average at X(n+1)p105.25641025641
Midmean - Empirical Distribution Function104.9
Midmean - Empirical Distribution Function - Averaging105.25641025641
Midmean - Empirical Distribution Function - Interpolation105.25641025641
Midmean - Closest Observation104.9
Midmean - True Basic - Statistics Graphics Toolkit105.25641025641
Midmean - MS Excel (old versions)104.9
Number of observations72


Parameters (Session):
Parameters (R input):
R code (references can be found in the software module):
geomean <- function(x) {
return(exp(mean(log(x))))
}
harmean <- function(x) {
return(1/mean(1/x))
}
quamean <- function(x) {
return(sqrt(mean(x*x)))
}
winmean <- function(x) {
x <-sort(x[!is.na(x)])
n<-length(x)
denom <- 3
nodenom <- n/denom
if (nodenom>40) denom <- n/40
sqrtn = sqrt(n)
roundnodenom = floor(nodenom)
win <- array(NA,dim=c(roundnodenom,2))
for (j in 1:roundnodenom) {
win[j,1] <- (j*x[j+1]+sum(x[(j+1):(n-j)])+j*x[n-j])/n
win[j,2] <- sd(c(rep(x[j+1],j),x[(j+1):(n-j)],rep(x[n-j],j)))/sqrtn
}
return(win)
}
trimean <- function(x) {
x <-sort(x[!is.na(x)])
n<-length(x)
denom <- 3
nodenom <- n/denom
if (nodenom>40) denom <- n/40
sqrtn = sqrt(n)
roundnodenom = floor(nodenom)
tri <- array(NA,dim=c(roundnodenom,2))
for (j in 1:roundnodenom) {
tri[j,1] <- mean(x,trim=j/n)
tri[j,2] <- sd(x[(j+1):(n-j)]) / sqrt(n-j*2)
}
return(tri)
}
midrange <- function(x) {
return((max(x)+min(x))/2)
}
q1 <- function(data,n,p,i,f) {
np <- n*p;
i <<- floor(np)
f <<- np - i
qvalue <- (1-f)*data[i] + f*data[i+1]
}
q2 <- function(data,n,p,i,f) {
np <- (n+1)*p
i <<- floor(np)
f <<- np - i
qvalue <- (1-f)*data[i] + f*data[i+1]
}
q3 <- function(data,n,p,i,f) {
np <- n*p
i <<- floor(np)
f <<- np - i
if (f==0) {
qvalue <- data[i]
} else {
qvalue <- data[i+1]
}
}
q4 <- function(data,n,p,i,f) {
np <- n*p
i <<- floor(np)
f <<- np - i
if (f==0) {
qvalue <- (data[i]+data[i+1])/2
} else {
qvalue <- data[i+1]
}
}
q5 <- function(data,n,p,i,f) {
np <- (n-1)*p
i <<- floor(np)
f <<- np - i
if (f==0) {
qvalue <- data[i+1]
} else {
qvalue <- data[i+1] + f*(data[i+2]-data[i+1])
}
}
q6 <- function(data,n,p,i,f) {
np <- n*p+0.5
i <<- floor(np)
f <<- np - i
qvalue <- data[i]
}
q7 <- function(data,n,p,i,f) {
np <- (n+1)*p
i <<- floor(np)
f <<- np - i
if (f==0) {
qvalue <- data[i]
} else {
qvalue <- f*data[i] + (1-f)*data[i+1]
}
}
q8 <- function(data,n,p,i,f) {
np <- (n+1)*p
i <<- floor(np)
f <<- np - i
if (f==0) {
qvalue <- data[i]
} else {
if (f == 0.5) {
qvalue <- (data[i]+data[i+1])/2
} else {
if (f < 0.5) {
qvalue <- data[i]
} else {
qvalue <- data[i+1]
}
}
}
}
midmean <- function(x,def) {
x <-sort(x[!is.na(x)])
n<-length(x)
if (def==1) {
qvalue1 <- q1(x,n,0.25,i,f)
qvalue3 <- q1(x,n,0.75,i,f)
}
if (def==2) {
qvalue1 <- q2(x,n,0.25,i,f)
qvalue3 <- q2(x,n,0.75,i,f)
}
if (def==3) {
qvalue1 <- q3(x,n,0.25,i,f)
qvalue3 <- q3(x,n,0.75,i,f)
}
if (def==4) {
qvalue1 <- q4(x,n,0.25,i,f)
qvalue3 <- q4(x,n,0.75,i,f)
}
if (def==5) {
qvalue1 <- q5(x,n,0.25,i,f)
qvalue3 <- q5(x,n,0.75,i,f)
}
if (def==6) {
qvalue1 <- q6(x,n,0.25,i,f)
qvalue3 <- q6(x,n,0.75,i,f)
}
if (def==7) {
qvalue1 <- q7(x,n,0.25,i,f)
qvalue3 <- q7(x,n,0.75,i,f)
}
if (def==8) {
qvalue1 <- q8(x,n,0.25,i,f)
qvalue3 <- q8(x,n,0.75,i,f)
}
midm <- 0
myn <- 0
roundno4 <- round(n/4)
round3no4 <- round(3*n/4)
for (i in 1:n) {
if ((x[i]>=qvalue1) & (x[i]<=qvalue3)){
midm = midm + x[i]
myn = myn + 1
}
}
midm = midm / myn
return(midm)
}
(arm <- mean(x))
sqrtn <- sqrt(length(x))
(armse <- sd(x) / sqrtn)
(armose <- arm / armse)
(geo <- geomean(x))
(har <- harmean(x))
(qua <- quamean(x))
(win <- winmean(x))
(tri <- trimean(x))
(midr <- midrange(x))
midm <- array(NA,dim=8)
for (j in 1:8) midm[j] <- midmean(x,j)
midm
bitmap(file='test1.png')
lb <- win[,1] - 2*win[,2]
ub <- win[,1] + 2*win[,2]
if ((ylimmin == '') | (ylimmax == '')) plot(win[,1],type='b',main=main, xlab='j', pch=19, ylab='Winsorized Mean(j/n)', ylim=c(min(lb),max(ub))) else plot(win[,1],type='l',main=main, xlab='j', pch=19, ylab='Winsorized Mean(j/n)', ylim=c(ylimmin,ylimmax))
lines(ub,lty=3)
lines(lb,lty=3)
grid()
dev.off()
bitmap(file='test2.png')
lb <- tri[,1] - 2*tri[,2]
ub <- tri[,1] + 2*tri[,2]
if ((ylimmin == '') | (ylimmax == '')) plot(tri[,1],type='b',main=main, xlab='j', pch=19, ylab='Trimmed Mean(j/n)', ylim=c(min(lb),max(ub))) else plot(tri[,1],type='l',main=main, xlab='j', pch=19, ylab='Trimmed Mean(j/n)', ylim=c(ylimmin,ylimmax))
lines(ub,lty=3)
lines(lb,lty=3)
grid()
dev.off()
load(file='createtable')
a<-table.start()
a<-table.row.start(a)
a<-table.element(a,'Central Tendency - Ungrouped Data',4,TRUE)
a<-table.row.end(a)
a<-table.row.start(a)
a<-table.element(a,'Measure',header=TRUE)
a<-table.element(a,'Value',header=TRUE)
a<-table.element(a,'S.E.',header=TRUE)
a<-table.element(a,'Value/S.E.',header=TRUE)
a<-table.row.end(a)
a<-table.row.start(a)
a<-table.element(a,hyperlink('arithmetic_mean.htm', 'Arithmetic Mean', 'click to view the definition of the Arithmetic Mean'),header=TRUE)
a<-table.element(a,arm)
a<-table.element(a,hyperlink('arithmetic_mean_standard_error.htm', armse, 'click to view the definition of the Standard Error of the Arithmetic Mean'))
a<-table.element(a,armose)
a<-table.row.end(a)
a<-table.row.start(a)
a<-table.element(a,hyperlink('geometric_mean.htm', 'Geometric Mean', 'click to view the definition of the Geometric Mean'),header=TRUE)
a<-table.element(a,geo)
a<-table.element(a,'')
a<-table.row.end(a)
a<-table.row.start(a)
a<-table.element(a,hyperlink('harmonic_mean.htm', 'Harmonic Mean', 'click to view the definition of the Harmonic Mean'),header=TRUE)
a<-table.element(a,har)
a<-table.element(a,'')
a<-table.row.end(a)
a<-table.row.start(a)
a<-table.element(a,hyperlink('quadratic_mean.htm', 'Quadratic Mean', 'click to view the definition of the Quadratic Mean'),header=TRUE)
a<-table.element(a,qua)
a<-table.element(a,'')
a<-table.row.end(a)
for (j in 1:length(win[,1])) {
a<-table.row.start(a)
mylabel <- paste('Winsorized Mean (',j)
mylabel <- paste(mylabel,'/')
mylabel <- paste(mylabel,length(win[,1]))
mylabel <- paste(mylabel,')')
a<-table.element(a,hyperlink('winsorized_mean.htm', mylabel, 'click to view the definition of the Winsorized Mean'),header=TRUE)
a<-table.element(a,win[j,1])
a<-table.element(a,win[j,2])
a<-table.element(a,win[j,1]/win[j,2])
a<-table.row.end(a)
}
for (j in 1:length(tri[,1])) {
a<-table.row.start(a)
mylabel <- paste('Trimmed Mean (',j)
mylabel <- paste(mylabel,'/')
mylabel <- paste(mylabel,length(tri[,1]))
mylabel <- paste(mylabel,')')
a<-table.element(a,hyperlink('arithmetic_mean.htm', mylabel, 'click to view the definition of the Trimmed Mean'),header=TRUE)
a<-table.element(a,tri[j,1])
a<-table.element(a,tri[j,2])
a<-table.element(a,tri[j,1]/tri[j,2])
a<-table.row.end(a)
}
a<-table.row.start(a)
a<-table.element(a,hyperlink('median_1.htm', 'Median', 'click to view the definition of the Median'),header=TRUE)
a<-table.element(a,median(x))
a<-table.element(a,'')
a<-table.row.end(a)
a<-table.row.start(a)
a<-table.element(a,hyperlink('midrange.htm', 'Midrange', 'click to view the definition of the Midrange'),header=TRUE)
a<-table.element(a,midr)
a<-table.element(a,'')
a<-table.row.end(a)
a<-table.row.start(a)
mymid <- hyperlink('midmean.htm', 'Midmean', 'click to view the definition of the Midmean')
mylabel <- paste(mymid,hyperlink('method_1.htm','Weighted Average at Xnp',''),sep=' - ')
a<-table.element(a,mylabel,header=TRUE)
a<-table.element(a,midm[1])
a<-table.element(a,'')
a<-table.row.end(a)
a<-table.row.start(a)
mymid <- hyperlink('midmean.htm', 'Midmean', 'click to view the definition of the Midmean')
mylabel <- paste(mymid,hyperlink('method_2.htm','Weighted Average at X(n+1)p',''),sep=' - ')
a<-table.element(a,mylabel,header=TRUE)
a<-table.element(a,midm[2])
a<-table.element(a,'')
a<-table.row.end(a)
a<-table.row.start(a)
mymid <- hyperlink('midmean.htm', 'Midmean', 'click to view the definition of the Midmean')
mylabel <- paste(mymid,hyperlink('method_3.htm','Empirical Distribution Function',''),sep=' - ')
a<-table.element(a,mylabel,header=TRUE)
a<-table.element(a,midm[3])
a<-table.element(a,'')
a<-table.row.end(a)
a<-table.row.start(a)
mymid <- hyperlink('midmean.htm', 'Midmean', 'click to view the definition of the Midmean')
mylabel <- paste(mymid,hyperlink('method_4.htm','Empirical Distribution Function - Averaging',''),sep=' - ')
a<-table.element(a,mylabel,header=TRUE)
a<-table.element(a,midm[4])
a<-table.element(a,'')
a<-table.row.end(a)
a<-table.row.start(a)
mymid <- hyperlink('midmean.htm', 'Midmean', 'click to view the definition of the Midmean')
mylabel <- paste(mymid,hyperlink('method_5.htm','Empirical Distribution Function - Interpolation',''),sep=' - ')
a<-table.element(a,mylabel,header=TRUE)
a<-table.element(a,midm[5])
a<-table.element(a,'')
a<-table.row.end(a)
a<-table.row.start(a)
mymid <- hyperlink('midmean.htm', 'Midmean', 'click to view the definition of the Midmean')
mylabel <- paste(mymid,hyperlink('method_6.htm','Closest Observation',''),sep=' - ')
a<-table.element(a,mylabel,header=TRUE)
a<-table.element(a,midm[6])
a<-table.element(a,'')
a<-table.row.end(a)
a<-table.row.start(a)
mymid <- hyperlink('midmean.htm', 'Midmean', 'click to view the definition of the Midmean')
mylabel <- paste(mymid,hyperlink('method_7.htm','True Basic - Statistics Graphics Toolkit',''),sep=' - ')
a<-table.element(a,mylabel,header=TRUE)
a<-table.element(a,midm[7])
a<-table.element(a,'')
a<-table.row.end(a)
a<-table.row.start(a)
mymid <- hyperlink('midmean.htm', 'Midmean', 'click to view the definition of the Midmean')
mylabel <- paste(mymid,hyperlink('method_8.htm','MS Excel (old versions)',''),sep=' - ')
a<-table.element(a,mylabel,header=TRUE)
a<-table.element(a,midm[8])
a<-table.element(a,'')
a<-table.row.end(a)
a<-table.row.start(a)
a<-table.element(a,'Number of observations',header=TRUE)
a<-table.element(a,length(x))
a<-table.element(a,'')
a<-table.row.end(a)
a<-table.end(a)
table.save(a,file='mytable.tab')