Free Statistics

of Irreproducible Research!

Author's title

Author*Unverified author*
R Software Modulerwasp_centraltendency.wasp
Title produced by softwareCentral Tendency
Date of computationTue, 14 Mar 2017 08:29:44 +0000
Cite this page as followsStatistical Computations at FreeStatistics.org, Office for Research Development and Education, URL https://freestatistics.org/blog/index.php?v=date/2017/Mar/14/t1489480228fd2kpad637pdonx.htm/, Retrieved Tue, 14 May 2024 16:06:10 +0200
Statistical Computations at FreeStatistics.org, Office for Research Development and Education, URL https://freestatistics.org/blog/index.php?pk=, Retrieved Tue, 14 May 2024 16:06:10 +0200
QR Codes:

Original text written by user:
IsPrivate?No (this computation is public)
User-defined keywords
Estimated Impact0
Dataseries X:
109843
106365
102304
97968
92462
92286
120092
126656
124144
114045
108120
105698
111203
110030
104009
99772
96301
97680
121563
134210
133111
124527
117589
115699
117830
115874
111267
107985
102185
102101
128932
135782
136971
126292
119260
117359
119818
116059
110046
104100
97981
97527
123700
129678
130790
120961
114232
110518
110959
108443
103977
97126
90860
91959
113735
119713
121905
112442
106728
104906
105308
102909
97849
93181
87470
86998
106716
115028
116828
108413
102628
99126


Summary of computational transaction
Raw Inputview raw input (R code)
Raw Outputview raw output of R engine
Computing time1 seconds
R Server'George Udny Yule' @ yule.wessa.net

\begin{tabular}{lllllllll}
\hline
Summary of computational transaction \tabularnewline
Raw Input & view raw input (R code)  \tabularnewline
Raw Output & view raw output of R engine  \tabularnewline
Computing time & 1 seconds \tabularnewline
R Server & 'George Udny Yule' @ yule.wessa.net \tabularnewline
\hline
\end{tabular}
%Source: https://freestatistics.org/blog/index.php?pk=&T=0

[TABLE]
[ROW][C]Summary of computational transaction[/C][/ROW]
[ROW][C]Raw Input[/C][C]view raw input (R code) [/C][/ROW]
[ROW][C]Raw Output[/C][C]view raw output of R engine [/C][/ROW]
[ROW][C]Computing time[/C][C]1 seconds[/C][/ROW]
[ROW][C]R Server[/C][C]'George Udny Yule' @ yule.wessa.net[/C][/ROW]
[/TABLE]
Source: https://freestatistics.org/blog/index.php?pk=&T=0

Globally Unique Identifier (entire table): ba.freestatistics.org/blog/index.php?pk=&T=0

As an alternative you can also use a QR Code:  

The GUIDs for individual cells are displayed in the table below:

Summary of computational transaction
Raw Inputview raw input (R code)
Raw Outputview raw output of R engine
Computing time1 seconds
R Server'George Udny Yule' @ yule.wessa.net


Central Tendency - Ungrouped Data
MeasureValueS.E.Value/S.E.
Arithmetic Mean110668.51429.2101336140377.4333300591379
Geometric Mean110014.489692128
Harmonic Mean109362.224688641
Quadratic Mean111321.805798674
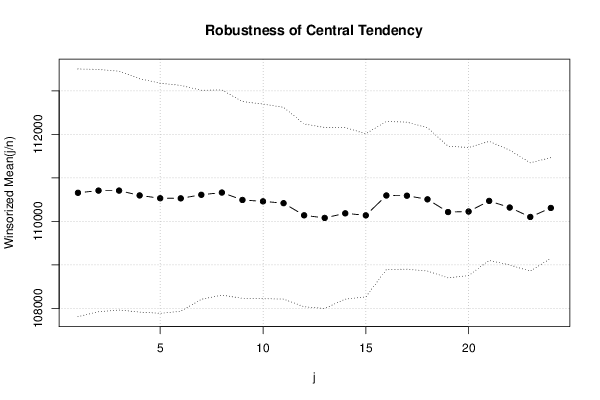
Winsorized Mean ( 1 / 24 )110658.5416666671423.5005672633377.7369143444789
Winsorized Mean ( 2 / 24 )110709.0416666671392.6120581336179.4974027548205
Winsorized Mean ( 3 / 24 )110709.0416666671372.9051393629480.6385222784136
Winsorized Mean ( 4 / 24 )110598.2638888891340.9064950544882.4802208780378
Winsorized Mean ( 5 / 24 )110533.2638888891322.491294259983.579577702057
Winsorized Mean ( 6 / 24 )110531.0138888891298.5441011631185.1191836995646
Winsorized Mean ( 7 / 24 )110613.0694444441201.4987879200792.0625726438962
Winsorized Mean ( 8 / 24 )110664.2916666671178.8135703583593.877687235163
Winsorized Mean ( 9 / 24 )110493.7916666671130.8054884870697.7124649567276
Winsorized Mean ( 10 / 24 )110461.8472222221118.1456790811298.7902106932959
Winsorized Mean ( 11 / 24 )110419.8333333331102.39302317415100.163762843309
Winsorized Mean ( 12 / 24 )110140.51050.15709477626104.880022758372
Winsorized Mean ( 13 / 24 )110081.0972222221040.10079435868105.836951398636
Winsorized Mean ( 14 / 24 )110186.680555556986.149017002448111.734310591806
Winsorized Mean ( 15 / 24 )110140.222222222937.561426307344117.47520656435
Winsorized Mean ( 16 / 24 )110596.888888889851.50967828938129.88330222044
Winsorized Mean ( 17 / 24 )110591.930555556844.951098752244130.885598845742
Winsorized Mean ( 18 / 24 )110508.430555556823.695239363393134.161793433411
Winsorized Mean ( 19 / 24 )110216.569444444756.621726971612145.669316007601
Winsorized Mean ( 20 / 24 )110227.680555556736.185037579881149.728227183095
Winsorized Mean ( 21 / 24 )110472.097222222684.032647478754161.50120557755
Winsorized Mean ( 22 / 24 )110319.625659.943998204276167.165131132615
Winsorized Mean ( 23 / 24 )110103.041666667622.38186478815176.905928491577
Winsorized Mean ( 24 / 24 )110310.041666667578.090643778886190.817898289423
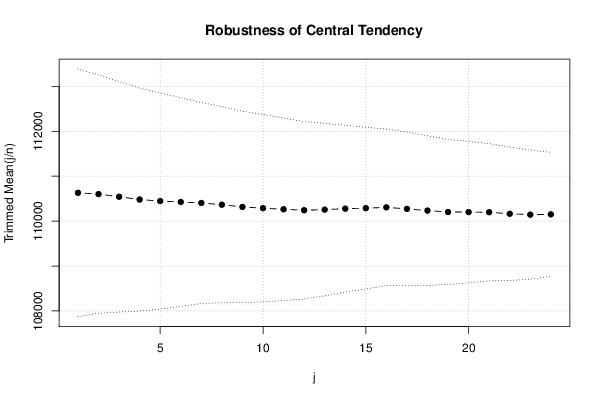
Trimmed Mean ( 1 / 24 )110630.91379.3636461735180.2043031269532
Trimmed Mean ( 2 / 24 )110601.6323529411326.8275518921983.3579557458026
Trimmed Mean ( 3 / 24 )110543.0454545451284.059874035586.0887001375833
Trimmed Mean ( 4 / 24 )110480.7968751241.885023980788.9621782545282
Trimmed Mean ( 5 / 24 )110446.6935483871203.1687502421891.7965111096473
Trimmed Mean ( 6 / 24 )110425.9166666671162.2063855661295.0140336846261
Trimmed Mean ( 7 / 24 )110404.1724137931119.2740471854698.6390890518874
Trimmed Mean ( 8 / 24 )110365.8035714291092.85880446939100.988163448081
Trimmed Mean ( 9 / 24 )110316.0555555561065.54883691041103.529797728858
Trimmed Mean ( 10 / 24 )110288.7115384621042.8143826222105.760635235137
Trimmed Mean ( 11 / 24 )110263.781016.79148958769108.44286279846
Trimmed Mean ( 12 / 24 )110242.5987.126484706246111.680216981319
Trimmed Mean ( 13 / 24 )110255.804347826960.978562560093114.732844876476
Trimmed Mean ( 14 / 24 )110277.795454545929.052578168552118.699197489917
Trimmed Mean ( 15 / 24 )110288.952380952899.916042639909122.554713056808
Trimmed Mean ( 16 / 24 )110306.8872.603313404265126.411163360889
Trimmed Mean ( 17 / 24 )110272.447368421855.904969480528128.837255653917
Trimmed Mean ( 18 / 24 )110234.861111111833.531588943283132.25037007999
Trimmed Mean ( 19 / 24 )110202.676470588807.181159185696136.527810661195
Trimmed Mean ( 20 / 24 )110201.03125787.680856708445139.905686816495
Trimmed Mean ( 21 / 24 )110197.833333333763.929266574793144.251356971077
Trimmed Mean ( 22 / 24 )110164.25743.320199942701148.205645438523
Trimmed Mean ( 23 / 24 )110144.692307692718.338068619785153.332667610564
Trimmed Mean ( 24 / 24 )110150.125691.417597845548159.310560424304
Median110038
Midrange111984.5
Midmean - Weighted Average at Xnp110017.297297297
Midmean - Weighted Average at X(n+1)p110234.861111111
Midmean - Empirical Distribution Function110017.297297297
Midmean - Empirical Distribution Function - Averaging110234.861111111
Midmean - Empirical Distribution Function - Interpolation110234.861111111
Midmean - Closest Observation110017.297297297
Midmean - True Basic - Statistics Graphics Toolkit110234.861111111
Midmean - MS Excel (old versions)110272.447368421
Number of observations72

\begin{tabular}{lllllllll}
\hline
Central Tendency - Ungrouped Data \tabularnewline
Measure & Value & S.E. & Value/S.E. \tabularnewline
Arithmetic Mean & 110668.5 & 1429.21013361403 & 77.4333300591379 \tabularnewline
Geometric Mean & 110014.489692128 &  &  \tabularnewline
Harmonic Mean & 109362.224688641 &  &  \tabularnewline
Quadratic Mean & 111321.805798674 &  &  \tabularnewline
Winsorized Mean ( 1 / 24 ) & 110658.541666667 & 1423.50056726333 & 77.7369143444789 \tabularnewline
Winsorized Mean ( 2 / 24 ) & 110709.041666667 & 1392.61205813361 & 79.4974027548205 \tabularnewline
Winsorized Mean ( 3 / 24 ) & 110709.041666667 & 1372.90513936294 & 80.6385222784136 \tabularnewline
Winsorized Mean ( 4 / 24 ) & 110598.263888889 & 1340.90649505448 & 82.4802208780378 \tabularnewline
Winsorized Mean ( 5 / 24 ) & 110533.263888889 & 1322.4912942599 & 83.579577702057 \tabularnewline
Winsorized Mean ( 6 / 24 ) & 110531.013888889 & 1298.54410116311 & 85.1191836995646 \tabularnewline
Winsorized Mean ( 7 / 24 ) & 110613.069444444 & 1201.49878792007 & 92.0625726438962 \tabularnewline
Winsorized Mean ( 8 / 24 ) & 110664.291666667 & 1178.81357035835 & 93.877687235163 \tabularnewline
Winsorized Mean ( 9 / 24 ) & 110493.791666667 & 1130.80548848706 & 97.7124649567276 \tabularnewline
Winsorized Mean ( 10 / 24 ) & 110461.847222222 & 1118.14567908112 & 98.7902106932959 \tabularnewline
Winsorized Mean ( 11 / 24 ) & 110419.833333333 & 1102.39302317415 & 100.163762843309 \tabularnewline
Winsorized Mean ( 12 / 24 ) & 110140.5 & 1050.15709477626 & 104.880022758372 \tabularnewline
Winsorized Mean ( 13 / 24 ) & 110081.097222222 & 1040.10079435868 & 105.836951398636 \tabularnewline
Winsorized Mean ( 14 / 24 ) & 110186.680555556 & 986.149017002448 & 111.734310591806 \tabularnewline
Winsorized Mean ( 15 / 24 ) & 110140.222222222 & 937.561426307344 & 117.47520656435 \tabularnewline
Winsorized Mean ( 16 / 24 ) & 110596.888888889 & 851.50967828938 & 129.88330222044 \tabularnewline
Winsorized Mean ( 17 / 24 ) & 110591.930555556 & 844.951098752244 & 130.885598845742 \tabularnewline
Winsorized Mean ( 18 / 24 ) & 110508.430555556 & 823.695239363393 & 134.161793433411 \tabularnewline
Winsorized Mean ( 19 / 24 ) & 110216.569444444 & 756.621726971612 & 145.669316007601 \tabularnewline
Winsorized Mean ( 20 / 24 ) & 110227.680555556 & 736.185037579881 & 149.728227183095 \tabularnewline
Winsorized Mean ( 21 / 24 ) & 110472.097222222 & 684.032647478754 & 161.50120557755 \tabularnewline
Winsorized Mean ( 22 / 24 ) & 110319.625 & 659.943998204276 & 167.165131132615 \tabularnewline
Winsorized Mean ( 23 / 24 ) & 110103.041666667 & 622.38186478815 & 176.905928491577 \tabularnewline
Winsorized Mean ( 24 / 24 ) & 110310.041666667 & 578.090643778886 & 190.817898289423 \tabularnewline
Trimmed Mean ( 1 / 24 ) & 110630.9 & 1379.36364617351 & 80.2043031269532 \tabularnewline
Trimmed Mean ( 2 / 24 ) & 110601.632352941 & 1326.82755189219 & 83.3579557458026 \tabularnewline
Trimmed Mean ( 3 / 24 ) & 110543.045454545 & 1284.0598740355 & 86.0887001375833 \tabularnewline
Trimmed Mean ( 4 / 24 ) & 110480.796875 & 1241.8850239807 & 88.9621782545282 \tabularnewline
Trimmed Mean ( 5 / 24 ) & 110446.693548387 & 1203.16875024218 & 91.7965111096473 \tabularnewline
Trimmed Mean ( 6 / 24 ) & 110425.916666667 & 1162.20638556612 & 95.0140336846261 \tabularnewline
Trimmed Mean ( 7 / 24 ) & 110404.172413793 & 1119.27404718546 & 98.6390890518874 \tabularnewline
Trimmed Mean ( 8 / 24 ) & 110365.803571429 & 1092.85880446939 & 100.988163448081 \tabularnewline
Trimmed Mean ( 9 / 24 ) & 110316.055555556 & 1065.54883691041 & 103.529797728858 \tabularnewline
Trimmed Mean ( 10 / 24 ) & 110288.711538462 & 1042.8143826222 & 105.760635235137 \tabularnewline
Trimmed Mean ( 11 / 24 ) & 110263.78 & 1016.79148958769 & 108.44286279846 \tabularnewline
Trimmed Mean ( 12 / 24 ) & 110242.5 & 987.126484706246 & 111.680216981319 \tabularnewline
Trimmed Mean ( 13 / 24 ) & 110255.804347826 & 960.978562560093 & 114.732844876476 \tabularnewline
Trimmed Mean ( 14 / 24 ) & 110277.795454545 & 929.052578168552 & 118.699197489917 \tabularnewline
Trimmed Mean ( 15 / 24 ) & 110288.952380952 & 899.916042639909 & 122.554713056808 \tabularnewline
Trimmed Mean ( 16 / 24 ) & 110306.8 & 872.603313404265 & 126.411163360889 \tabularnewline
Trimmed Mean ( 17 / 24 ) & 110272.447368421 & 855.904969480528 & 128.837255653917 \tabularnewline
Trimmed Mean ( 18 / 24 ) & 110234.861111111 & 833.531588943283 & 132.25037007999 \tabularnewline
Trimmed Mean ( 19 / 24 ) & 110202.676470588 & 807.181159185696 & 136.527810661195 \tabularnewline
Trimmed Mean ( 20 / 24 ) & 110201.03125 & 787.680856708445 & 139.905686816495 \tabularnewline
Trimmed Mean ( 21 / 24 ) & 110197.833333333 & 763.929266574793 & 144.251356971077 \tabularnewline
Trimmed Mean ( 22 / 24 ) & 110164.25 & 743.320199942701 & 148.205645438523 \tabularnewline
Trimmed Mean ( 23 / 24 ) & 110144.692307692 & 718.338068619785 & 153.332667610564 \tabularnewline
Trimmed Mean ( 24 / 24 ) & 110150.125 & 691.417597845548 & 159.310560424304 \tabularnewline
Median & 110038 &  &  \tabularnewline
Midrange & 111984.5 &  &  \tabularnewline
Midmean - Weighted Average at Xnp & 110017.297297297 &  &  \tabularnewline
Midmean - Weighted Average at X(n+1)p & 110234.861111111 &  &  \tabularnewline
Midmean - Empirical Distribution Function & 110017.297297297 &  &  \tabularnewline
Midmean - Empirical Distribution Function - Averaging & 110234.861111111 &  &  \tabularnewline
Midmean - Empirical Distribution Function - Interpolation & 110234.861111111 &  &  \tabularnewline
Midmean - Closest Observation & 110017.297297297 &  &  \tabularnewline
Midmean - True Basic - Statistics Graphics Toolkit & 110234.861111111 &  &  \tabularnewline
Midmean - MS Excel (old versions) & 110272.447368421 &  &  \tabularnewline
Number of observations & 72 &  &  \tabularnewline
\hline
\end{tabular}
%Source: https://freestatistics.org/blog/index.php?pk=&T=1

[TABLE]
[ROW][C]Central Tendency - Ungrouped Data[/C][/ROW]
[ROW][C]Measure[/C][C]Value[/C][C]S.E.[/C][C]Value/S.E.[/C][/ROW]
[ROW][C]Arithmetic Mean[/C][C]110668.5[/C][C]1429.21013361403[/C][C]77.4333300591379[/C][/ROW]
[ROW][C]Geometric Mean[/C][C]110014.489692128[/C][C][/C][C][/C][/ROW]
[ROW][C]Harmonic Mean[/C][C]109362.224688641[/C][C][/C][C][/C][/ROW]
[ROW][C]Quadratic Mean[/C][C]111321.805798674[/C][C][/C][C][/C][/ROW]
[ROW][C]Winsorized Mean ( 1 / 24 )[/C][C]110658.541666667[/C][C]1423.50056726333[/C][C]77.7369143444789[/C][/ROW]
[ROW][C]Winsorized Mean ( 2 / 24 )[/C][C]110709.041666667[/C][C]1392.61205813361[/C][C]79.4974027548205[/C][/ROW]
[ROW][C]Winsorized Mean ( 3 / 24 )[/C][C]110709.041666667[/C][C]1372.90513936294[/C][C]80.6385222784136[/C][/ROW]
[ROW][C]Winsorized Mean ( 4 / 24 )[/C][C]110598.263888889[/C][C]1340.90649505448[/C][C]82.4802208780378[/C][/ROW]
[ROW][C]Winsorized Mean ( 5 / 24 )[/C][C]110533.263888889[/C][C]1322.4912942599[/C][C]83.579577702057[/C][/ROW]
[ROW][C]Winsorized Mean ( 6 / 24 )[/C][C]110531.013888889[/C][C]1298.54410116311[/C][C]85.1191836995646[/C][/ROW]
[ROW][C]Winsorized Mean ( 7 / 24 )[/C][C]110613.069444444[/C][C]1201.49878792007[/C][C]92.0625726438962[/C][/ROW]
[ROW][C]Winsorized Mean ( 8 / 24 )[/C][C]110664.291666667[/C][C]1178.81357035835[/C][C]93.877687235163[/C][/ROW]
[ROW][C]Winsorized Mean ( 9 / 24 )[/C][C]110493.791666667[/C][C]1130.80548848706[/C][C]97.7124649567276[/C][/ROW]
[ROW][C]Winsorized Mean ( 10 / 24 )[/C][C]110461.847222222[/C][C]1118.14567908112[/C][C]98.7902106932959[/C][/ROW]
[ROW][C]Winsorized Mean ( 11 / 24 )[/C][C]110419.833333333[/C][C]1102.39302317415[/C][C]100.163762843309[/C][/ROW]
[ROW][C]Winsorized Mean ( 12 / 24 )[/C][C]110140.5[/C][C]1050.15709477626[/C][C]104.880022758372[/C][/ROW]
[ROW][C]Winsorized Mean ( 13 / 24 )[/C][C]110081.097222222[/C][C]1040.10079435868[/C][C]105.836951398636[/C][/ROW]
[ROW][C]Winsorized Mean ( 14 / 24 )[/C][C]110186.680555556[/C][C]986.149017002448[/C][C]111.734310591806[/C][/ROW]
[ROW][C]Winsorized Mean ( 15 / 24 )[/C][C]110140.222222222[/C][C]937.561426307344[/C][C]117.47520656435[/C][/ROW]
[ROW][C]Winsorized Mean ( 16 / 24 )[/C][C]110596.888888889[/C][C]851.50967828938[/C][C]129.88330222044[/C][/ROW]
[ROW][C]Winsorized Mean ( 17 / 24 )[/C][C]110591.930555556[/C][C]844.951098752244[/C][C]130.885598845742[/C][/ROW]
[ROW][C]Winsorized Mean ( 18 / 24 )[/C][C]110508.430555556[/C][C]823.695239363393[/C][C]134.161793433411[/C][/ROW]
[ROW][C]Winsorized Mean ( 19 / 24 )[/C][C]110216.569444444[/C][C]756.621726971612[/C][C]145.669316007601[/C][/ROW]
[ROW][C]Winsorized Mean ( 20 / 24 )[/C][C]110227.680555556[/C][C]736.185037579881[/C][C]149.728227183095[/C][/ROW]
[ROW][C]Winsorized Mean ( 21 / 24 )[/C][C]110472.097222222[/C][C]684.032647478754[/C][C]161.50120557755[/C][/ROW]
[ROW][C]Winsorized Mean ( 22 / 24 )[/C][C]110319.625[/C][C]659.943998204276[/C][C]167.165131132615[/C][/ROW]
[ROW][C]Winsorized Mean ( 23 / 24 )[/C][C]110103.041666667[/C][C]622.38186478815[/C][C]176.905928491577[/C][/ROW]
[ROW][C]Winsorized Mean ( 24 / 24 )[/C][C]110310.041666667[/C][C]578.090643778886[/C][C]190.817898289423[/C][/ROW]
[ROW][C]Trimmed Mean ( 1 / 24 )[/C][C]110630.9[/C][C]1379.36364617351[/C][C]80.2043031269532[/C][/ROW]
[ROW][C]Trimmed Mean ( 2 / 24 )[/C][C]110601.632352941[/C][C]1326.82755189219[/C][C]83.3579557458026[/C][/ROW]
[ROW][C]Trimmed Mean ( 3 / 24 )[/C][C]110543.045454545[/C][C]1284.0598740355[/C][C]86.0887001375833[/C][/ROW]
[ROW][C]Trimmed Mean ( 4 / 24 )[/C][C]110480.796875[/C][C]1241.8850239807[/C][C]88.9621782545282[/C][/ROW]
[ROW][C]Trimmed Mean ( 5 / 24 )[/C][C]110446.693548387[/C][C]1203.16875024218[/C][C]91.7965111096473[/C][/ROW]
[ROW][C]Trimmed Mean ( 6 / 24 )[/C][C]110425.916666667[/C][C]1162.20638556612[/C][C]95.0140336846261[/C][/ROW]
[ROW][C]Trimmed Mean ( 7 / 24 )[/C][C]110404.172413793[/C][C]1119.27404718546[/C][C]98.6390890518874[/C][/ROW]
[ROW][C]Trimmed Mean ( 8 / 24 )[/C][C]110365.803571429[/C][C]1092.85880446939[/C][C]100.988163448081[/C][/ROW]
[ROW][C]Trimmed Mean ( 9 / 24 )[/C][C]110316.055555556[/C][C]1065.54883691041[/C][C]103.529797728858[/C][/ROW]
[ROW][C]Trimmed Mean ( 10 / 24 )[/C][C]110288.711538462[/C][C]1042.8143826222[/C][C]105.760635235137[/C][/ROW]
[ROW][C]Trimmed Mean ( 11 / 24 )[/C][C]110263.78[/C][C]1016.79148958769[/C][C]108.44286279846[/C][/ROW]
[ROW][C]Trimmed Mean ( 12 / 24 )[/C][C]110242.5[/C][C]987.126484706246[/C][C]111.680216981319[/C][/ROW]
[ROW][C]Trimmed Mean ( 13 / 24 )[/C][C]110255.804347826[/C][C]960.978562560093[/C][C]114.732844876476[/C][/ROW]
[ROW][C]Trimmed Mean ( 14 / 24 )[/C][C]110277.795454545[/C][C]929.052578168552[/C][C]118.699197489917[/C][/ROW]
[ROW][C]Trimmed Mean ( 15 / 24 )[/C][C]110288.952380952[/C][C]899.916042639909[/C][C]122.554713056808[/C][/ROW]
[ROW][C]Trimmed Mean ( 16 / 24 )[/C][C]110306.8[/C][C]872.603313404265[/C][C]126.411163360889[/C][/ROW]
[ROW][C]Trimmed Mean ( 17 / 24 )[/C][C]110272.447368421[/C][C]855.904969480528[/C][C]128.837255653917[/C][/ROW]
[ROW][C]Trimmed Mean ( 18 / 24 )[/C][C]110234.861111111[/C][C]833.531588943283[/C][C]132.25037007999[/C][/ROW]
[ROW][C]Trimmed Mean ( 19 / 24 )[/C][C]110202.676470588[/C][C]807.181159185696[/C][C]136.527810661195[/C][/ROW]
[ROW][C]Trimmed Mean ( 20 / 24 )[/C][C]110201.03125[/C][C]787.680856708445[/C][C]139.905686816495[/C][/ROW]
[ROW][C]Trimmed Mean ( 21 / 24 )[/C][C]110197.833333333[/C][C]763.929266574793[/C][C]144.251356971077[/C][/ROW]
[ROW][C]Trimmed Mean ( 22 / 24 )[/C][C]110164.25[/C][C]743.320199942701[/C][C]148.205645438523[/C][/ROW]
[ROW][C]Trimmed Mean ( 23 / 24 )[/C][C]110144.692307692[/C][C]718.338068619785[/C][C]153.332667610564[/C][/ROW]
[ROW][C]Trimmed Mean ( 24 / 24 )[/C][C]110150.125[/C][C]691.417597845548[/C][C]159.310560424304[/C][/ROW]
[ROW][C]Median[/C][C]110038[/C][C][/C][C][/C][/ROW]
[ROW][C]Midrange[/C][C]111984.5[/C][C][/C][C][/C][/ROW]
[ROW][C]Midmean - Weighted Average at Xnp[/C][C]110017.297297297[/C][C][/C][C][/C][/ROW]
[ROW][C]Midmean - Weighted Average at X(n+1)p[/C][C]110234.861111111[/C][C][/C][C][/C][/ROW]
[ROW][C]Midmean - Empirical Distribution Function[/C][C]110017.297297297[/C][C][/C][C][/C][/ROW]
[ROW][C]Midmean - Empirical Distribution Function - Averaging[/C][C]110234.861111111[/C][C][/C][C][/C][/ROW]
[ROW][C]Midmean - Empirical Distribution Function - Interpolation[/C][C]110234.861111111[/C][C][/C][C][/C][/ROW]
[ROW][C]Midmean - Closest Observation[/C][C]110017.297297297[/C][C][/C][C][/C][/ROW]
[ROW][C]Midmean - True Basic - Statistics Graphics Toolkit[/C][C]110234.861111111[/C][C][/C][C][/C][/ROW]
[ROW][C]Midmean - MS Excel (old versions)[/C][C]110272.447368421[/C][C][/C][C][/C][/ROW]
[ROW][C]Number of observations[/C][C]72[/C][C][/C][C][/C][/ROW]
[/TABLE]
Source: https://freestatistics.org/blog/index.php?pk=&T=1

Globally Unique Identifier (entire table): ba.freestatistics.org/blog/index.php?pk=&T=1

As an alternative you can also use a QR Code:  

The GUIDs for individual cells are displayed in the table below:

Central Tendency - Ungrouped Data
MeasureValueS.E.Value/S.E.
Arithmetic Mean110668.51429.2101336140377.4333300591379
Geometric Mean110014.489692128
Harmonic Mean109362.224688641
Quadratic Mean111321.805798674
Winsorized Mean ( 1 / 24 )110658.5416666671423.5005672633377.7369143444789
Winsorized Mean ( 2 / 24 )110709.0416666671392.6120581336179.4974027548205
Winsorized Mean ( 3 / 24 )110709.0416666671372.9051393629480.6385222784136
Winsorized Mean ( 4 / 24 )110598.2638888891340.9064950544882.4802208780378
Winsorized Mean ( 5 / 24 )110533.2638888891322.491294259983.579577702057
Winsorized Mean ( 6 / 24 )110531.0138888891298.5441011631185.1191836995646
Winsorized Mean ( 7 / 24 )110613.0694444441201.4987879200792.0625726438962
Winsorized Mean ( 8 / 24 )110664.2916666671178.8135703583593.877687235163
Winsorized Mean ( 9 / 24 )110493.7916666671130.8054884870697.7124649567276
Winsorized Mean ( 10 / 24 )110461.8472222221118.1456790811298.7902106932959
Winsorized Mean ( 11 / 24 )110419.8333333331102.39302317415100.163762843309
Winsorized Mean ( 12 / 24 )110140.51050.15709477626104.880022758372
Winsorized Mean ( 13 / 24 )110081.0972222221040.10079435868105.836951398636
Winsorized Mean ( 14 / 24 )110186.680555556986.149017002448111.734310591806
Winsorized Mean ( 15 / 24 )110140.222222222937.561426307344117.47520656435
Winsorized Mean ( 16 / 24 )110596.888888889851.50967828938129.88330222044
Winsorized Mean ( 17 / 24 )110591.930555556844.951098752244130.885598845742
Winsorized Mean ( 18 / 24 )110508.430555556823.695239363393134.161793433411
Winsorized Mean ( 19 / 24 )110216.569444444756.621726971612145.669316007601
Winsorized Mean ( 20 / 24 )110227.680555556736.185037579881149.728227183095
Winsorized Mean ( 21 / 24 )110472.097222222684.032647478754161.50120557755
Winsorized Mean ( 22 / 24 )110319.625659.943998204276167.165131132615
Winsorized Mean ( 23 / 24 )110103.041666667622.38186478815176.905928491577
Winsorized Mean ( 24 / 24 )110310.041666667578.090643778886190.817898289423
Trimmed Mean ( 1 / 24 )110630.91379.3636461735180.2043031269532
Trimmed Mean ( 2 / 24 )110601.6323529411326.8275518921983.3579557458026
Trimmed Mean ( 3 / 24 )110543.0454545451284.059874035586.0887001375833
Trimmed Mean ( 4 / 24 )110480.7968751241.885023980788.9621782545282
Trimmed Mean ( 5 / 24 )110446.6935483871203.1687502421891.7965111096473
Trimmed Mean ( 6 / 24 )110425.9166666671162.2063855661295.0140336846261
Trimmed Mean ( 7 / 24 )110404.1724137931119.2740471854698.6390890518874
Trimmed Mean ( 8 / 24 )110365.8035714291092.85880446939100.988163448081
Trimmed Mean ( 9 / 24 )110316.0555555561065.54883691041103.529797728858
Trimmed Mean ( 10 / 24 )110288.7115384621042.8143826222105.760635235137
Trimmed Mean ( 11 / 24 )110263.781016.79148958769108.44286279846
Trimmed Mean ( 12 / 24 )110242.5987.126484706246111.680216981319
Trimmed Mean ( 13 / 24 )110255.804347826960.978562560093114.732844876476
Trimmed Mean ( 14 / 24 )110277.795454545929.052578168552118.699197489917
Trimmed Mean ( 15 / 24 )110288.952380952899.916042639909122.554713056808
Trimmed Mean ( 16 / 24 )110306.8872.603313404265126.411163360889
Trimmed Mean ( 17 / 24 )110272.447368421855.904969480528128.837255653917
Trimmed Mean ( 18 / 24 )110234.861111111833.531588943283132.25037007999
Trimmed Mean ( 19 / 24 )110202.676470588807.181159185696136.527810661195
Trimmed Mean ( 20 / 24 )110201.03125787.680856708445139.905686816495
Trimmed Mean ( 21 / 24 )110197.833333333763.929266574793144.251356971077
Trimmed Mean ( 22 / 24 )110164.25743.320199942701148.205645438523
Trimmed Mean ( 23 / 24 )110144.692307692718.338068619785153.332667610564
Trimmed Mean ( 24 / 24 )110150.125691.417597845548159.310560424304
Median110038
Midrange111984.5
Midmean - Weighted Average at Xnp110017.297297297
Midmean - Weighted Average at X(n+1)p110234.861111111
Midmean - Empirical Distribution Function110017.297297297
Midmean - Empirical Distribution Function - Averaging110234.861111111
Midmean - Empirical Distribution Function - Interpolation110234.861111111
Midmean - Closest Observation110017.297297297
Midmean - True Basic - Statistics Graphics Toolkit110234.861111111
Midmean - MS Excel (old versions)110272.447368421
Number of observations72


Parameters (Session):
Parameters (R input):
R code (references can be found in the software module):
geomean <- function(x) {
return(exp(mean(log(x))))
}
harmean <- function(x) {
return(1/mean(1/x))
}
quamean <- function(x) {
return(sqrt(mean(x*x)))
}
winmean <- function(x) {
x <-sort(x[!is.na(x)])
n<-length(x)
denom <- 3
nodenom <- n/denom
if (nodenom>40) denom <- n/40
sqrtn = sqrt(n)
roundnodenom = floor(nodenom)
win <- array(NA,dim=c(roundnodenom,2))
for (j in 1:roundnodenom) {
win[j,1] <- (j*x[j+1]+sum(x[(j+1):(n-j)])+j*x[n-j])/n
win[j,2] <- sd(c(rep(x[j+1],j),x[(j+1):(n-j)],rep(x[n-j],j)))/sqrtn
}
return(win)
}
trimean <- function(x) {
x <-sort(x[!is.na(x)])
n<-length(x)
denom <- 3
nodenom <- n/denom
if (nodenom>40) denom <- n/40
sqrtn = sqrt(n)
roundnodenom = floor(nodenom)
tri <- array(NA,dim=c(roundnodenom,2))
for (j in 1:roundnodenom) {
tri[j,1] <- mean(x,trim=j/n)
tri[j,2] <- sd(x[(j+1):(n-j)]) / sqrt(n-j*2)
}
return(tri)
}
midrange <- function(x) {
return((max(x)+min(x))/2)
}
q1 <- function(data,n,p,i,f) {
np <- n*p;
i <<- floor(np)
f <<- np - i
qvalue <- (1-f)*data[i] + f*data[i+1]
}
q2 <- function(data,n,p,i,f) {
np <- (n+1)*p
i <<- floor(np)
f <<- np - i
qvalue <- (1-f)*data[i] + f*data[i+1]
}
q3 <- function(data,n,p,i,f) {
np <- n*p
i <<- floor(np)
f <<- np - i
if (f==0) {
qvalue <- data[i]
} else {
qvalue <- data[i+1]
}
}
q4 <- function(data,n,p,i,f) {
np <- n*p
i <<- floor(np)
f <<- np - i
if (f==0) {
qvalue <- (data[i]+data[i+1])/2
} else {
qvalue <- data[i+1]
}
}
q5 <- function(data,n,p,i,f) {
np <- (n-1)*p
i <<- floor(np)
f <<- np - i
if (f==0) {
qvalue <- data[i+1]
} else {
qvalue <- data[i+1] + f*(data[i+2]-data[i+1])
}
}
q6 <- function(data,n,p,i,f) {
np <- n*p+0.5
i <<- floor(np)
f <<- np - i
qvalue <- data[i]
}
q7 <- function(data,n,p,i,f) {
np <- (n+1)*p
i <<- floor(np)
f <<- np - i
if (f==0) {
qvalue <- data[i]
} else {
qvalue <- f*data[i] + (1-f)*data[i+1]
}
}
q8 <- function(data,n,p,i,f) {
np <- (n+1)*p
i <<- floor(np)
f <<- np - i
if (f==0) {
qvalue <- data[i]
} else {
if (f == 0.5) {
qvalue <- (data[i]+data[i+1])/2
} else {
if (f < 0.5) {
qvalue <- data[i]
} else {
qvalue <- data[i+1]
}
}
}
}
midmean <- function(x,def) {
x <-sort(x[!is.na(x)])
n<-length(x)
if (def==1) {
qvalue1 <- q1(x,n,0.25,i,f)
qvalue3 <- q1(x,n,0.75,i,f)
}
if (def==2) {
qvalue1 <- q2(x,n,0.25,i,f)
qvalue3 <- q2(x,n,0.75,i,f)
}
if (def==3) {
qvalue1 <- q3(x,n,0.25,i,f)
qvalue3 <- q3(x,n,0.75,i,f)
}
if (def==4) {
qvalue1 <- q4(x,n,0.25,i,f)
qvalue3 <- q4(x,n,0.75,i,f)
}
if (def==5) {
qvalue1 <- q5(x,n,0.25,i,f)
qvalue3 <- q5(x,n,0.75,i,f)
}
if (def==6) {
qvalue1 <- q6(x,n,0.25,i,f)
qvalue3 <- q6(x,n,0.75,i,f)
}
if (def==7) {
qvalue1 <- q7(x,n,0.25,i,f)
qvalue3 <- q7(x,n,0.75,i,f)
}
if (def==8) {
qvalue1 <- q8(x,n,0.25,i,f)
qvalue3 <- q8(x,n,0.75,i,f)
}
midm <- 0
myn <- 0
roundno4 <- round(n/4)
round3no4 <- round(3*n/4)
for (i in 1:n) {
if ((x[i]>=qvalue1) & (x[i]<=qvalue3)){
midm = midm + x[i]
myn = myn + 1
}
}
midm = midm / myn
return(midm)
}
(arm <- mean(x))
sqrtn <- sqrt(length(x))
(armse <- sd(x) / sqrtn)
(armose <- arm / armse)
(geo <- geomean(x))
(har <- harmean(x))
(qua <- quamean(x))
(win <- winmean(x))
(tri <- trimean(x))
(midr <- midrange(x))
midm <- array(NA,dim=8)
for (j in 1:8) midm[j] <- midmean(x,j)
midm
bitmap(file='test1.png')
lb <- win[,1] - 2*win[,2]
ub <- win[,1] + 2*win[,2]
if ((ylimmin == '') | (ylimmax == '')) plot(win[,1],type='b',main=main, xlab='j', pch=19, ylab='Winsorized Mean(j/n)', ylim=c(min(lb),max(ub))) else plot(win[,1],type='l',main=main, xlab='j', pch=19, ylab='Winsorized Mean(j/n)', ylim=c(ylimmin,ylimmax))
lines(ub,lty=3)
lines(lb,lty=3)
grid()
dev.off()
bitmap(file='test2.png')
lb <- tri[,1] - 2*tri[,2]
ub <- tri[,1] + 2*tri[,2]
if ((ylimmin == '') | (ylimmax == '')) plot(tri[,1],type='b',main=main, xlab='j', pch=19, ylab='Trimmed Mean(j/n)', ylim=c(min(lb),max(ub))) else plot(tri[,1],type='l',main=main, xlab='j', pch=19, ylab='Trimmed Mean(j/n)', ylim=c(ylimmin,ylimmax))
lines(ub,lty=3)
lines(lb,lty=3)
grid()
dev.off()
load(file='createtable')
a<-table.start()
a<-table.row.start(a)
a<-table.element(a,'Central Tendency - Ungrouped Data',4,TRUE)
a<-table.row.end(a)
a<-table.row.start(a)
a<-table.element(a,'Measure',header=TRUE)
a<-table.element(a,'Value',header=TRUE)
a<-table.element(a,'S.E.',header=TRUE)
a<-table.element(a,'Value/S.E.',header=TRUE)
a<-table.row.end(a)
a<-table.row.start(a)
a<-table.element(a,hyperlink('arithmetic_mean.htm', 'Arithmetic Mean', 'click to view the definition of the Arithmetic Mean'),header=TRUE)
a<-table.element(a,arm)
a<-table.element(a,hyperlink('arithmetic_mean_standard_error.htm', armse, 'click to view the definition of the Standard Error of the Arithmetic Mean'))
a<-table.element(a,armose)
a<-table.row.end(a)
a<-table.row.start(a)
a<-table.element(a,hyperlink('geometric_mean.htm', 'Geometric Mean', 'click to view the definition of the Geometric Mean'),header=TRUE)
a<-table.element(a,geo)
a<-table.element(a,'')
a<-table.row.end(a)
a<-table.row.start(a)
a<-table.element(a,hyperlink('harmonic_mean.htm', 'Harmonic Mean', 'click to view the definition of the Harmonic Mean'),header=TRUE)
a<-table.element(a,har)
a<-table.element(a,'')
a<-table.row.end(a)
a<-table.row.start(a)
a<-table.element(a,hyperlink('quadratic_mean.htm', 'Quadratic Mean', 'click to view the definition of the Quadratic Mean'),header=TRUE)
a<-table.element(a,qua)
a<-table.element(a,'')
a<-table.row.end(a)
for (j in 1:length(win[,1])) {
a<-table.row.start(a)
mylabel <- paste('Winsorized Mean (',j)
mylabel <- paste(mylabel,'/')
mylabel <- paste(mylabel,length(win[,1]))
mylabel <- paste(mylabel,')')
a<-table.element(a,hyperlink('winsorized_mean.htm', mylabel, 'click to view the definition of the Winsorized Mean'),header=TRUE)
a<-table.element(a,win[j,1])
a<-table.element(a,win[j,2])
a<-table.element(a,win[j,1]/win[j,2])
a<-table.row.end(a)
}
for (j in 1:length(tri[,1])) {
a<-table.row.start(a)
mylabel <- paste('Trimmed Mean (',j)
mylabel <- paste(mylabel,'/')
mylabel <- paste(mylabel,length(tri[,1]))
mylabel <- paste(mylabel,')')
a<-table.element(a,hyperlink('arithmetic_mean.htm', mylabel, 'click to view the definition of the Trimmed Mean'),header=TRUE)
a<-table.element(a,tri[j,1])
a<-table.element(a,tri[j,2])
a<-table.element(a,tri[j,1]/tri[j,2])
a<-table.row.end(a)
}
a<-table.row.start(a)
a<-table.element(a,hyperlink('median_1.htm', 'Median', 'click to view the definition of the Median'),header=TRUE)
a<-table.element(a,median(x))
a<-table.element(a,'')
a<-table.row.end(a)
a<-table.row.start(a)
a<-table.element(a,hyperlink('midrange.htm', 'Midrange', 'click to view the definition of the Midrange'),header=TRUE)
a<-table.element(a,midr)
a<-table.element(a,'')
a<-table.row.end(a)
a<-table.row.start(a)
mymid <- hyperlink('midmean.htm', 'Midmean', 'click to view the definition of the Midmean')
mylabel <- paste(mymid,hyperlink('method_1.htm','Weighted Average at Xnp',''),sep=' - ')
a<-table.element(a,mylabel,header=TRUE)
a<-table.element(a,midm[1])
a<-table.element(a,'')
a<-table.row.end(a)
a<-table.row.start(a)
mymid <- hyperlink('midmean.htm', 'Midmean', 'click to view the definition of the Midmean')
mylabel <- paste(mymid,hyperlink('method_2.htm','Weighted Average at X(n+1)p',''),sep=' - ')
a<-table.element(a,mylabel,header=TRUE)
a<-table.element(a,midm[2])
a<-table.element(a,'')
a<-table.row.end(a)
a<-table.row.start(a)
mymid <- hyperlink('midmean.htm', 'Midmean', 'click to view the definition of the Midmean')
mylabel <- paste(mymid,hyperlink('method_3.htm','Empirical Distribution Function',''),sep=' - ')
a<-table.element(a,mylabel,header=TRUE)
a<-table.element(a,midm[3])
a<-table.element(a,'')
a<-table.row.end(a)
a<-table.row.start(a)
mymid <- hyperlink('midmean.htm', 'Midmean', 'click to view the definition of the Midmean')
mylabel <- paste(mymid,hyperlink('method_4.htm','Empirical Distribution Function - Averaging',''),sep=' - ')
a<-table.element(a,mylabel,header=TRUE)
a<-table.element(a,midm[4])
a<-table.element(a,'')
a<-table.row.end(a)
a<-table.row.start(a)
mymid <- hyperlink('midmean.htm', 'Midmean', 'click to view the definition of the Midmean')
mylabel <- paste(mymid,hyperlink('method_5.htm','Empirical Distribution Function - Interpolation',''),sep=' - ')
a<-table.element(a,mylabel,header=TRUE)
a<-table.element(a,midm[5])
a<-table.element(a,'')
a<-table.row.end(a)
a<-table.row.start(a)
mymid <- hyperlink('midmean.htm', 'Midmean', 'click to view the definition of the Midmean')
mylabel <- paste(mymid,hyperlink('method_6.htm','Closest Observation',''),sep=' - ')
a<-table.element(a,mylabel,header=TRUE)
a<-table.element(a,midm[6])
a<-table.element(a,'')
a<-table.row.end(a)
a<-table.row.start(a)
mymid <- hyperlink('midmean.htm', 'Midmean', 'click to view the definition of the Midmean')
mylabel <- paste(mymid,hyperlink('method_7.htm','True Basic - Statistics Graphics Toolkit',''),sep=' - ')
a<-table.element(a,mylabel,header=TRUE)
a<-table.element(a,midm[7])
a<-table.element(a,'')
a<-table.row.end(a)
a<-table.row.start(a)
mymid <- hyperlink('midmean.htm', 'Midmean', 'click to view the definition of the Midmean')
mylabel <- paste(mymid,hyperlink('method_8.htm','MS Excel (old versions)',''),sep=' - ')
a<-table.element(a,mylabel,header=TRUE)
a<-table.element(a,midm[8])
a<-table.element(a,'')
a<-table.row.end(a)
a<-table.row.start(a)
a<-table.element(a,'Number of observations',header=TRUE)
a<-table.element(a,length(x))
a<-table.element(a,'')
a<-table.row.end(a)
a<-table.end(a)
table.save(a,file='mytable.tab')