Free Statistics

of Irreproducible Research!

Author's title

Author*Unverified author*
R Software Modulerwasp_centraltendency.wasp
Title produced by softwareCentral Tendency
Date of computationTue, 14 Mar 2017 17:13:27 +0000
Cite this page as followsStatistical Computations at FreeStatistics.org, Office for Research Development and Education, URL https://freestatistics.org/blog/index.php?v=date/2017/Mar/14/t1489511705ho48r8wehhsbcbd.htm/, Retrieved Tue, 14 May 2024 21:09:24 +0200
Statistical Computations at FreeStatistics.org, Office for Research Development and Education, URL https://freestatistics.org/blog/index.php?pk=, Retrieved Tue, 14 May 2024 21:09:24 +0200
QR Codes:

Original text written by user:
IsPrivate?No (this computation is public)
User-defined keywords
Estimated Impact0
Dataseries X:
101,16
100,81
100,94
101,13
101,29
101,34
101,35
101,7
102,05
102,48
102,66
102,72
102,73
102,18
102,22
102,37
102,53
102,61
102,62
103
103,17
103,52
103,69
103,73
99,57
99,09
99,14
99,36
99,6
99,65
99,8
100,15
100,45
100,89
101,13
101,17
101,21
101,1
101,17
101,11
101,2
101,15
100,92
101,1
101,22
101,25
101,39
101,43
101,95
101,92
102,05
102,07
102,1
102,16
101,63
101,43
101,4
101,6
101,72
101,73
102,67
102,59
102,69
102,93
103,02
103,06
102,47
102,4
102,42
102,51
102,61
102,78


Summary of computational transaction
Raw Inputview raw input (R code)
Raw Outputview raw output of R engine
Computing time2 seconds
R Server'Sir Maurice George Kendall' @ kendall.wessa.net

\begin{tabular}{lllllllll}
\hline
Summary of computational transaction \tabularnewline
Raw Input & view raw input (R code)  \tabularnewline
Raw Output & view raw output of R engine  \tabularnewline
Computing time & 2 seconds \tabularnewline
R Server & 'Sir Maurice George Kendall' @ kendall.wessa.net \tabularnewline
\hline
\end{tabular}
%Source: https://freestatistics.org/blog/index.php?pk=&T=0

[TABLE]
[ROW][C]Summary of computational transaction[/C][/ROW]
[ROW][C]Raw Input[/C][C]view raw input (R code) [/C][/ROW]
[ROW][C]Raw Output[/C][C]view raw output of R engine [/C][/ROW]
[ROW][C]Computing time[/C][C]2 seconds[/C][/ROW]
[ROW][C]R Server[/C][C]'Sir Maurice George Kendall' @ kendall.wessa.net[/C][/ROW]
[/TABLE]
Source: https://freestatistics.org/blog/index.php?pk=&T=0

Globally Unique Identifier (entire table): ba.freestatistics.org/blog/index.php?pk=&T=0

As an alternative you can also use a QR Code:  

The GUIDs for individual cells are displayed in the table below:

Summary of computational transaction
Raw Inputview raw input (R code)
Raw Outputview raw output of R engine
Computing time2 seconds
R Server'Sir Maurice George Kendall' @ kendall.wessa.net


Central Tendency - Ungrouped Data
MeasureValueS.E.Value/S.E.
Arithmetic Mean101.6966666666670.126564698270096803.515261812111
Geometric Mean101.691054487328
Harmonic Mean101.685421728713
Quadratic Mean101.702258250903
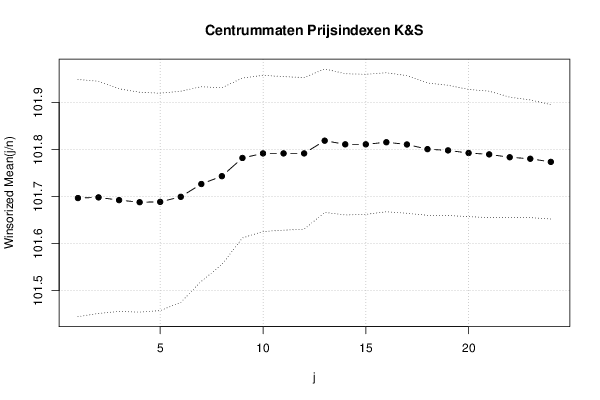
Winsorized Mean ( 1 / 24 )101.6968055555560.126240298344122805.581156647282
Winsorized Mean ( 2 / 24 )101.6981944444440.123537663247153823.216108928534
Winsorized Mean ( 3 / 24 )101.6923611111110.118465754950831858.411455304687
Winsorized Mean ( 4 / 24 )101.6879166666670.117004363290227869.09508164607
Winsorized Mean ( 5 / 24 )101.6886111111110.115682520046334879.031776541364
Winsorized Mean ( 6 / 24 )101.6994444444440.112371451315582905.029197841657
Winsorized Mean ( 7 / 24 )101.7266666666670.10354400756368982.44861349513
Winsorized Mean ( 8 / 24 )101.7433333333330.09406445697354391081.63419645264
Winsorized Mean ( 9 / 24 )101.7820833333330.08507405811320971196.39389010796
Winsorized Mean ( 10 / 24 )101.7918055555560.0831122245972251224.75130522441
Winsorized Mean ( 11 / 24 )101.7918055555560.08170218792237071245.88836779099
Winsorized Mean ( 12 / 24 )101.7918055555560.080690323226991261.51193209631
Winsorized Mean ( 13 / 24 )101.8188888888890.07634207556893871333.71915984841
Winsorized Mean ( 14 / 24 )101.8111111111110.07514892766011151354.79126956527
Winsorized Mean ( 15 / 24 )101.8111111111110.07455700037548751365.54730740729
Winsorized Mean ( 16 / 24 )101.8155555555560.0739725895838281376.3957180406
Winsorized Mean ( 17 / 24 )101.8108333333330.07326174215680251389.68621733602
Winsorized Mean ( 18 / 24 )101.8008333333330.07039063538067941446.22694173429
Winsorized Mean ( 19 / 24 )101.7981944444440.06928071269383011469.35836088058
Winsorized Mean ( 20 / 24 )101.7926388888890.06772198560247581503.09589985158
Winsorized Mean ( 21 / 24 )101.7897222222220.06730590602034821512.34458074821
Winsorized Mean ( 22 / 24 )101.7836111111110.06396408957919011591.2617811139
Winsorized Mean ( 23 / 24 )101.7804166666670.0626615088465271624.28927327542
Winsorized Mean ( 24 / 24 )101.773750.06084770153169441672.59810047201
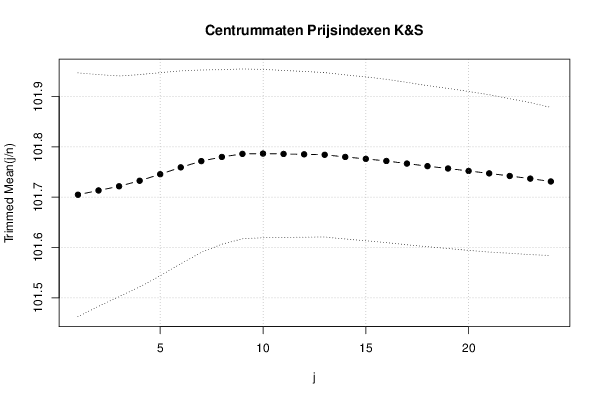
Trimmed Mean ( 1 / 24 )101.7048571428570.121202864156747839.129156315366
Trimmed Mean ( 2 / 24 )101.7133823529410.11516785671025883.175091196162
Trimmed Mean ( 3 / 24 )101.7216666666670.10969582511734927.306636855654
Trimmed Mean ( 4 / 24 )101.732656250.105511848190177964.182297959891
Trimmed Mean ( 5 / 24 )101.745645161290.1009823827035471007.55837243398
Trimmed Mean ( 6 / 24 )101.7593333333330.09587505601223091061.3744342465
Trimmed Mean ( 7 / 24 )101.7717241379310.09062635373327221122.98156050128
Trimmed Mean ( 8 / 24 )101.780.0867471321431721173.29527196377
Trimmed Mean ( 9 / 24 )101.7861111111110.08443978940054781205.42829196647
Trimmed Mean ( 10 / 24 )101.7867307692310.08366272208940621216.63183108549
Trimmed Mean ( 11 / 24 )101.7860.08302298673578681225.99781099089
Trimmed Mean ( 12 / 24 )101.7852083333330.08240672224316961235.15661784218
Trimmed Mean ( 13 / 24 )101.7843478260870.08171746552232631245.56417866727
Trimmed Mean ( 14 / 24 )101.780.08156438202044041247.8486010535
Trimmed Mean ( 15 / 24 )101.776190476190.08143026942283531249.85697821662
Trimmed Mean ( 16 / 24 )101.7720.08117186578409921253.78416544832
Trimmed Mean ( 17 / 24 )101.7668421052630.08072934362555591260.59295833352
Trimmed Mean ( 18 / 24 )101.7616666666670.08007486576313531270.83156115031
Trimmed Mean ( 19 / 24 )101.7570588235290.07962650045235961277.9295617093
Trimmed Mean ( 20 / 24 )101.75218750.07899154504444171288.1402363095
Trimmed Mean ( 21 / 24 )101.7473333333330.0782009397205691301.1011593582
Trimmed Mean ( 22 / 24 )101.7421428571430.07684306336292981324.02507662422
Trimmed Mean ( 23 / 24 )101.7369230769230.07554880079640671346.6384906769
Trimmed Mean ( 24 / 24 )101.731250.07362092610711671381.82518720266
Median101.71
Midrange101.41
Midmean - Weighted Average at Xnp101.728421052632
Midmean - Weighted Average at X(n+1)p101.761666666667
Midmean - Empirical Distribution Function101.728421052632
Midmean - Empirical Distribution Function - Averaging101.761666666667
Midmean - Empirical Distribution Function - Interpolation101.761666666667
Midmean - Closest Observation101.728421052632
Midmean - True Basic - Statistics Graphics Toolkit101.761666666667
Midmean - MS Excel (old versions)101.750512820513
Number of observations72

\begin{tabular}{lllllllll}
\hline
Central Tendency - Ungrouped Data \tabularnewline
Measure & Value & S.E. & Value/S.E. \tabularnewline
Arithmetic Mean & 101.696666666667 & 0.126564698270096 & 803.515261812111 \tabularnewline
Geometric Mean & 101.691054487328 &  &  \tabularnewline
Harmonic Mean & 101.685421728713 &  &  \tabularnewline
Quadratic Mean & 101.702258250903 &  &  \tabularnewline
Winsorized Mean ( 1 / 24 ) & 101.696805555556 & 0.126240298344122 & 805.581156647282 \tabularnewline
Winsorized Mean ( 2 / 24 ) & 101.698194444444 & 0.123537663247153 & 823.216108928534 \tabularnewline
Winsorized Mean ( 3 / 24 ) & 101.692361111111 & 0.118465754950831 & 858.411455304687 \tabularnewline
Winsorized Mean ( 4 / 24 ) & 101.687916666667 & 0.117004363290227 & 869.09508164607 \tabularnewline
Winsorized Mean ( 5 / 24 ) & 101.688611111111 & 0.115682520046334 & 879.031776541364 \tabularnewline
Winsorized Mean ( 6 / 24 ) & 101.699444444444 & 0.112371451315582 & 905.029197841657 \tabularnewline
Winsorized Mean ( 7 / 24 ) & 101.726666666667 & 0.10354400756368 & 982.44861349513 \tabularnewline
Winsorized Mean ( 8 / 24 ) & 101.743333333333 & 0.0940644569735439 & 1081.63419645264 \tabularnewline
Winsorized Mean ( 9 / 24 ) & 101.782083333333 & 0.0850740581132097 & 1196.39389010796 \tabularnewline
Winsorized Mean ( 10 / 24 ) & 101.791805555556 & 0.083112224597225 & 1224.75130522441 \tabularnewline
Winsorized Mean ( 11 / 24 ) & 101.791805555556 & 0.0817021879223707 & 1245.88836779099 \tabularnewline
Winsorized Mean ( 12 / 24 ) & 101.791805555556 & 0.08069032322699 & 1261.51193209631 \tabularnewline
Winsorized Mean ( 13 / 24 ) & 101.818888888889 & 0.0763420755689387 & 1333.71915984841 \tabularnewline
Winsorized Mean ( 14 / 24 ) & 101.811111111111 & 0.0751489276601115 & 1354.79126956527 \tabularnewline
Winsorized Mean ( 15 / 24 ) & 101.811111111111 & 0.0745570003754875 & 1365.54730740729 \tabularnewline
Winsorized Mean ( 16 / 24 ) & 101.815555555556 & 0.073972589583828 & 1376.3957180406 \tabularnewline
Winsorized Mean ( 17 / 24 ) & 101.810833333333 & 0.0732617421568025 & 1389.68621733602 \tabularnewline
Winsorized Mean ( 18 / 24 ) & 101.800833333333 & 0.0703906353806794 & 1446.22694173429 \tabularnewline
Winsorized Mean ( 19 / 24 ) & 101.798194444444 & 0.0692807126938301 & 1469.35836088058 \tabularnewline
Winsorized Mean ( 20 / 24 ) & 101.792638888889 & 0.0677219856024758 & 1503.09589985158 \tabularnewline
Winsorized Mean ( 21 / 24 ) & 101.789722222222 & 0.0673059060203482 & 1512.34458074821 \tabularnewline
Winsorized Mean ( 22 / 24 ) & 101.783611111111 & 0.0639640895791901 & 1591.2617811139 \tabularnewline
Winsorized Mean ( 23 / 24 ) & 101.780416666667 & 0.062661508846527 & 1624.28927327542 \tabularnewline
Winsorized Mean ( 24 / 24 ) & 101.77375 & 0.0608477015316944 & 1672.59810047201 \tabularnewline
Trimmed Mean ( 1 / 24 ) & 101.704857142857 & 0.121202864156747 & 839.129156315366 \tabularnewline
Trimmed Mean ( 2 / 24 ) & 101.713382352941 & 0.11516785671025 & 883.175091196162 \tabularnewline
Trimmed Mean ( 3 / 24 ) & 101.721666666667 & 0.10969582511734 & 927.306636855654 \tabularnewline
Trimmed Mean ( 4 / 24 ) & 101.73265625 & 0.105511848190177 & 964.182297959891 \tabularnewline
Trimmed Mean ( 5 / 24 ) & 101.74564516129 & 0.100982382703547 & 1007.55837243398 \tabularnewline
Trimmed Mean ( 6 / 24 ) & 101.759333333333 & 0.0958750560122309 & 1061.3744342465 \tabularnewline
Trimmed Mean ( 7 / 24 ) & 101.771724137931 & 0.0906263537332722 & 1122.98156050128 \tabularnewline
Trimmed Mean ( 8 / 24 ) & 101.78 & 0.086747132143172 & 1173.29527196377 \tabularnewline
Trimmed Mean ( 9 / 24 ) & 101.786111111111 & 0.0844397894005478 & 1205.42829196647 \tabularnewline
Trimmed Mean ( 10 / 24 ) & 101.786730769231 & 0.0836627220894062 & 1216.63183108549 \tabularnewline
Trimmed Mean ( 11 / 24 ) & 101.786 & 0.0830229867357868 & 1225.99781099089 \tabularnewline
Trimmed Mean ( 12 / 24 ) & 101.785208333333 & 0.0824067222431696 & 1235.15661784218 \tabularnewline
Trimmed Mean ( 13 / 24 ) & 101.784347826087 & 0.0817174655223263 & 1245.56417866727 \tabularnewline
Trimmed Mean ( 14 / 24 ) & 101.78 & 0.0815643820204404 & 1247.8486010535 \tabularnewline
Trimmed Mean ( 15 / 24 ) & 101.77619047619 & 0.0814302694228353 & 1249.85697821662 \tabularnewline
Trimmed Mean ( 16 / 24 ) & 101.772 & 0.0811718657840992 & 1253.78416544832 \tabularnewline
Trimmed Mean ( 17 / 24 ) & 101.766842105263 & 0.0807293436255559 & 1260.59295833352 \tabularnewline
Trimmed Mean ( 18 / 24 ) & 101.761666666667 & 0.0800748657631353 & 1270.83156115031 \tabularnewline
Trimmed Mean ( 19 / 24 ) & 101.757058823529 & 0.0796265004523596 & 1277.9295617093 \tabularnewline
Trimmed Mean ( 20 / 24 ) & 101.7521875 & 0.0789915450444417 & 1288.1402363095 \tabularnewline
Trimmed Mean ( 21 / 24 ) & 101.747333333333 & 0.078200939720569 & 1301.1011593582 \tabularnewline
Trimmed Mean ( 22 / 24 ) & 101.742142857143 & 0.0768430633629298 & 1324.02507662422 \tabularnewline
Trimmed Mean ( 23 / 24 ) & 101.736923076923 & 0.0755488007964067 & 1346.6384906769 \tabularnewline
Trimmed Mean ( 24 / 24 ) & 101.73125 & 0.0736209261071167 & 1381.82518720266 \tabularnewline
Median & 101.71 &  &  \tabularnewline
Midrange & 101.41 &  &  \tabularnewline
Midmean - Weighted Average at Xnp & 101.728421052632 &  &  \tabularnewline
Midmean - Weighted Average at X(n+1)p & 101.761666666667 &  &  \tabularnewline
Midmean - Empirical Distribution Function & 101.728421052632 &  &  \tabularnewline
Midmean - Empirical Distribution Function - Averaging & 101.761666666667 &  &  \tabularnewline
Midmean - Empirical Distribution Function - Interpolation & 101.761666666667 &  &  \tabularnewline
Midmean - Closest Observation & 101.728421052632 &  &  \tabularnewline
Midmean - True Basic - Statistics Graphics Toolkit & 101.761666666667 &  &  \tabularnewline
Midmean - MS Excel (old versions) & 101.750512820513 &  &  \tabularnewline
Number of observations & 72 &  &  \tabularnewline
\hline
\end{tabular}
%Source: https://freestatistics.org/blog/index.php?pk=&T=1

[TABLE]
[ROW][C]Central Tendency - Ungrouped Data[/C][/ROW]
[ROW][C]Measure[/C][C]Value[/C][C]S.E.[/C][C]Value/S.E.[/C][/ROW]
[ROW][C]Arithmetic Mean[/C][C]101.696666666667[/C][C]0.126564698270096[/C][C]803.515261812111[/C][/ROW]
[ROW][C]Geometric Mean[/C][C]101.691054487328[/C][C][/C][C][/C][/ROW]
[ROW][C]Harmonic Mean[/C][C]101.685421728713[/C][C][/C][C][/C][/ROW]
[ROW][C]Quadratic Mean[/C][C]101.702258250903[/C][C][/C][C][/C][/ROW]
[ROW][C]Winsorized Mean ( 1 / 24 )[/C][C]101.696805555556[/C][C]0.126240298344122[/C][C]805.581156647282[/C][/ROW]
[ROW][C]Winsorized Mean ( 2 / 24 )[/C][C]101.698194444444[/C][C]0.123537663247153[/C][C]823.216108928534[/C][/ROW]
[ROW][C]Winsorized Mean ( 3 / 24 )[/C][C]101.692361111111[/C][C]0.118465754950831[/C][C]858.411455304687[/C][/ROW]
[ROW][C]Winsorized Mean ( 4 / 24 )[/C][C]101.687916666667[/C][C]0.117004363290227[/C][C]869.09508164607[/C][/ROW]
[ROW][C]Winsorized Mean ( 5 / 24 )[/C][C]101.688611111111[/C][C]0.115682520046334[/C][C]879.031776541364[/C][/ROW]
[ROW][C]Winsorized Mean ( 6 / 24 )[/C][C]101.699444444444[/C][C]0.112371451315582[/C][C]905.029197841657[/C][/ROW]
[ROW][C]Winsorized Mean ( 7 / 24 )[/C][C]101.726666666667[/C][C]0.10354400756368[/C][C]982.44861349513[/C][/ROW]
[ROW][C]Winsorized Mean ( 8 / 24 )[/C][C]101.743333333333[/C][C]0.0940644569735439[/C][C]1081.63419645264[/C][/ROW]
[ROW][C]Winsorized Mean ( 9 / 24 )[/C][C]101.782083333333[/C][C]0.0850740581132097[/C][C]1196.39389010796[/C][/ROW]
[ROW][C]Winsorized Mean ( 10 / 24 )[/C][C]101.791805555556[/C][C]0.083112224597225[/C][C]1224.75130522441[/C][/ROW]
[ROW][C]Winsorized Mean ( 11 / 24 )[/C][C]101.791805555556[/C][C]0.0817021879223707[/C][C]1245.88836779099[/C][/ROW]
[ROW][C]Winsorized Mean ( 12 / 24 )[/C][C]101.791805555556[/C][C]0.08069032322699[/C][C]1261.51193209631[/C][/ROW]
[ROW][C]Winsorized Mean ( 13 / 24 )[/C][C]101.818888888889[/C][C]0.0763420755689387[/C][C]1333.71915984841[/C][/ROW]
[ROW][C]Winsorized Mean ( 14 / 24 )[/C][C]101.811111111111[/C][C]0.0751489276601115[/C][C]1354.79126956527[/C][/ROW]
[ROW][C]Winsorized Mean ( 15 / 24 )[/C][C]101.811111111111[/C][C]0.0745570003754875[/C][C]1365.54730740729[/C][/ROW]
[ROW][C]Winsorized Mean ( 16 / 24 )[/C][C]101.815555555556[/C][C]0.073972589583828[/C][C]1376.3957180406[/C][/ROW]
[ROW][C]Winsorized Mean ( 17 / 24 )[/C][C]101.810833333333[/C][C]0.0732617421568025[/C][C]1389.68621733602[/C][/ROW]
[ROW][C]Winsorized Mean ( 18 / 24 )[/C][C]101.800833333333[/C][C]0.0703906353806794[/C][C]1446.22694173429[/C][/ROW]
[ROW][C]Winsorized Mean ( 19 / 24 )[/C][C]101.798194444444[/C][C]0.0692807126938301[/C][C]1469.35836088058[/C][/ROW]
[ROW][C]Winsorized Mean ( 20 / 24 )[/C][C]101.792638888889[/C][C]0.0677219856024758[/C][C]1503.09589985158[/C][/ROW]
[ROW][C]Winsorized Mean ( 21 / 24 )[/C][C]101.789722222222[/C][C]0.0673059060203482[/C][C]1512.34458074821[/C][/ROW]
[ROW][C]Winsorized Mean ( 22 / 24 )[/C][C]101.783611111111[/C][C]0.0639640895791901[/C][C]1591.2617811139[/C][/ROW]
[ROW][C]Winsorized Mean ( 23 / 24 )[/C][C]101.780416666667[/C][C]0.062661508846527[/C][C]1624.28927327542[/C][/ROW]
[ROW][C]Winsorized Mean ( 24 / 24 )[/C][C]101.77375[/C][C]0.0608477015316944[/C][C]1672.59810047201[/C][/ROW]
[ROW][C]Trimmed Mean ( 1 / 24 )[/C][C]101.704857142857[/C][C]0.121202864156747[/C][C]839.129156315366[/C][/ROW]
[ROW][C]Trimmed Mean ( 2 / 24 )[/C][C]101.713382352941[/C][C]0.11516785671025[/C][C]883.175091196162[/C][/ROW]
[ROW][C]Trimmed Mean ( 3 / 24 )[/C][C]101.721666666667[/C][C]0.10969582511734[/C][C]927.306636855654[/C][/ROW]
[ROW][C]Trimmed Mean ( 4 / 24 )[/C][C]101.73265625[/C][C]0.105511848190177[/C][C]964.182297959891[/C][/ROW]
[ROW][C]Trimmed Mean ( 5 / 24 )[/C][C]101.74564516129[/C][C]0.100982382703547[/C][C]1007.55837243398[/C][/ROW]
[ROW][C]Trimmed Mean ( 6 / 24 )[/C][C]101.759333333333[/C][C]0.0958750560122309[/C][C]1061.3744342465[/C][/ROW]
[ROW][C]Trimmed Mean ( 7 / 24 )[/C][C]101.771724137931[/C][C]0.0906263537332722[/C][C]1122.98156050128[/C][/ROW]
[ROW][C]Trimmed Mean ( 8 / 24 )[/C][C]101.78[/C][C]0.086747132143172[/C][C]1173.29527196377[/C][/ROW]
[ROW][C]Trimmed Mean ( 9 / 24 )[/C][C]101.786111111111[/C][C]0.0844397894005478[/C][C]1205.42829196647[/C][/ROW]
[ROW][C]Trimmed Mean ( 10 / 24 )[/C][C]101.786730769231[/C][C]0.0836627220894062[/C][C]1216.63183108549[/C][/ROW]
[ROW][C]Trimmed Mean ( 11 / 24 )[/C][C]101.786[/C][C]0.0830229867357868[/C][C]1225.99781099089[/C][/ROW]
[ROW][C]Trimmed Mean ( 12 / 24 )[/C][C]101.785208333333[/C][C]0.0824067222431696[/C][C]1235.15661784218[/C][/ROW]
[ROW][C]Trimmed Mean ( 13 / 24 )[/C][C]101.784347826087[/C][C]0.0817174655223263[/C][C]1245.56417866727[/C][/ROW]
[ROW][C]Trimmed Mean ( 14 / 24 )[/C][C]101.78[/C][C]0.0815643820204404[/C][C]1247.8486010535[/C][/ROW]
[ROW][C]Trimmed Mean ( 15 / 24 )[/C][C]101.77619047619[/C][C]0.0814302694228353[/C][C]1249.85697821662[/C][/ROW]
[ROW][C]Trimmed Mean ( 16 / 24 )[/C][C]101.772[/C][C]0.0811718657840992[/C][C]1253.78416544832[/C][/ROW]
[ROW][C]Trimmed Mean ( 17 / 24 )[/C][C]101.766842105263[/C][C]0.0807293436255559[/C][C]1260.59295833352[/C][/ROW]
[ROW][C]Trimmed Mean ( 18 / 24 )[/C][C]101.761666666667[/C][C]0.0800748657631353[/C][C]1270.83156115031[/C][/ROW]
[ROW][C]Trimmed Mean ( 19 / 24 )[/C][C]101.757058823529[/C][C]0.0796265004523596[/C][C]1277.9295617093[/C][/ROW]
[ROW][C]Trimmed Mean ( 20 / 24 )[/C][C]101.7521875[/C][C]0.0789915450444417[/C][C]1288.1402363095[/C][/ROW]
[ROW][C]Trimmed Mean ( 21 / 24 )[/C][C]101.747333333333[/C][C]0.078200939720569[/C][C]1301.1011593582[/C][/ROW]
[ROW][C]Trimmed Mean ( 22 / 24 )[/C][C]101.742142857143[/C][C]0.0768430633629298[/C][C]1324.02507662422[/C][/ROW]
[ROW][C]Trimmed Mean ( 23 / 24 )[/C][C]101.736923076923[/C][C]0.0755488007964067[/C][C]1346.6384906769[/C][/ROW]
[ROW][C]Trimmed Mean ( 24 / 24 )[/C][C]101.73125[/C][C]0.0736209261071167[/C][C]1381.82518720266[/C][/ROW]
[ROW][C]Median[/C][C]101.71[/C][C][/C][C][/C][/ROW]
[ROW][C]Midrange[/C][C]101.41[/C][C][/C][C][/C][/ROW]
[ROW][C]Midmean - Weighted Average at Xnp[/C][C]101.728421052632[/C][C][/C][C][/C][/ROW]
[ROW][C]Midmean - Weighted Average at X(n+1)p[/C][C]101.761666666667[/C][C][/C][C][/C][/ROW]
[ROW][C]Midmean - Empirical Distribution Function[/C][C]101.728421052632[/C][C][/C][C][/C][/ROW]
[ROW][C]Midmean - Empirical Distribution Function - Averaging[/C][C]101.761666666667[/C][C][/C][C][/C][/ROW]
[ROW][C]Midmean - Empirical Distribution Function - Interpolation[/C][C]101.761666666667[/C][C][/C][C][/C][/ROW]
[ROW][C]Midmean - Closest Observation[/C][C]101.728421052632[/C][C][/C][C][/C][/ROW]
[ROW][C]Midmean - True Basic - Statistics Graphics Toolkit[/C][C]101.761666666667[/C][C][/C][C][/C][/ROW]
[ROW][C]Midmean - MS Excel (old versions)[/C][C]101.750512820513[/C][C][/C][C][/C][/ROW]
[ROW][C]Number of observations[/C][C]72[/C][C][/C][C][/C][/ROW]
[/TABLE]
Source: https://freestatistics.org/blog/index.php?pk=&T=1

Globally Unique Identifier (entire table): ba.freestatistics.org/blog/index.php?pk=&T=1

As an alternative you can also use a QR Code:  

The GUIDs for individual cells are displayed in the table below:

Central Tendency - Ungrouped Data
MeasureValueS.E.Value/S.E.
Arithmetic Mean101.6966666666670.126564698270096803.515261812111
Geometric Mean101.691054487328
Harmonic Mean101.685421728713
Quadratic Mean101.702258250903
Winsorized Mean ( 1 / 24 )101.6968055555560.126240298344122805.581156647282
Winsorized Mean ( 2 / 24 )101.6981944444440.123537663247153823.216108928534
Winsorized Mean ( 3 / 24 )101.6923611111110.118465754950831858.411455304687
Winsorized Mean ( 4 / 24 )101.6879166666670.117004363290227869.09508164607
Winsorized Mean ( 5 / 24 )101.6886111111110.115682520046334879.031776541364
Winsorized Mean ( 6 / 24 )101.6994444444440.112371451315582905.029197841657
Winsorized Mean ( 7 / 24 )101.7266666666670.10354400756368982.44861349513
Winsorized Mean ( 8 / 24 )101.7433333333330.09406445697354391081.63419645264
Winsorized Mean ( 9 / 24 )101.7820833333330.08507405811320971196.39389010796
Winsorized Mean ( 10 / 24 )101.7918055555560.0831122245972251224.75130522441
Winsorized Mean ( 11 / 24 )101.7918055555560.08170218792237071245.88836779099
Winsorized Mean ( 12 / 24 )101.7918055555560.080690323226991261.51193209631
Winsorized Mean ( 13 / 24 )101.8188888888890.07634207556893871333.71915984841
Winsorized Mean ( 14 / 24 )101.8111111111110.07514892766011151354.79126956527
Winsorized Mean ( 15 / 24 )101.8111111111110.07455700037548751365.54730740729
Winsorized Mean ( 16 / 24 )101.8155555555560.0739725895838281376.3957180406
Winsorized Mean ( 17 / 24 )101.8108333333330.07326174215680251389.68621733602
Winsorized Mean ( 18 / 24 )101.8008333333330.07039063538067941446.22694173429
Winsorized Mean ( 19 / 24 )101.7981944444440.06928071269383011469.35836088058
Winsorized Mean ( 20 / 24 )101.7926388888890.06772198560247581503.09589985158
Winsorized Mean ( 21 / 24 )101.7897222222220.06730590602034821512.34458074821
Winsorized Mean ( 22 / 24 )101.7836111111110.06396408957919011591.2617811139
Winsorized Mean ( 23 / 24 )101.7804166666670.0626615088465271624.28927327542
Winsorized Mean ( 24 / 24 )101.773750.06084770153169441672.59810047201
Trimmed Mean ( 1 / 24 )101.7048571428570.121202864156747839.129156315366
Trimmed Mean ( 2 / 24 )101.7133823529410.11516785671025883.175091196162
Trimmed Mean ( 3 / 24 )101.7216666666670.10969582511734927.306636855654
Trimmed Mean ( 4 / 24 )101.732656250.105511848190177964.182297959891
Trimmed Mean ( 5 / 24 )101.745645161290.1009823827035471007.55837243398
Trimmed Mean ( 6 / 24 )101.7593333333330.09587505601223091061.3744342465
Trimmed Mean ( 7 / 24 )101.7717241379310.09062635373327221122.98156050128
Trimmed Mean ( 8 / 24 )101.780.0867471321431721173.29527196377
Trimmed Mean ( 9 / 24 )101.7861111111110.08443978940054781205.42829196647
Trimmed Mean ( 10 / 24 )101.7867307692310.08366272208940621216.63183108549
Trimmed Mean ( 11 / 24 )101.7860.08302298673578681225.99781099089
Trimmed Mean ( 12 / 24 )101.7852083333330.08240672224316961235.15661784218
Trimmed Mean ( 13 / 24 )101.7843478260870.08171746552232631245.56417866727
Trimmed Mean ( 14 / 24 )101.780.08156438202044041247.8486010535
Trimmed Mean ( 15 / 24 )101.776190476190.08143026942283531249.85697821662
Trimmed Mean ( 16 / 24 )101.7720.08117186578409921253.78416544832
Trimmed Mean ( 17 / 24 )101.7668421052630.08072934362555591260.59295833352
Trimmed Mean ( 18 / 24 )101.7616666666670.08007486576313531270.83156115031
Trimmed Mean ( 19 / 24 )101.7570588235290.07962650045235961277.9295617093
Trimmed Mean ( 20 / 24 )101.75218750.07899154504444171288.1402363095
Trimmed Mean ( 21 / 24 )101.7473333333330.0782009397205691301.1011593582
Trimmed Mean ( 22 / 24 )101.7421428571430.07684306336292981324.02507662422
Trimmed Mean ( 23 / 24 )101.7369230769230.07554880079640671346.6384906769
Trimmed Mean ( 24 / 24 )101.731250.07362092610711671381.82518720266
Median101.71
Midrange101.41
Midmean - Weighted Average at Xnp101.728421052632
Midmean - Weighted Average at X(n+1)p101.761666666667
Midmean - Empirical Distribution Function101.728421052632
Midmean - Empirical Distribution Function - Averaging101.761666666667
Midmean - Empirical Distribution Function - Interpolation101.761666666667
Midmean - Closest Observation101.728421052632
Midmean - True Basic - Statistics Graphics Toolkit101.761666666667
Midmean - MS Excel (old versions)101.750512820513
Number of observations72


Parameters (Session):
Parameters (R input):
R code (references can be found in the software module):
geomean <- function(x) {
return(exp(mean(log(x))))
}
harmean <- function(x) {
return(1/mean(1/x))
}
quamean <- function(x) {
return(sqrt(mean(x*x)))
}
winmean <- function(x) {
x <-sort(x[!is.na(x)])
n<-length(x)
denom <- 3
nodenom <- n/denom
if (nodenom>40) denom <- n/40
sqrtn = sqrt(n)
roundnodenom = floor(nodenom)
win <- array(NA,dim=c(roundnodenom,2))
for (j in 1:roundnodenom) {
win[j,1] <- (j*x[j+1]+sum(x[(j+1):(n-j)])+j*x[n-j])/n
win[j,2] <- sd(c(rep(x[j+1],j),x[(j+1):(n-j)],rep(x[n-j],j)))/sqrtn
}
return(win)
}
trimean <- function(x) {
x <-sort(x[!is.na(x)])
n<-length(x)
denom <- 3
nodenom <- n/denom
if (nodenom>40) denom <- n/40
sqrtn = sqrt(n)
roundnodenom = floor(nodenom)
tri <- array(NA,dim=c(roundnodenom,2))
for (j in 1:roundnodenom) {
tri[j,1] <- mean(x,trim=j/n)
tri[j,2] <- sd(x[(j+1):(n-j)]) / sqrt(n-j*2)
}
return(tri)
}
midrange <- function(x) {
return((max(x)+min(x))/2)
}
q1 <- function(data,n,p,i,f) {
np <- n*p;
i <<- floor(np)
f <<- np - i
qvalue <- (1-f)*data[i] + f*data[i+1]
}
q2 <- function(data,n,p,i,f) {
np <- (n+1)*p
i <<- floor(np)
f <<- np - i
qvalue <- (1-f)*data[i] + f*data[i+1]
}
q3 <- function(data,n,p,i,f) {
np <- n*p
i <<- floor(np)
f <<- np - i
if (f==0) {
qvalue <- data[i]
} else {
qvalue <- data[i+1]
}
}
q4 <- function(data,n,p,i,f) {
np <- n*p
i <<- floor(np)
f <<- np - i
if (f==0) {
qvalue <- (data[i]+data[i+1])/2
} else {
qvalue <- data[i+1]
}
}
q5 <- function(data,n,p,i,f) {
np <- (n-1)*p
i <<- floor(np)
f <<- np - i
if (f==0) {
qvalue <- data[i+1]
} else {
qvalue <- data[i+1] + f*(data[i+2]-data[i+1])
}
}
q6 <- function(data,n,p,i,f) {
np <- n*p+0.5
i <<- floor(np)
f <<- np - i
qvalue <- data[i]
}
q7 <- function(data,n,p,i,f) {
np <- (n+1)*p
i <<- floor(np)
f <<- np - i
if (f==0) {
qvalue <- data[i]
} else {
qvalue <- f*data[i] + (1-f)*data[i+1]
}
}
q8 <- function(data,n,p,i,f) {
np <- (n+1)*p
i <<- floor(np)
f <<- np - i
if (f==0) {
qvalue <- data[i]
} else {
if (f == 0.5) {
qvalue <- (data[i]+data[i+1])/2
} else {
if (f < 0.5) {
qvalue <- data[i]
} else {
qvalue <- data[i+1]
}
}
}
}
midmean <- function(x,def) {
x <-sort(x[!is.na(x)])
n<-length(x)
if (def==1) {
qvalue1 <- q1(x,n,0.25,i,f)
qvalue3 <- q1(x,n,0.75,i,f)
}
if (def==2) {
qvalue1 <- q2(x,n,0.25,i,f)
qvalue3 <- q2(x,n,0.75,i,f)
}
if (def==3) {
qvalue1 <- q3(x,n,0.25,i,f)
qvalue3 <- q3(x,n,0.75,i,f)
}
if (def==4) {
qvalue1 <- q4(x,n,0.25,i,f)
qvalue3 <- q4(x,n,0.75,i,f)
}
if (def==5) {
qvalue1 <- q5(x,n,0.25,i,f)
qvalue3 <- q5(x,n,0.75,i,f)
}
if (def==6) {
qvalue1 <- q6(x,n,0.25,i,f)
qvalue3 <- q6(x,n,0.75,i,f)
}
if (def==7) {
qvalue1 <- q7(x,n,0.25,i,f)
qvalue3 <- q7(x,n,0.75,i,f)
}
if (def==8) {
qvalue1 <- q8(x,n,0.25,i,f)
qvalue3 <- q8(x,n,0.75,i,f)
}
midm <- 0
myn <- 0
roundno4 <- round(n/4)
round3no4 <- round(3*n/4)
for (i in 1:n) {
if ((x[i]>=qvalue1) & (x[i]<=qvalue3)){
midm = midm + x[i]
myn = myn + 1
}
}
midm = midm / myn
return(midm)
}
(arm <- mean(x))
sqrtn <- sqrt(length(x))
(armse <- sd(x) / sqrtn)
(armose <- arm / armse)
(geo <- geomean(x))
(har <- harmean(x))
(qua <- quamean(x))
(win <- winmean(x))
(tri <- trimean(x))
(midr <- midrange(x))
midm <- array(NA,dim=8)
for (j in 1:8) midm[j] <- midmean(x,j)
midm
bitmap(file='test1.png')
lb <- win[,1] - 2*win[,2]
ub <- win[,1] + 2*win[,2]
if ((ylimmin == '') | (ylimmax == '')) plot(win[,1],type='b',main=main, xlab='j', pch=19, ylab='Winsorized Mean(j/n)', ylim=c(min(lb),max(ub))) else plot(win[,1],type='l',main=main, xlab='j', pch=19, ylab='Winsorized Mean(j/n)', ylim=c(ylimmin,ylimmax))
lines(ub,lty=3)
lines(lb,lty=3)
grid()
dev.off()
bitmap(file='test2.png')
lb <- tri[,1] - 2*tri[,2]
ub <- tri[,1] + 2*tri[,2]
if ((ylimmin == '') | (ylimmax == '')) plot(tri[,1],type='b',main=main, xlab='j', pch=19, ylab='Trimmed Mean(j/n)', ylim=c(min(lb),max(ub))) else plot(tri[,1],type='l',main=main, xlab='j', pch=19, ylab='Trimmed Mean(j/n)', ylim=c(ylimmin,ylimmax))
lines(ub,lty=3)
lines(lb,lty=3)
grid()
dev.off()
load(file='createtable')
a<-table.start()
a<-table.row.start(a)
a<-table.element(a,'Central Tendency - Ungrouped Data',4,TRUE)
a<-table.row.end(a)
a<-table.row.start(a)
a<-table.element(a,'Measure',header=TRUE)
a<-table.element(a,'Value',header=TRUE)
a<-table.element(a,'S.E.',header=TRUE)
a<-table.element(a,'Value/S.E.',header=TRUE)
a<-table.row.end(a)
a<-table.row.start(a)
a<-table.element(a,hyperlink('arithmetic_mean.htm', 'Arithmetic Mean', 'click to view the definition of the Arithmetic Mean'),header=TRUE)
a<-table.element(a,arm)
a<-table.element(a,hyperlink('arithmetic_mean_standard_error.htm', armse, 'click to view the definition of the Standard Error of the Arithmetic Mean'))
a<-table.element(a,armose)
a<-table.row.end(a)
a<-table.row.start(a)
a<-table.element(a,hyperlink('geometric_mean.htm', 'Geometric Mean', 'click to view the definition of the Geometric Mean'),header=TRUE)
a<-table.element(a,geo)
a<-table.element(a,'')
a<-table.row.end(a)
a<-table.row.start(a)
a<-table.element(a,hyperlink('harmonic_mean.htm', 'Harmonic Mean', 'click to view the definition of the Harmonic Mean'),header=TRUE)
a<-table.element(a,har)
a<-table.element(a,'')
a<-table.row.end(a)
a<-table.row.start(a)
a<-table.element(a,hyperlink('quadratic_mean.htm', 'Quadratic Mean', 'click to view the definition of the Quadratic Mean'),header=TRUE)
a<-table.element(a,qua)
a<-table.element(a,'')
a<-table.row.end(a)
for (j in 1:length(win[,1])) {
a<-table.row.start(a)
mylabel <- paste('Winsorized Mean (',j)
mylabel <- paste(mylabel,'/')
mylabel <- paste(mylabel,length(win[,1]))
mylabel <- paste(mylabel,')')
a<-table.element(a,hyperlink('winsorized_mean.htm', mylabel, 'click to view the definition of the Winsorized Mean'),header=TRUE)
a<-table.element(a,win[j,1])
a<-table.element(a,win[j,2])
a<-table.element(a,win[j,1]/win[j,2])
a<-table.row.end(a)
}
for (j in 1:length(tri[,1])) {
a<-table.row.start(a)
mylabel <- paste('Trimmed Mean (',j)
mylabel <- paste(mylabel,'/')
mylabel <- paste(mylabel,length(tri[,1]))
mylabel <- paste(mylabel,')')
a<-table.element(a,hyperlink('arithmetic_mean.htm', mylabel, 'click to view the definition of the Trimmed Mean'),header=TRUE)
a<-table.element(a,tri[j,1])
a<-table.element(a,tri[j,2])
a<-table.element(a,tri[j,1]/tri[j,2])
a<-table.row.end(a)
}
a<-table.row.start(a)
a<-table.element(a,hyperlink('median_1.htm', 'Median', 'click to view the definition of the Median'),header=TRUE)
a<-table.element(a,median(x))
a<-table.element(a,'')
a<-table.row.end(a)
a<-table.row.start(a)
a<-table.element(a,hyperlink('midrange.htm', 'Midrange', 'click to view the definition of the Midrange'),header=TRUE)
a<-table.element(a,midr)
a<-table.element(a,'')
a<-table.row.end(a)
a<-table.row.start(a)
mymid <- hyperlink('midmean.htm', 'Midmean', 'click to view the definition of the Midmean')
mylabel <- paste(mymid,hyperlink('method_1.htm','Weighted Average at Xnp',''),sep=' - ')
a<-table.element(a,mylabel,header=TRUE)
a<-table.element(a,midm[1])
a<-table.element(a,'')
a<-table.row.end(a)
a<-table.row.start(a)
mymid <- hyperlink('midmean.htm', 'Midmean', 'click to view the definition of the Midmean')
mylabel <- paste(mymid,hyperlink('method_2.htm','Weighted Average at X(n+1)p',''),sep=' - ')
a<-table.element(a,mylabel,header=TRUE)
a<-table.element(a,midm[2])
a<-table.element(a,'')
a<-table.row.end(a)
a<-table.row.start(a)
mymid <- hyperlink('midmean.htm', 'Midmean', 'click to view the definition of the Midmean')
mylabel <- paste(mymid,hyperlink('method_3.htm','Empirical Distribution Function',''),sep=' - ')
a<-table.element(a,mylabel,header=TRUE)
a<-table.element(a,midm[3])
a<-table.element(a,'')
a<-table.row.end(a)
a<-table.row.start(a)
mymid <- hyperlink('midmean.htm', 'Midmean', 'click to view the definition of the Midmean')
mylabel <- paste(mymid,hyperlink('method_4.htm','Empirical Distribution Function - Averaging',''),sep=' - ')
a<-table.element(a,mylabel,header=TRUE)
a<-table.element(a,midm[4])
a<-table.element(a,'')
a<-table.row.end(a)
a<-table.row.start(a)
mymid <- hyperlink('midmean.htm', 'Midmean', 'click to view the definition of the Midmean')
mylabel <- paste(mymid,hyperlink('method_5.htm','Empirical Distribution Function - Interpolation',''),sep=' - ')
a<-table.element(a,mylabel,header=TRUE)
a<-table.element(a,midm[5])
a<-table.element(a,'')
a<-table.row.end(a)
a<-table.row.start(a)
mymid <- hyperlink('midmean.htm', 'Midmean', 'click to view the definition of the Midmean')
mylabel <- paste(mymid,hyperlink('method_6.htm','Closest Observation',''),sep=' - ')
a<-table.element(a,mylabel,header=TRUE)
a<-table.element(a,midm[6])
a<-table.element(a,'')
a<-table.row.end(a)
a<-table.row.start(a)
mymid <- hyperlink('midmean.htm', 'Midmean', 'click to view the definition of the Midmean')
mylabel <- paste(mymid,hyperlink('method_7.htm','True Basic - Statistics Graphics Toolkit',''),sep=' - ')
a<-table.element(a,mylabel,header=TRUE)
a<-table.element(a,midm[7])
a<-table.element(a,'')
a<-table.row.end(a)
a<-table.row.start(a)
mymid <- hyperlink('midmean.htm', 'Midmean', 'click to view the definition of the Midmean')
mylabel <- paste(mymid,hyperlink('method_8.htm','MS Excel (old versions)',''),sep=' - ')
a<-table.element(a,mylabel,header=TRUE)
a<-table.element(a,midm[8])
a<-table.element(a,'')
a<-table.row.end(a)
a<-table.row.start(a)
a<-table.element(a,'Number of observations',header=TRUE)
a<-table.element(a,length(x))
a<-table.element(a,'')
a<-table.row.end(a)
a<-table.end(a)
table.save(a,file='mytable.tab')