Free Statistics

of Irreproducible Research!

Author's title

Author*Unverified author*
R Software Modulerwasp_centraltendency.wasp
Title produced by softwareCentral Tendency
Date of computationTue, 14 Mar 2017 17:51:00 +0000
Cite this page as followsStatistical Computations at FreeStatistics.org, Office for Research Development and Education, URL https://freestatistics.org/blog/index.php?v=date/2017/Mar/14/t14895139102hl36mhhrj5gehw.htm/, Retrieved Tue, 14 May 2024 19:50:49 +0200
Statistical Computations at FreeStatistics.org, Office for Research Development and Education, URL https://freestatistics.org/blog/index.php?pk=, Retrieved Tue, 14 May 2024 19:50:49 +0200
QR Codes:

Original text written by user:
IsPrivate?No (this computation is public)
User-defined keywords
Estimated Impact0
Dataseries X:
45570
45118
41921
40167
37315
39206
57075
58664
51705
45527
41057
40867
41484
39738
37254
35177
32846
34079
51287
52800
48443
42223
38796
38952
42343
42023
39340
37149
35431
36537
49626
58677
56009
50069
46470
45603
46729
46989
44666
42920
40125
40941
57748
61246
59809
52682
48394
47436
49750
48172
44960
41831
38672
39704
56207
59254
57374
51309
47083
45092
46353
45348
42867
39980
36790
37504
53331
55997
54764
48590
45565
44959


Summary of computational transaction
Raw Inputview raw input (R code)
Raw Outputview raw output of R engine
Computing time1 seconds
R Server'Herman Ole Andreas Wold' @ wold.wessa.net

\begin{tabular}{lllllllll}
\hline
Summary of computational transaction \tabularnewline
Raw Input & view raw input (R code)  \tabularnewline
Raw Output & view raw output of R engine  \tabularnewline
Computing time & 1 seconds \tabularnewline
R Server & 'Herman Ole Andreas Wold' @ wold.wessa.net \tabularnewline
\hline
\end{tabular}
%Source: https://freestatistics.org/blog/index.php?pk=&T=0

[TABLE]
[ROW][C]Summary of computational transaction[/C][/ROW]
[ROW][C]Raw Input[/C][C]view raw input (R code) [/C][/ROW]
[ROW][C]Raw Output[/C][C]view raw output of R engine [/C][/ROW]
[ROW][C]Computing time[/C][C]1 seconds[/C][/ROW]
[ROW][C]R Server[/C][C]'Herman Ole Andreas Wold' @ wold.wessa.net[/C][/ROW]
[/TABLE]
Source: https://freestatistics.org/blog/index.php?pk=&T=0

Globally Unique Identifier (entire table): ba.freestatistics.org/blog/index.php?pk=&T=0

As an alternative you can also use a QR Code:  

The GUIDs for individual cells are displayed in the table below:

Summary of computational transaction
Raw Inputview raw input (R code)
Raw Outputview raw output of R engine
Computing time1 seconds
R Server'Herman Ole Andreas Wold' @ wold.wessa.net


Central Tendency - Ungrouped Data
MeasureValueS.E.Value/S.E.
Arithmetic Mean45801.2361111111844.29089837858654.2481699128462
Geometric Mean45260.5254611696
Harmonic Mean44733.5906308401
Quadratic Mean46350.4471920474
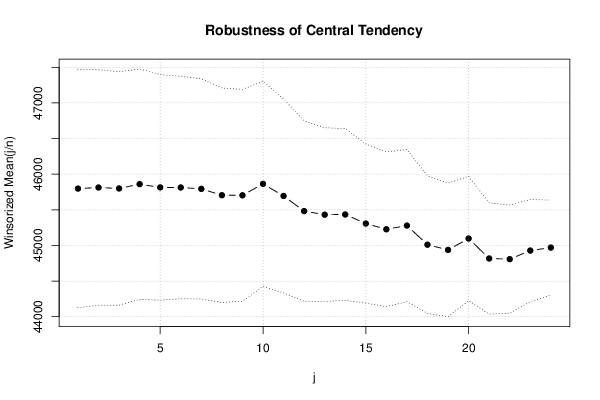
Winsorized Mean ( 1 / 24 )45798.4027777778835.82035682373554.7945529250087
Winsorized Mean ( 2 / 24 )45813.4861111111826.45717022882455.4335878027734
Winsorized Mean ( 3 / 24 )45800.0277777778819.13909346900755.9123940524158
Winsorized Mean ( 4 / 24 )45860.75808.50801600990356.7226905508359
Winsorized Mean ( 5 / 24 )45814.7083333333791.82227811815157.8598374905753
Winsorized Mean ( 6 / 24 )45813.4583333333780.52287957929458.6958557294657
Winsorized Mean ( 7 / 24 )45794.5972222222772.91040464408959.249554601752
Winsorized Mean ( 8 / 24 )45704.9305555556752.45303310512660.7412403760888
Winsorized Mean ( 9 / 24 )45703.8055555556743.91676577226161.4367193460284
Winsorized Mean ( 10 / 24 )45864.3611111111719.55824109387963.7396092377285
Winsorized Mean ( 11 / 24 )45694.9305555556680.48424064844367.1506080905154
Winsorized Mean ( 12 / 24 )45482.0972222222633.42845905322771.8030530080752
Winsorized Mean ( 13 / 24 )45432.0833333333610.28184814435774.4444283759638
Winsorized Mean ( 14 / 24 )45435.1944444444602.66024000442875.3910602167991
Winsorized Mean ( 15 / 24 )45307.4861111111558.2015568663881.166893129889
Winsorized Mean ( 16 / 24 )45227.0416666667543.08474267820483.2780560978955
Winsorized Mean ( 17 / 24 )45278.9861111111534.20464862183484.7596257874655
Winsorized Mean ( 18 / 24 )45010.7361111111482.40476408671493.3049162487546
Winsorized Mean ( 19 / 24 )44937.6388888889468.51247651650295.9155649877471
Winsorized Mean ( 20 / 24 )45097.6388888889436.258021304375103.373775808295
Winsorized Mean ( 21 / 24 )44817.0555555556390.547611652515114.754396694227
Winsorized Mean ( 22 / 24 )44807.5833333333379.517246350911118.064682867938
Winsorized Mean ( 23 / 24 )44928.3333333333358.671430736987125.26320605189
Winsorized Mean ( 24 / 24 )44970333.122853148076134.9952414703
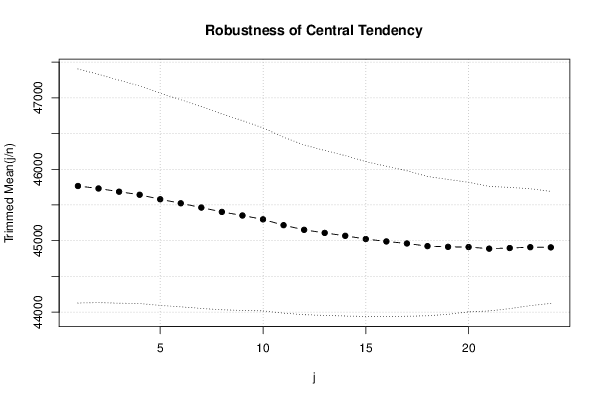
Trimmed Mean ( 1 / 24 )45765.6714285714818.71292585198255.899534480839
Trimmed Mean ( 2 / 24 )45731.0147058823798.3232247927457.2838335221363
Trimmed Mean ( 3 / 24 )45686.0303030303779.88073231054358.5807911520994
Trimmed Mean ( 4 / 24 )45643.28125761.028370228159.975794642609
Trimmed Mean ( 5 / 24 )45580.1451612903742.04388471029561.4251341469992
Trimmed Mean ( 6 / 24 )45523.85724.26972097050262.854829743537
Trimmed Mean ( 7 / 24 )45463.9310344828705.64945688097364.428492916918
Trimmed Mean ( 8 / 24 )45403.1964285714684.65722887567366.31522244077
Trimmed Mean ( 9 / 24 )45352.9074074074663.90658903021568.312181497785
Trimmed Mean ( 10 / 24 )45298.9230769231639.97671104765570.7821429982472
Trimmed Mean ( 11 / 24 )45217.5615.2761784063273.4913874239724
Trimmed Mean ( 12 / 24 )45152.3958333333593.59350325754176.0661893796759
Trimmed Mean ( 13 / 24 )45109.3913043478577.13660124855678.1606836349658
Trimmed Mean ( 14 / 24 )45068.7727272727560.98547280791480.3385736562641
Trimmed Mean ( 15 / 24 )45023.9047619048541.30047066900483.1772872952777
Trimmed Mean ( 16 / 24 )44989.875525.97402586193485.5363055737845
Trimmed Mean ( 17 / 24 )44961.7894736842508.83267259734188.3626227148039
Trimmed Mean ( 18 / 24 )44924.4722222222487.25973401323992.1982037222915
Trimmed Mean ( 19 / 24 )44914.3235294118471.70111560281695.2177598138875
Trimmed Mean ( 20 / 24 )44911.5625453.17661038117699.1038846030115
Trimmed Mean ( 21 / 24 )44889.2333333333435.661372462534103.036982782295
Trimmed Mean ( 22 / 24 )44898.0714285714423.890265850719105.919090494952
Trimmed Mean ( 23 / 24 )44909.4615384615408.593449364898109.912338556252
Trimmed Mean ( 24 / 24 )44907391.579516977002114.6816880175
Median45233
Midrange47046
Midmean - Weighted Average at Xnp44790.8378378378
Midmean - Weighted Average at X(n+1)p44924.4722222222
Midmean - Empirical Distribution Function44790.8378378378
Midmean - Empirical Distribution Function - Averaging44924.4722222222
Midmean - Empirical Distribution Function - Interpolation44924.4722222222
Midmean - Closest Observation44790.8378378378
Midmean - True Basic - Statistics Graphics Toolkit44924.4722222222
Midmean - MS Excel (old versions)44961.7894736842
Number of observations72

\begin{tabular}{lllllllll}
\hline
Central Tendency - Ungrouped Data \tabularnewline
Measure & Value & S.E. & Value/S.E. \tabularnewline
Arithmetic Mean & 45801.2361111111 & 844.290898378586 & 54.2481699128462 \tabularnewline
Geometric Mean & 45260.5254611696 &  &  \tabularnewline
Harmonic Mean & 44733.5906308401 &  &  \tabularnewline
Quadratic Mean & 46350.4471920474 &  &  \tabularnewline
Winsorized Mean ( 1 / 24 ) & 45798.4027777778 & 835.820356823735 & 54.7945529250087 \tabularnewline
Winsorized Mean ( 2 / 24 ) & 45813.4861111111 & 826.457170228824 & 55.4335878027734 \tabularnewline
Winsorized Mean ( 3 / 24 ) & 45800.0277777778 & 819.139093469007 & 55.9123940524158 \tabularnewline
Winsorized Mean ( 4 / 24 ) & 45860.75 & 808.508016009903 & 56.7226905508359 \tabularnewline
Winsorized Mean ( 5 / 24 ) & 45814.7083333333 & 791.822278118151 & 57.8598374905753 \tabularnewline
Winsorized Mean ( 6 / 24 ) & 45813.4583333333 & 780.522879579294 & 58.6958557294657 \tabularnewline
Winsorized Mean ( 7 / 24 ) & 45794.5972222222 & 772.910404644089 & 59.249554601752 \tabularnewline
Winsorized Mean ( 8 / 24 ) & 45704.9305555556 & 752.453033105126 & 60.7412403760888 \tabularnewline
Winsorized Mean ( 9 / 24 ) & 45703.8055555556 & 743.916765772261 & 61.4367193460284 \tabularnewline
Winsorized Mean ( 10 / 24 ) & 45864.3611111111 & 719.558241093879 & 63.7396092377285 \tabularnewline
Winsorized Mean ( 11 / 24 ) & 45694.9305555556 & 680.484240648443 & 67.1506080905154 \tabularnewline
Winsorized Mean ( 12 / 24 ) & 45482.0972222222 & 633.428459053227 & 71.8030530080752 \tabularnewline
Winsorized Mean ( 13 / 24 ) & 45432.0833333333 & 610.281848144357 & 74.4444283759638 \tabularnewline
Winsorized Mean ( 14 / 24 ) & 45435.1944444444 & 602.660240004428 & 75.3910602167991 \tabularnewline
Winsorized Mean ( 15 / 24 ) & 45307.4861111111 & 558.20155686638 & 81.166893129889 \tabularnewline
Winsorized Mean ( 16 / 24 ) & 45227.0416666667 & 543.084742678204 & 83.2780560978955 \tabularnewline
Winsorized Mean ( 17 / 24 ) & 45278.9861111111 & 534.204648621834 & 84.7596257874655 \tabularnewline
Winsorized Mean ( 18 / 24 ) & 45010.7361111111 & 482.404764086714 & 93.3049162487546 \tabularnewline
Winsorized Mean ( 19 / 24 ) & 44937.6388888889 & 468.512476516502 & 95.9155649877471 \tabularnewline
Winsorized Mean ( 20 / 24 ) & 45097.6388888889 & 436.258021304375 & 103.373775808295 \tabularnewline
Winsorized Mean ( 21 / 24 ) & 44817.0555555556 & 390.547611652515 & 114.754396694227 \tabularnewline
Winsorized Mean ( 22 / 24 ) & 44807.5833333333 & 379.517246350911 & 118.064682867938 \tabularnewline
Winsorized Mean ( 23 / 24 ) & 44928.3333333333 & 358.671430736987 & 125.26320605189 \tabularnewline
Winsorized Mean ( 24 / 24 ) & 44970 & 333.122853148076 & 134.9952414703 \tabularnewline
Trimmed Mean ( 1 / 24 ) & 45765.6714285714 & 818.712925851982 & 55.899534480839 \tabularnewline
Trimmed Mean ( 2 / 24 ) & 45731.0147058823 & 798.32322479274 & 57.2838335221363 \tabularnewline
Trimmed Mean ( 3 / 24 ) & 45686.0303030303 & 779.880732310543 & 58.5807911520994 \tabularnewline
Trimmed Mean ( 4 / 24 ) & 45643.28125 & 761.0283702281 & 59.975794642609 \tabularnewline
Trimmed Mean ( 5 / 24 ) & 45580.1451612903 & 742.043884710295 & 61.4251341469992 \tabularnewline
Trimmed Mean ( 6 / 24 ) & 45523.85 & 724.269720970502 & 62.854829743537 \tabularnewline
Trimmed Mean ( 7 / 24 ) & 45463.9310344828 & 705.649456880973 & 64.428492916918 \tabularnewline
Trimmed Mean ( 8 / 24 ) & 45403.1964285714 & 684.657228875673 & 66.31522244077 \tabularnewline
Trimmed Mean ( 9 / 24 ) & 45352.9074074074 & 663.906589030215 & 68.312181497785 \tabularnewline
Trimmed Mean ( 10 / 24 ) & 45298.9230769231 & 639.976711047655 & 70.7821429982472 \tabularnewline
Trimmed Mean ( 11 / 24 ) & 45217.5 & 615.27617840632 & 73.4913874239724 \tabularnewline
Trimmed Mean ( 12 / 24 ) & 45152.3958333333 & 593.593503257541 & 76.0661893796759 \tabularnewline
Trimmed Mean ( 13 / 24 ) & 45109.3913043478 & 577.136601248556 & 78.1606836349658 \tabularnewline
Trimmed Mean ( 14 / 24 ) & 45068.7727272727 & 560.985472807914 & 80.3385736562641 \tabularnewline
Trimmed Mean ( 15 / 24 ) & 45023.9047619048 & 541.300470669004 & 83.1772872952777 \tabularnewline
Trimmed Mean ( 16 / 24 ) & 44989.875 & 525.974025861934 & 85.5363055737845 \tabularnewline
Trimmed Mean ( 17 / 24 ) & 44961.7894736842 & 508.832672597341 & 88.3626227148039 \tabularnewline
Trimmed Mean ( 18 / 24 ) & 44924.4722222222 & 487.259734013239 & 92.1982037222915 \tabularnewline
Trimmed Mean ( 19 / 24 ) & 44914.3235294118 & 471.701115602816 & 95.2177598138875 \tabularnewline
Trimmed Mean ( 20 / 24 ) & 44911.5625 & 453.176610381176 & 99.1038846030115 \tabularnewline
Trimmed Mean ( 21 / 24 ) & 44889.2333333333 & 435.661372462534 & 103.036982782295 \tabularnewline
Trimmed Mean ( 22 / 24 ) & 44898.0714285714 & 423.890265850719 & 105.919090494952 \tabularnewline
Trimmed Mean ( 23 / 24 ) & 44909.4615384615 & 408.593449364898 & 109.912338556252 \tabularnewline
Trimmed Mean ( 24 / 24 ) & 44907 & 391.579516977002 & 114.6816880175 \tabularnewline
Median & 45233 &  &  \tabularnewline
Midrange & 47046 &  &  \tabularnewline
Midmean - Weighted Average at Xnp & 44790.8378378378 &  &  \tabularnewline
Midmean - Weighted Average at X(n+1)p & 44924.4722222222 &  &  \tabularnewline
Midmean - Empirical Distribution Function & 44790.8378378378 &  &  \tabularnewline
Midmean - Empirical Distribution Function - Averaging & 44924.4722222222 &  &  \tabularnewline
Midmean - Empirical Distribution Function - Interpolation & 44924.4722222222 &  &  \tabularnewline
Midmean - Closest Observation & 44790.8378378378 &  &  \tabularnewline
Midmean - True Basic - Statistics Graphics Toolkit & 44924.4722222222 &  &  \tabularnewline
Midmean - MS Excel (old versions) & 44961.7894736842 &  &  \tabularnewline
Number of observations & 72 &  &  \tabularnewline
\hline
\end{tabular}
%Source: https://freestatistics.org/blog/index.php?pk=&T=1

[TABLE]
[ROW][C]Central Tendency - Ungrouped Data[/C][/ROW]
[ROW][C]Measure[/C][C]Value[/C][C]S.E.[/C][C]Value/S.E.[/C][/ROW]
[ROW][C]Arithmetic Mean[/C][C]45801.2361111111[/C][C]844.290898378586[/C][C]54.2481699128462[/C][/ROW]
[ROW][C]Geometric Mean[/C][C]45260.5254611696[/C][C][/C][C][/C][/ROW]
[ROW][C]Harmonic Mean[/C][C]44733.5906308401[/C][C][/C][C][/C][/ROW]
[ROW][C]Quadratic Mean[/C][C]46350.4471920474[/C][C][/C][C][/C][/ROW]
[ROW][C]Winsorized Mean ( 1 / 24 )[/C][C]45798.4027777778[/C][C]835.820356823735[/C][C]54.7945529250087[/C][/ROW]
[ROW][C]Winsorized Mean ( 2 / 24 )[/C][C]45813.4861111111[/C][C]826.457170228824[/C][C]55.4335878027734[/C][/ROW]
[ROW][C]Winsorized Mean ( 3 / 24 )[/C][C]45800.0277777778[/C][C]819.139093469007[/C][C]55.9123940524158[/C][/ROW]
[ROW][C]Winsorized Mean ( 4 / 24 )[/C][C]45860.75[/C][C]808.508016009903[/C][C]56.7226905508359[/C][/ROW]
[ROW][C]Winsorized Mean ( 5 / 24 )[/C][C]45814.7083333333[/C][C]791.822278118151[/C][C]57.8598374905753[/C][/ROW]
[ROW][C]Winsorized Mean ( 6 / 24 )[/C][C]45813.4583333333[/C][C]780.522879579294[/C][C]58.6958557294657[/C][/ROW]
[ROW][C]Winsorized Mean ( 7 / 24 )[/C][C]45794.5972222222[/C][C]772.910404644089[/C][C]59.249554601752[/C][/ROW]
[ROW][C]Winsorized Mean ( 8 / 24 )[/C][C]45704.9305555556[/C][C]752.453033105126[/C][C]60.7412403760888[/C][/ROW]
[ROW][C]Winsorized Mean ( 9 / 24 )[/C][C]45703.8055555556[/C][C]743.916765772261[/C][C]61.4367193460284[/C][/ROW]
[ROW][C]Winsorized Mean ( 10 / 24 )[/C][C]45864.3611111111[/C][C]719.558241093879[/C][C]63.7396092377285[/C][/ROW]
[ROW][C]Winsorized Mean ( 11 / 24 )[/C][C]45694.9305555556[/C][C]680.484240648443[/C][C]67.1506080905154[/C][/ROW]
[ROW][C]Winsorized Mean ( 12 / 24 )[/C][C]45482.0972222222[/C][C]633.428459053227[/C][C]71.8030530080752[/C][/ROW]
[ROW][C]Winsorized Mean ( 13 / 24 )[/C][C]45432.0833333333[/C][C]610.281848144357[/C][C]74.4444283759638[/C][/ROW]
[ROW][C]Winsorized Mean ( 14 / 24 )[/C][C]45435.1944444444[/C][C]602.660240004428[/C][C]75.3910602167991[/C][/ROW]
[ROW][C]Winsorized Mean ( 15 / 24 )[/C][C]45307.4861111111[/C][C]558.20155686638[/C][C]81.166893129889[/C][/ROW]
[ROW][C]Winsorized Mean ( 16 / 24 )[/C][C]45227.0416666667[/C][C]543.084742678204[/C][C]83.2780560978955[/C][/ROW]
[ROW][C]Winsorized Mean ( 17 / 24 )[/C][C]45278.9861111111[/C][C]534.204648621834[/C][C]84.7596257874655[/C][/ROW]
[ROW][C]Winsorized Mean ( 18 / 24 )[/C][C]45010.7361111111[/C][C]482.404764086714[/C][C]93.3049162487546[/C][/ROW]
[ROW][C]Winsorized Mean ( 19 / 24 )[/C][C]44937.6388888889[/C][C]468.512476516502[/C][C]95.9155649877471[/C][/ROW]
[ROW][C]Winsorized Mean ( 20 / 24 )[/C][C]45097.6388888889[/C][C]436.258021304375[/C][C]103.373775808295[/C][/ROW]
[ROW][C]Winsorized Mean ( 21 / 24 )[/C][C]44817.0555555556[/C][C]390.547611652515[/C][C]114.754396694227[/C][/ROW]
[ROW][C]Winsorized Mean ( 22 / 24 )[/C][C]44807.5833333333[/C][C]379.517246350911[/C][C]118.064682867938[/C][/ROW]
[ROW][C]Winsorized Mean ( 23 / 24 )[/C][C]44928.3333333333[/C][C]358.671430736987[/C][C]125.26320605189[/C][/ROW]
[ROW][C]Winsorized Mean ( 24 / 24 )[/C][C]44970[/C][C]333.122853148076[/C][C]134.9952414703[/C][/ROW]
[ROW][C]Trimmed Mean ( 1 / 24 )[/C][C]45765.6714285714[/C][C]818.712925851982[/C][C]55.899534480839[/C][/ROW]
[ROW][C]Trimmed Mean ( 2 / 24 )[/C][C]45731.0147058823[/C][C]798.32322479274[/C][C]57.2838335221363[/C][/ROW]
[ROW][C]Trimmed Mean ( 3 / 24 )[/C][C]45686.0303030303[/C][C]779.880732310543[/C][C]58.5807911520994[/C][/ROW]
[ROW][C]Trimmed Mean ( 4 / 24 )[/C][C]45643.28125[/C][C]761.0283702281[/C][C]59.975794642609[/C][/ROW]
[ROW][C]Trimmed Mean ( 5 / 24 )[/C][C]45580.1451612903[/C][C]742.043884710295[/C][C]61.4251341469992[/C][/ROW]
[ROW][C]Trimmed Mean ( 6 / 24 )[/C][C]45523.85[/C][C]724.269720970502[/C][C]62.854829743537[/C][/ROW]
[ROW][C]Trimmed Mean ( 7 / 24 )[/C][C]45463.9310344828[/C][C]705.649456880973[/C][C]64.428492916918[/C][/ROW]
[ROW][C]Trimmed Mean ( 8 / 24 )[/C][C]45403.1964285714[/C][C]684.657228875673[/C][C]66.31522244077[/C][/ROW]
[ROW][C]Trimmed Mean ( 9 / 24 )[/C][C]45352.9074074074[/C][C]663.906589030215[/C][C]68.312181497785[/C][/ROW]
[ROW][C]Trimmed Mean ( 10 / 24 )[/C][C]45298.9230769231[/C][C]639.976711047655[/C][C]70.7821429982472[/C][/ROW]
[ROW][C]Trimmed Mean ( 11 / 24 )[/C][C]45217.5[/C][C]615.27617840632[/C][C]73.4913874239724[/C][/ROW]
[ROW][C]Trimmed Mean ( 12 / 24 )[/C][C]45152.3958333333[/C][C]593.593503257541[/C][C]76.0661893796759[/C][/ROW]
[ROW][C]Trimmed Mean ( 13 / 24 )[/C][C]45109.3913043478[/C][C]577.136601248556[/C][C]78.1606836349658[/C][/ROW]
[ROW][C]Trimmed Mean ( 14 / 24 )[/C][C]45068.7727272727[/C][C]560.985472807914[/C][C]80.3385736562641[/C][/ROW]
[ROW][C]Trimmed Mean ( 15 / 24 )[/C][C]45023.9047619048[/C][C]541.300470669004[/C][C]83.1772872952777[/C][/ROW]
[ROW][C]Trimmed Mean ( 16 / 24 )[/C][C]44989.875[/C][C]525.974025861934[/C][C]85.5363055737845[/C][/ROW]
[ROW][C]Trimmed Mean ( 17 / 24 )[/C][C]44961.7894736842[/C][C]508.832672597341[/C][C]88.3626227148039[/C][/ROW]
[ROW][C]Trimmed Mean ( 18 / 24 )[/C][C]44924.4722222222[/C][C]487.259734013239[/C][C]92.1982037222915[/C][/ROW]
[ROW][C]Trimmed Mean ( 19 / 24 )[/C][C]44914.3235294118[/C][C]471.701115602816[/C][C]95.2177598138875[/C][/ROW]
[ROW][C]Trimmed Mean ( 20 / 24 )[/C][C]44911.5625[/C][C]453.176610381176[/C][C]99.1038846030115[/C][/ROW]
[ROW][C]Trimmed Mean ( 21 / 24 )[/C][C]44889.2333333333[/C][C]435.661372462534[/C][C]103.036982782295[/C][/ROW]
[ROW][C]Trimmed Mean ( 22 / 24 )[/C][C]44898.0714285714[/C][C]423.890265850719[/C][C]105.919090494952[/C][/ROW]
[ROW][C]Trimmed Mean ( 23 / 24 )[/C][C]44909.4615384615[/C][C]408.593449364898[/C][C]109.912338556252[/C][/ROW]
[ROW][C]Trimmed Mean ( 24 / 24 )[/C][C]44907[/C][C]391.579516977002[/C][C]114.6816880175[/C][/ROW]
[ROW][C]Median[/C][C]45233[/C][C][/C][C][/C][/ROW]
[ROW][C]Midrange[/C][C]47046[/C][C][/C][C][/C][/ROW]
[ROW][C]Midmean - Weighted Average at Xnp[/C][C]44790.8378378378[/C][C][/C][C][/C][/ROW]
[ROW][C]Midmean - Weighted Average at X(n+1)p[/C][C]44924.4722222222[/C][C][/C][C][/C][/ROW]
[ROW][C]Midmean - Empirical Distribution Function[/C][C]44790.8378378378[/C][C][/C][C][/C][/ROW]
[ROW][C]Midmean - Empirical Distribution Function - Averaging[/C][C]44924.4722222222[/C][C][/C][C][/C][/ROW]
[ROW][C]Midmean - Empirical Distribution Function - Interpolation[/C][C]44924.4722222222[/C][C][/C][C][/C][/ROW]
[ROW][C]Midmean - Closest Observation[/C][C]44790.8378378378[/C][C][/C][C][/C][/ROW]
[ROW][C]Midmean - True Basic - Statistics Graphics Toolkit[/C][C]44924.4722222222[/C][C][/C][C][/C][/ROW]
[ROW][C]Midmean - MS Excel (old versions)[/C][C]44961.7894736842[/C][C][/C][C][/C][/ROW]
[ROW][C]Number of observations[/C][C]72[/C][C][/C][C][/C][/ROW]
[/TABLE]
Source: https://freestatistics.org/blog/index.php?pk=&T=1

Globally Unique Identifier (entire table): ba.freestatistics.org/blog/index.php?pk=&T=1

As an alternative you can also use a QR Code:  

The GUIDs for individual cells are displayed in the table below:

Central Tendency - Ungrouped Data
MeasureValueS.E.Value/S.E.
Arithmetic Mean45801.2361111111844.29089837858654.2481699128462
Geometric Mean45260.5254611696
Harmonic Mean44733.5906308401
Quadratic Mean46350.4471920474
Winsorized Mean ( 1 / 24 )45798.4027777778835.82035682373554.7945529250087
Winsorized Mean ( 2 / 24 )45813.4861111111826.45717022882455.4335878027734
Winsorized Mean ( 3 / 24 )45800.0277777778819.13909346900755.9123940524158
Winsorized Mean ( 4 / 24 )45860.75808.50801600990356.7226905508359
Winsorized Mean ( 5 / 24 )45814.7083333333791.82227811815157.8598374905753
Winsorized Mean ( 6 / 24 )45813.4583333333780.52287957929458.6958557294657
Winsorized Mean ( 7 / 24 )45794.5972222222772.91040464408959.249554601752
Winsorized Mean ( 8 / 24 )45704.9305555556752.45303310512660.7412403760888
Winsorized Mean ( 9 / 24 )45703.8055555556743.91676577226161.4367193460284
Winsorized Mean ( 10 / 24 )45864.3611111111719.55824109387963.7396092377285
Winsorized Mean ( 11 / 24 )45694.9305555556680.48424064844367.1506080905154
Winsorized Mean ( 12 / 24 )45482.0972222222633.42845905322771.8030530080752
Winsorized Mean ( 13 / 24 )45432.0833333333610.28184814435774.4444283759638
Winsorized Mean ( 14 / 24 )45435.1944444444602.66024000442875.3910602167991
Winsorized Mean ( 15 / 24 )45307.4861111111558.2015568663881.166893129889
Winsorized Mean ( 16 / 24 )45227.0416666667543.08474267820483.2780560978955
Winsorized Mean ( 17 / 24 )45278.9861111111534.20464862183484.7596257874655
Winsorized Mean ( 18 / 24 )45010.7361111111482.40476408671493.3049162487546
Winsorized Mean ( 19 / 24 )44937.6388888889468.51247651650295.9155649877471
Winsorized Mean ( 20 / 24 )45097.6388888889436.258021304375103.373775808295
Winsorized Mean ( 21 / 24 )44817.0555555556390.547611652515114.754396694227
Winsorized Mean ( 22 / 24 )44807.5833333333379.517246350911118.064682867938
Winsorized Mean ( 23 / 24 )44928.3333333333358.671430736987125.26320605189
Winsorized Mean ( 24 / 24 )44970333.122853148076134.9952414703
Trimmed Mean ( 1 / 24 )45765.6714285714818.71292585198255.899534480839
Trimmed Mean ( 2 / 24 )45731.0147058823798.3232247927457.2838335221363
Trimmed Mean ( 3 / 24 )45686.0303030303779.88073231054358.5807911520994
Trimmed Mean ( 4 / 24 )45643.28125761.028370228159.975794642609
Trimmed Mean ( 5 / 24 )45580.1451612903742.04388471029561.4251341469992
Trimmed Mean ( 6 / 24 )45523.85724.26972097050262.854829743537
Trimmed Mean ( 7 / 24 )45463.9310344828705.64945688097364.428492916918
Trimmed Mean ( 8 / 24 )45403.1964285714684.65722887567366.31522244077
Trimmed Mean ( 9 / 24 )45352.9074074074663.90658903021568.312181497785
Trimmed Mean ( 10 / 24 )45298.9230769231639.97671104765570.7821429982472
Trimmed Mean ( 11 / 24 )45217.5615.2761784063273.4913874239724
Trimmed Mean ( 12 / 24 )45152.3958333333593.59350325754176.0661893796759
Trimmed Mean ( 13 / 24 )45109.3913043478577.13660124855678.1606836349658
Trimmed Mean ( 14 / 24 )45068.7727272727560.98547280791480.3385736562641
Trimmed Mean ( 15 / 24 )45023.9047619048541.30047066900483.1772872952777
Trimmed Mean ( 16 / 24 )44989.875525.97402586193485.5363055737845
Trimmed Mean ( 17 / 24 )44961.7894736842508.83267259734188.3626227148039
Trimmed Mean ( 18 / 24 )44924.4722222222487.25973401323992.1982037222915
Trimmed Mean ( 19 / 24 )44914.3235294118471.70111560281695.2177598138875
Trimmed Mean ( 20 / 24 )44911.5625453.17661038117699.1038846030115
Trimmed Mean ( 21 / 24 )44889.2333333333435.661372462534103.036982782295
Trimmed Mean ( 22 / 24 )44898.0714285714423.890265850719105.919090494952
Trimmed Mean ( 23 / 24 )44909.4615384615408.593449364898109.912338556252
Trimmed Mean ( 24 / 24 )44907391.579516977002114.6816880175
Median45233
Midrange47046
Midmean - Weighted Average at Xnp44790.8378378378
Midmean - Weighted Average at X(n+1)p44924.4722222222
Midmean - Empirical Distribution Function44790.8378378378
Midmean - Empirical Distribution Function - Averaging44924.4722222222
Midmean - Empirical Distribution Function - Interpolation44924.4722222222
Midmean - Closest Observation44790.8378378378
Midmean - True Basic - Statistics Graphics Toolkit44924.4722222222
Midmean - MS Excel (old versions)44961.7894736842
Number of observations72


Parameters (Session):
Parameters (R input):
R code (references can be found in the software module):
geomean <- function(x) {
return(exp(mean(log(x))))
}
harmean <- function(x) {
return(1/mean(1/x))
}
quamean <- function(x) {
return(sqrt(mean(x*x)))
}
winmean <- function(x) {
x <-sort(x[!is.na(x)])
n<-length(x)
denom <- 3
nodenom <- n/denom
if (nodenom>40) denom <- n/40
sqrtn = sqrt(n)
roundnodenom = floor(nodenom)
win <- array(NA,dim=c(roundnodenom,2))
for (j in 1:roundnodenom) {
win[j,1] <- (j*x[j+1]+sum(x[(j+1):(n-j)])+j*x[n-j])/n
win[j,2] <- sd(c(rep(x[j+1],j),x[(j+1):(n-j)],rep(x[n-j],j)))/sqrtn
}
return(win)
}
trimean <- function(x) {
x <-sort(x[!is.na(x)])
n<-length(x)
denom <- 3
nodenom <- n/denom
if (nodenom>40) denom <- n/40
sqrtn = sqrt(n)
roundnodenom = floor(nodenom)
tri <- array(NA,dim=c(roundnodenom,2))
for (j in 1:roundnodenom) {
tri[j,1] <- mean(x,trim=j/n)
tri[j,2] <- sd(x[(j+1):(n-j)]) / sqrt(n-j*2)
}
return(tri)
}
midrange <- function(x) {
return((max(x)+min(x))/2)
}
q1 <- function(data,n,p,i,f) {
np <- n*p;
i <<- floor(np)
f <<- np - i
qvalue <- (1-f)*data[i] + f*data[i+1]
}
q2 <- function(data,n,p,i,f) {
np <- (n+1)*p
i <<- floor(np)
f <<- np - i
qvalue <- (1-f)*data[i] + f*data[i+1]
}
q3 <- function(data,n,p,i,f) {
np <- n*p
i <<- floor(np)
f <<- np - i
if (f==0) {
qvalue <- data[i]
} else {
qvalue <- data[i+1]
}
}
q4 <- function(data,n,p,i,f) {
np <- n*p
i <<- floor(np)
f <<- np - i
if (f==0) {
qvalue <- (data[i]+data[i+1])/2
} else {
qvalue <- data[i+1]
}
}
q5 <- function(data,n,p,i,f) {
np <- (n-1)*p
i <<- floor(np)
f <<- np - i
if (f==0) {
qvalue <- data[i+1]
} else {
qvalue <- data[i+1] + f*(data[i+2]-data[i+1])
}
}
q6 <- function(data,n,p,i,f) {
np <- n*p+0.5
i <<- floor(np)
f <<- np - i
qvalue <- data[i]
}
q7 <- function(data,n,p,i,f) {
np <- (n+1)*p
i <<- floor(np)
f <<- np - i
if (f==0) {
qvalue <- data[i]
} else {
qvalue <- f*data[i] + (1-f)*data[i+1]
}
}
q8 <- function(data,n,p,i,f) {
np <- (n+1)*p
i <<- floor(np)
f <<- np - i
if (f==0) {
qvalue <- data[i]
} else {
if (f == 0.5) {
qvalue <- (data[i]+data[i+1])/2
} else {
if (f < 0.5) {
qvalue <- data[i]
} else {
qvalue <- data[i+1]
}
}
}
}
midmean <- function(x,def) {
x <-sort(x[!is.na(x)])
n<-length(x)
if (def==1) {
qvalue1 <- q1(x,n,0.25,i,f)
qvalue3 <- q1(x,n,0.75,i,f)
}
if (def==2) {
qvalue1 <- q2(x,n,0.25,i,f)
qvalue3 <- q2(x,n,0.75,i,f)
}
if (def==3) {
qvalue1 <- q3(x,n,0.25,i,f)
qvalue3 <- q3(x,n,0.75,i,f)
}
if (def==4) {
qvalue1 <- q4(x,n,0.25,i,f)
qvalue3 <- q4(x,n,0.75,i,f)
}
if (def==5) {
qvalue1 <- q5(x,n,0.25,i,f)
qvalue3 <- q5(x,n,0.75,i,f)
}
if (def==6) {
qvalue1 <- q6(x,n,0.25,i,f)
qvalue3 <- q6(x,n,0.75,i,f)
}
if (def==7) {
qvalue1 <- q7(x,n,0.25,i,f)
qvalue3 <- q7(x,n,0.75,i,f)
}
if (def==8) {
qvalue1 <- q8(x,n,0.25,i,f)
qvalue3 <- q8(x,n,0.75,i,f)
}
midm <- 0
myn <- 0
roundno4 <- round(n/4)
round3no4 <- round(3*n/4)
for (i in 1:n) {
if ((x[i]>=qvalue1) & (x[i]<=qvalue3)){
midm = midm + x[i]
myn = myn + 1
}
}
midm = midm / myn
return(midm)
}
(arm <- mean(x))
sqrtn <- sqrt(length(x))
(armse <- sd(x) / sqrtn)
(armose <- arm / armse)
(geo <- geomean(x))
(har <- harmean(x))
(qua <- quamean(x))
(win <- winmean(x))
(tri <- trimean(x))
(midr <- midrange(x))
midm <- array(NA,dim=8)
for (j in 1:8) midm[j] <- midmean(x,j)
midm
bitmap(file='test1.png')
lb <- win[,1] - 2*win[,2]
ub <- win[,1] + 2*win[,2]
if ((ylimmin == '') | (ylimmax == '')) plot(win[,1],type='b',main=main, xlab='j', pch=19, ylab='Winsorized Mean(j/n)', ylim=c(min(lb),max(ub))) else plot(win[,1],type='l',main=main, xlab='j', pch=19, ylab='Winsorized Mean(j/n)', ylim=c(ylimmin,ylimmax))
lines(ub,lty=3)
lines(lb,lty=3)
grid()
dev.off()
bitmap(file='test2.png')
lb <- tri[,1] - 2*tri[,2]
ub <- tri[,1] + 2*tri[,2]
if ((ylimmin == '') | (ylimmax == '')) plot(tri[,1],type='b',main=main, xlab='j', pch=19, ylab='Trimmed Mean(j/n)', ylim=c(min(lb),max(ub))) else plot(tri[,1],type='l',main=main, xlab='j', pch=19, ylab='Trimmed Mean(j/n)', ylim=c(ylimmin,ylimmax))
lines(ub,lty=3)
lines(lb,lty=3)
grid()
dev.off()
load(file='createtable')
a<-table.start()
a<-table.row.start(a)
a<-table.element(a,'Central Tendency - Ungrouped Data',4,TRUE)
a<-table.row.end(a)
a<-table.row.start(a)
a<-table.element(a,'Measure',header=TRUE)
a<-table.element(a,'Value',header=TRUE)
a<-table.element(a,'S.E.',header=TRUE)
a<-table.element(a,'Value/S.E.',header=TRUE)
a<-table.row.end(a)
a<-table.row.start(a)
a<-table.element(a,hyperlink('arithmetic_mean.htm', 'Arithmetic Mean', 'click to view the definition of the Arithmetic Mean'),header=TRUE)
a<-table.element(a,arm)
a<-table.element(a,hyperlink('arithmetic_mean_standard_error.htm', armse, 'click to view the definition of the Standard Error of the Arithmetic Mean'))
a<-table.element(a,armose)
a<-table.row.end(a)
a<-table.row.start(a)
a<-table.element(a,hyperlink('geometric_mean.htm', 'Geometric Mean', 'click to view the definition of the Geometric Mean'),header=TRUE)
a<-table.element(a,geo)
a<-table.element(a,'')
a<-table.row.end(a)
a<-table.row.start(a)
a<-table.element(a,hyperlink('harmonic_mean.htm', 'Harmonic Mean', 'click to view the definition of the Harmonic Mean'),header=TRUE)
a<-table.element(a,har)
a<-table.element(a,'')
a<-table.row.end(a)
a<-table.row.start(a)
a<-table.element(a,hyperlink('quadratic_mean.htm', 'Quadratic Mean', 'click to view the definition of the Quadratic Mean'),header=TRUE)
a<-table.element(a,qua)
a<-table.element(a,'')
a<-table.row.end(a)
for (j in 1:length(win[,1])) {
a<-table.row.start(a)
mylabel <- paste('Winsorized Mean (',j)
mylabel <- paste(mylabel,'/')
mylabel <- paste(mylabel,length(win[,1]))
mylabel <- paste(mylabel,')')
a<-table.element(a,hyperlink('winsorized_mean.htm', mylabel, 'click to view the definition of the Winsorized Mean'),header=TRUE)
a<-table.element(a,win[j,1])
a<-table.element(a,win[j,2])
a<-table.element(a,win[j,1]/win[j,2])
a<-table.row.end(a)
}
for (j in 1:length(tri[,1])) {
a<-table.row.start(a)
mylabel <- paste('Trimmed Mean (',j)
mylabel <- paste(mylabel,'/')
mylabel <- paste(mylabel,length(tri[,1]))
mylabel <- paste(mylabel,')')
a<-table.element(a,hyperlink('arithmetic_mean.htm', mylabel, 'click to view the definition of the Trimmed Mean'),header=TRUE)
a<-table.element(a,tri[j,1])
a<-table.element(a,tri[j,2])
a<-table.element(a,tri[j,1]/tri[j,2])
a<-table.row.end(a)
}
a<-table.row.start(a)
a<-table.element(a,hyperlink('median_1.htm', 'Median', 'click to view the definition of the Median'),header=TRUE)
a<-table.element(a,median(x))
a<-table.element(a,'')
a<-table.row.end(a)
a<-table.row.start(a)
a<-table.element(a,hyperlink('midrange.htm', 'Midrange', 'click to view the definition of the Midrange'),header=TRUE)
a<-table.element(a,midr)
a<-table.element(a,'')
a<-table.row.end(a)
a<-table.row.start(a)
mymid <- hyperlink('midmean.htm', 'Midmean', 'click to view the definition of the Midmean')
mylabel <- paste(mymid,hyperlink('method_1.htm','Weighted Average at Xnp',''),sep=' - ')
a<-table.element(a,mylabel,header=TRUE)
a<-table.element(a,midm[1])
a<-table.element(a,'')
a<-table.row.end(a)
a<-table.row.start(a)
mymid <- hyperlink('midmean.htm', 'Midmean', 'click to view the definition of the Midmean')
mylabel <- paste(mymid,hyperlink('method_2.htm','Weighted Average at X(n+1)p',''),sep=' - ')
a<-table.element(a,mylabel,header=TRUE)
a<-table.element(a,midm[2])
a<-table.element(a,'')
a<-table.row.end(a)
a<-table.row.start(a)
mymid <- hyperlink('midmean.htm', 'Midmean', 'click to view the definition of the Midmean')
mylabel <- paste(mymid,hyperlink('method_3.htm','Empirical Distribution Function',''),sep=' - ')
a<-table.element(a,mylabel,header=TRUE)
a<-table.element(a,midm[3])
a<-table.element(a,'')
a<-table.row.end(a)
a<-table.row.start(a)
mymid <- hyperlink('midmean.htm', 'Midmean', 'click to view the definition of the Midmean')
mylabel <- paste(mymid,hyperlink('method_4.htm','Empirical Distribution Function - Averaging',''),sep=' - ')
a<-table.element(a,mylabel,header=TRUE)
a<-table.element(a,midm[4])
a<-table.element(a,'')
a<-table.row.end(a)
a<-table.row.start(a)
mymid <- hyperlink('midmean.htm', 'Midmean', 'click to view the definition of the Midmean')
mylabel <- paste(mymid,hyperlink('method_5.htm','Empirical Distribution Function - Interpolation',''),sep=' - ')
a<-table.element(a,mylabel,header=TRUE)
a<-table.element(a,midm[5])
a<-table.element(a,'')
a<-table.row.end(a)
a<-table.row.start(a)
mymid <- hyperlink('midmean.htm', 'Midmean', 'click to view the definition of the Midmean')
mylabel <- paste(mymid,hyperlink('method_6.htm','Closest Observation',''),sep=' - ')
a<-table.element(a,mylabel,header=TRUE)
a<-table.element(a,midm[6])
a<-table.element(a,'')
a<-table.row.end(a)
a<-table.row.start(a)
mymid <- hyperlink('midmean.htm', 'Midmean', 'click to view the definition of the Midmean')
mylabel <- paste(mymid,hyperlink('method_7.htm','True Basic - Statistics Graphics Toolkit',''),sep=' - ')
a<-table.element(a,mylabel,header=TRUE)
a<-table.element(a,midm[7])
a<-table.element(a,'')
a<-table.row.end(a)
a<-table.row.start(a)
mymid <- hyperlink('midmean.htm', 'Midmean', 'click to view the definition of the Midmean')
mylabel <- paste(mymid,hyperlink('method_8.htm','MS Excel (old versions)',''),sep=' - ')
a<-table.element(a,mylabel,header=TRUE)
a<-table.element(a,midm[8])
a<-table.element(a,'')
a<-table.row.end(a)
a<-table.row.start(a)
a<-table.element(a,'Number of observations',header=TRUE)
a<-table.element(a,length(x))
a<-table.element(a,'')
a<-table.row.end(a)
a<-table.end(a)
table.save(a,file='mytable.tab')