Free Statistics

of Irreproducible Research!

Author's title

Author*Unverified author*
R Software Modulerwasp_centraltendency.wasp
Title produced by softwareCentral Tendency
Date of computationTue, 14 Mar 2017 18:59:44 +0000
Cite this page as followsStatistical Computations at FreeStatistics.org, Office for Research Development and Education, URL https://freestatistics.org/blog/index.php?v=date/2017/Mar/14/t14895183651nzswlu45p7jt7r.htm/, Retrieved Tue, 14 May 2024 12:41:13 +0200
Statistical Computations at FreeStatistics.org, Office for Research Development and Education, URL https://freestatistics.org/blog/index.php?pk=, Retrieved Tue, 14 May 2024 12:41:13 +0200
QR Codes:

Original text written by user:
IsPrivate?No (this computation is public)
User-defined keywords
Estimated Impact0
Dataseries X:
92,81
92,82
92,82
92,88
93,38
93,89
94,1
94,18
94,3
94,31
94,36
94,38
94,38
94,5
94,57
94,89
96,71
97,57
97,88
97,97
98,4
98,51
98,46
98,46
98,48
98,6
98,6
98,71
99,13
99,2
99,3
100,18
101,37
101,77
102,28
102,38
102,35
103,23
105,37
106,62
107
107,24
107,31
107,35
107,42
107,58
107,64
107,64
107,68
108,51
110,37
111,31
111,57
111,66
111,69
111,9
111,95
112,04
112,13
112,14
112,13
113,59
115,03
115,7
116,1
116,12
116,32
116,51
116,63
116,92
116,96
117,15


Summary of computational transaction
Raw Inputview raw input (R code)
Raw Outputview raw output of R engine
Computing time2 seconds
R Server'George Udny Yule' @ yule.wessa.net

\begin{tabular}{lllllllll}
\hline
Summary of computational transaction \tabularnewline
Raw Input & view raw input (R code)  \tabularnewline
Raw Output & view raw output of R engine  \tabularnewline
Computing time & 2 seconds \tabularnewline
R Server & 'George Udny Yule' @ yule.wessa.net \tabularnewline
\hline
\end{tabular}
%Source: https://freestatistics.org/blog/index.php?pk=&T=0

[TABLE]
[ROW][C]Summary of computational transaction[/C][/ROW]
[ROW][C]Raw Input[/C][C]view raw input (R code) [/C][/ROW]
[ROW][C]Raw Output[/C][C]view raw output of R engine [/C][/ROW]
[ROW][C]Computing time[/C][C]2 seconds[/C][/ROW]
[ROW][C]R Server[/C][C]'George Udny Yule' @ yule.wessa.net[/C][/ROW]
[/TABLE]
Source: https://freestatistics.org/blog/index.php?pk=&T=0

Globally Unique Identifier (entire table): ba.freestatistics.org/blog/index.php?pk=&T=0

As an alternative you can also use a QR Code:  

The GUIDs for individual cells are displayed in the table below:

Summary of computational transaction
Raw Inputview raw input (R code)
Raw Outputview raw output of R engine
Computing time2 seconds
R Server'George Udny Yule' @ yule.wessa.net


Central Tendency - Ungrouped Data
MeasureValueS.E.Value/S.E.
Arithmetic Mean103.963750.944585808111141110.062790598022
Geometric Mean103.660829388732
Harmonic Mean103.360432015235
Quadratic Mean104.267974569536
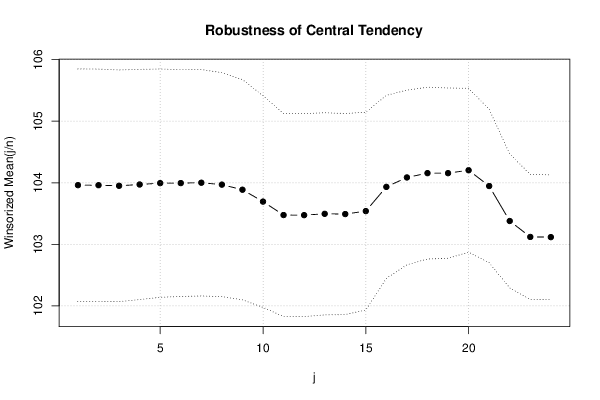
Winsorized Mean ( 1 / 24 )103.961250.944047406734414110.122912534251
Winsorized Mean ( 2 / 24 )103.9601388888890.943832224559225110.146841974419
Winsorized Mean ( 3 / 24 )103.9505555555560.941102387932959110.456159593722
Winsorized Mean ( 4 / 24 )103.9716666666670.935323895929822111.161135857976
Winsorized Mean ( 5 / 24 )103.9938888888890.927300686512417112.146890864505
Winsorized Mean ( 6 / 24 )103.9947222222220.921530013305809112.850065348562
Winsorized Mean ( 7 / 24 )104.0005555555560.919996957045915113.044456026788
Winsorized Mean ( 8 / 24 )103.9694444444440.909844629139535114.271647174278
Winsorized Mean ( 9 / 24 )103.8869444444440.894705095600916116.113057760859
Winsorized Mean ( 10 / 24 )103.6938888888890.859873420179189120.592038845997
Winsorized Mean ( 11 / 24 )103.4754166666670.825031984430029125.419885070459
Winsorized Mean ( 12 / 24 )103.473750.82478553757979125.455339946464
Winsorized Mean ( 13 / 24 )103.4954166666670.821432294695777125.993849200921
Winsorized Mean ( 14 / 24 )103.4915277777780.816750251057563126.711351044916
Winsorized Mean ( 15 / 24 )103.5394444444440.803805816503654128.811514321723
Winsorized Mean ( 16 / 24 )103.9327777777780.743724560255134139.746329934464
Winsorized Mean ( 17 / 24 )104.086250.709196282889525146.766491183392
Winsorized Mean ( 18 / 24 )104.156250.698140287207425149.1910034538
Winsorized Mean ( 19 / 24 )104.156250.691549750780928150.612808235969
Winsorized Mean ( 20 / 24 )104.2034722222220.665808019805979156.506784422014
Winsorized Mean ( 21 / 24 )103.9468055555560.623115117912982166.817980445905
Winsorized Mean ( 22 / 24 )103.3784722222220.543856989356358190.083926924555
Winsorized Mean ( 23 / 24 )103.1197222222220.508652865486257202.731035681167
Winsorized Mean ( 24 / 24 )103.1163888888890.505687229193875203.913373595114
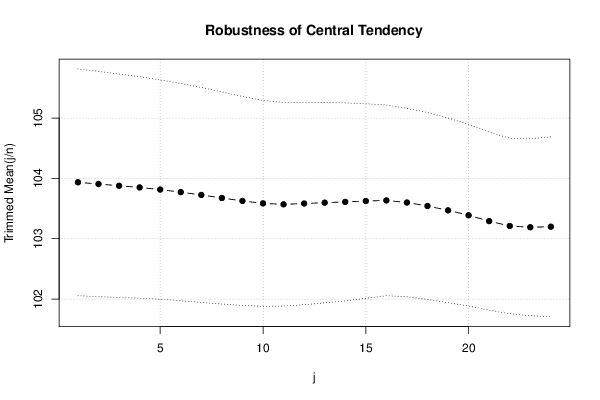
Trimmed Mean ( 1 / 24 )103.9347142857140.939450584370052110.633508579281
Trimmed Mean ( 2 / 24 )103.9066176470590.933423833598479111.317725032244
Trimmed Mean ( 3 / 24 )103.8774242424240.925831631715327112.199044279753
Trimmed Mean ( 4 / 24 )103.850.917425930144547113.197149314973
Trimmed Mean ( 5 / 24 )103.8146774193550.908803081892566114.232312244323
Trimmed Mean ( 6 / 24 )103.7716666666670.900195778036493115.276775562104
Trimmed Mean ( 7 / 24 )103.7255172413790.890648742683753116.460633996774
Trimmed Mean ( 8 / 24 )103.6750.878700708469576117.986703550711
Trimmed Mean ( 9 / 24 )103.6259259259260.865822178406422119.684998271416
Trimmed Mean ( 10 / 24 )103.5857692307690.852767977642128121.470050408295
Trimmed Mean ( 11 / 24 )103.57020.843548844018471122.779138083594
Trimmed Mean ( 12 / 24 )103.5831250.838313654520488123.561300047354
Trimmed Mean ( 13 / 24 )103.5973913043480.830485768725925124.743126499663
Trimmed Mean ( 14 / 24 )103.6102272727270.819979598611545126.357079429986
Trimmed Mean ( 15 / 24 )103.6247619047620.806233643152755128.529444020148
Trimmed Mean ( 16 / 24 )103.6350.790047061240252131.175730009436
Trimmed Mean ( 17 / 24 )103.5997368421050.780906072458874132.666066375814
Trimmed Mean ( 18 / 24 )103.54250.774325551382498133.719596124825
Trimmed Mean ( 19 / 24 )103.4702941176470.765415489011632135.181866062387
Trimmed Mean ( 20 / 24 )103.38906250.752191872315314137.450385074967
Trimmed Mean ( 21 / 24 )103.2913333333330.737616343183773140.03395435559
Trimmed Mean ( 22 / 24 )103.2110714285710.727136577945051141.941795474317
Trimmed Mean ( 23 / 24 )103.190.732808296896262140.814453707813
Trimmed Mean ( 24 / 24 )103.1991666666670.745407416238647138.446659395225
Median102.365
Midrange104.98
Midmean - Weighted Average at Xnp103.381081081081
Midmean - Weighted Average at X(n+1)p103.5425
Midmean - Empirical Distribution Function103.381081081081
Midmean - Empirical Distribution Function - Averaging103.5425
Midmean - Empirical Distribution Function - Interpolation103.5425
Midmean - Closest Observation103.381081081081
Midmean - True Basic - Statistics Graphics Toolkit103.5425
Midmean - MS Excel (old versions)103.599736842105
Number of observations72

\begin{tabular}{lllllllll}
\hline
Central Tendency - Ungrouped Data \tabularnewline
Measure & Value & S.E. & Value/S.E. \tabularnewline
Arithmetic Mean & 103.96375 & 0.944585808111141 & 110.062790598022 \tabularnewline
Geometric Mean & 103.660829388732 &  &  \tabularnewline
Harmonic Mean & 103.360432015235 &  &  \tabularnewline
Quadratic Mean & 104.267974569536 &  &  \tabularnewline
Winsorized Mean ( 1 / 24 ) & 103.96125 & 0.944047406734414 & 110.122912534251 \tabularnewline
Winsorized Mean ( 2 / 24 ) & 103.960138888889 & 0.943832224559225 & 110.146841974419 \tabularnewline
Winsorized Mean ( 3 / 24 ) & 103.950555555556 & 0.941102387932959 & 110.456159593722 \tabularnewline
Winsorized Mean ( 4 / 24 ) & 103.971666666667 & 0.935323895929822 & 111.161135857976 \tabularnewline
Winsorized Mean ( 5 / 24 ) & 103.993888888889 & 0.927300686512417 & 112.146890864505 \tabularnewline
Winsorized Mean ( 6 / 24 ) & 103.994722222222 & 0.921530013305809 & 112.850065348562 \tabularnewline
Winsorized Mean ( 7 / 24 ) & 104.000555555556 & 0.919996957045915 & 113.044456026788 \tabularnewline
Winsorized Mean ( 8 / 24 ) & 103.969444444444 & 0.909844629139535 & 114.271647174278 \tabularnewline
Winsorized Mean ( 9 / 24 ) & 103.886944444444 & 0.894705095600916 & 116.113057760859 \tabularnewline
Winsorized Mean ( 10 / 24 ) & 103.693888888889 & 0.859873420179189 & 120.592038845997 \tabularnewline
Winsorized Mean ( 11 / 24 ) & 103.475416666667 & 0.825031984430029 & 125.419885070459 \tabularnewline
Winsorized Mean ( 12 / 24 ) & 103.47375 & 0.82478553757979 & 125.455339946464 \tabularnewline
Winsorized Mean ( 13 / 24 ) & 103.495416666667 & 0.821432294695777 & 125.993849200921 \tabularnewline
Winsorized Mean ( 14 / 24 ) & 103.491527777778 & 0.816750251057563 & 126.711351044916 \tabularnewline
Winsorized Mean ( 15 / 24 ) & 103.539444444444 & 0.803805816503654 & 128.811514321723 \tabularnewline
Winsorized Mean ( 16 / 24 ) & 103.932777777778 & 0.743724560255134 & 139.746329934464 \tabularnewline
Winsorized Mean ( 17 / 24 ) & 104.08625 & 0.709196282889525 & 146.766491183392 \tabularnewline
Winsorized Mean ( 18 / 24 ) & 104.15625 & 0.698140287207425 & 149.1910034538 \tabularnewline
Winsorized Mean ( 19 / 24 ) & 104.15625 & 0.691549750780928 & 150.612808235969 \tabularnewline
Winsorized Mean ( 20 / 24 ) & 104.203472222222 & 0.665808019805979 & 156.506784422014 \tabularnewline
Winsorized Mean ( 21 / 24 ) & 103.946805555556 & 0.623115117912982 & 166.817980445905 \tabularnewline
Winsorized Mean ( 22 / 24 ) & 103.378472222222 & 0.543856989356358 & 190.083926924555 \tabularnewline
Winsorized Mean ( 23 / 24 ) & 103.119722222222 & 0.508652865486257 & 202.731035681167 \tabularnewline
Winsorized Mean ( 24 / 24 ) & 103.116388888889 & 0.505687229193875 & 203.913373595114 \tabularnewline
Trimmed Mean ( 1 / 24 ) & 103.934714285714 & 0.939450584370052 & 110.633508579281 \tabularnewline
Trimmed Mean ( 2 / 24 ) & 103.906617647059 & 0.933423833598479 & 111.317725032244 \tabularnewline
Trimmed Mean ( 3 / 24 ) & 103.877424242424 & 0.925831631715327 & 112.199044279753 \tabularnewline
Trimmed Mean ( 4 / 24 ) & 103.85 & 0.917425930144547 & 113.197149314973 \tabularnewline
Trimmed Mean ( 5 / 24 ) & 103.814677419355 & 0.908803081892566 & 114.232312244323 \tabularnewline
Trimmed Mean ( 6 / 24 ) & 103.771666666667 & 0.900195778036493 & 115.276775562104 \tabularnewline
Trimmed Mean ( 7 / 24 ) & 103.725517241379 & 0.890648742683753 & 116.460633996774 \tabularnewline
Trimmed Mean ( 8 / 24 ) & 103.675 & 0.878700708469576 & 117.986703550711 \tabularnewline
Trimmed Mean ( 9 / 24 ) & 103.625925925926 & 0.865822178406422 & 119.684998271416 \tabularnewline
Trimmed Mean ( 10 / 24 ) & 103.585769230769 & 0.852767977642128 & 121.470050408295 \tabularnewline
Trimmed Mean ( 11 / 24 ) & 103.5702 & 0.843548844018471 & 122.779138083594 \tabularnewline
Trimmed Mean ( 12 / 24 ) & 103.583125 & 0.838313654520488 & 123.561300047354 \tabularnewline
Trimmed Mean ( 13 / 24 ) & 103.597391304348 & 0.830485768725925 & 124.743126499663 \tabularnewline
Trimmed Mean ( 14 / 24 ) & 103.610227272727 & 0.819979598611545 & 126.357079429986 \tabularnewline
Trimmed Mean ( 15 / 24 ) & 103.624761904762 & 0.806233643152755 & 128.529444020148 \tabularnewline
Trimmed Mean ( 16 / 24 ) & 103.635 & 0.790047061240252 & 131.175730009436 \tabularnewline
Trimmed Mean ( 17 / 24 ) & 103.599736842105 & 0.780906072458874 & 132.666066375814 \tabularnewline
Trimmed Mean ( 18 / 24 ) & 103.5425 & 0.774325551382498 & 133.719596124825 \tabularnewline
Trimmed Mean ( 19 / 24 ) & 103.470294117647 & 0.765415489011632 & 135.181866062387 \tabularnewline
Trimmed Mean ( 20 / 24 ) & 103.3890625 & 0.752191872315314 & 137.450385074967 \tabularnewline
Trimmed Mean ( 21 / 24 ) & 103.291333333333 & 0.737616343183773 & 140.03395435559 \tabularnewline
Trimmed Mean ( 22 / 24 ) & 103.211071428571 & 0.727136577945051 & 141.941795474317 \tabularnewline
Trimmed Mean ( 23 / 24 ) & 103.19 & 0.732808296896262 & 140.814453707813 \tabularnewline
Trimmed Mean ( 24 / 24 ) & 103.199166666667 & 0.745407416238647 & 138.446659395225 \tabularnewline
Median & 102.365 &  &  \tabularnewline
Midrange & 104.98 &  &  \tabularnewline
Midmean - Weighted Average at Xnp & 103.381081081081 &  &  \tabularnewline
Midmean - Weighted Average at X(n+1)p & 103.5425 &  &  \tabularnewline
Midmean - Empirical Distribution Function & 103.381081081081 &  &  \tabularnewline
Midmean - Empirical Distribution Function - Averaging & 103.5425 &  &  \tabularnewline
Midmean - Empirical Distribution Function - Interpolation & 103.5425 &  &  \tabularnewline
Midmean - Closest Observation & 103.381081081081 &  &  \tabularnewline
Midmean - True Basic - Statistics Graphics Toolkit & 103.5425 &  &  \tabularnewline
Midmean - MS Excel (old versions) & 103.599736842105 &  &  \tabularnewline
Number of observations & 72 &  &  \tabularnewline
\hline
\end{tabular}
%Source: https://freestatistics.org/blog/index.php?pk=&T=1

[TABLE]
[ROW][C]Central Tendency - Ungrouped Data[/C][/ROW]
[ROW][C]Measure[/C][C]Value[/C][C]S.E.[/C][C]Value/S.E.[/C][/ROW]
[ROW][C]Arithmetic Mean[/C][C]103.96375[/C][C]0.944585808111141[/C][C]110.062790598022[/C][/ROW]
[ROW][C]Geometric Mean[/C][C]103.660829388732[/C][C][/C][C][/C][/ROW]
[ROW][C]Harmonic Mean[/C][C]103.360432015235[/C][C][/C][C][/C][/ROW]
[ROW][C]Quadratic Mean[/C][C]104.267974569536[/C][C][/C][C][/C][/ROW]
[ROW][C]Winsorized Mean ( 1 / 24 )[/C][C]103.96125[/C][C]0.944047406734414[/C][C]110.122912534251[/C][/ROW]
[ROW][C]Winsorized Mean ( 2 / 24 )[/C][C]103.960138888889[/C][C]0.943832224559225[/C][C]110.146841974419[/C][/ROW]
[ROW][C]Winsorized Mean ( 3 / 24 )[/C][C]103.950555555556[/C][C]0.941102387932959[/C][C]110.456159593722[/C][/ROW]
[ROW][C]Winsorized Mean ( 4 / 24 )[/C][C]103.971666666667[/C][C]0.935323895929822[/C][C]111.161135857976[/C][/ROW]
[ROW][C]Winsorized Mean ( 5 / 24 )[/C][C]103.993888888889[/C][C]0.927300686512417[/C][C]112.146890864505[/C][/ROW]
[ROW][C]Winsorized Mean ( 6 / 24 )[/C][C]103.994722222222[/C][C]0.921530013305809[/C][C]112.850065348562[/C][/ROW]
[ROW][C]Winsorized Mean ( 7 / 24 )[/C][C]104.000555555556[/C][C]0.919996957045915[/C][C]113.044456026788[/C][/ROW]
[ROW][C]Winsorized Mean ( 8 / 24 )[/C][C]103.969444444444[/C][C]0.909844629139535[/C][C]114.271647174278[/C][/ROW]
[ROW][C]Winsorized Mean ( 9 / 24 )[/C][C]103.886944444444[/C][C]0.894705095600916[/C][C]116.113057760859[/C][/ROW]
[ROW][C]Winsorized Mean ( 10 / 24 )[/C][C]103.693888888889[/C][C]0.859873420179189[/C][C]120.592038845997[/C][/ROW]
[ROW][C]Winsorized Mean ( 11 / 24 )[/C][C]103.475416666667[/C][C]0.825031984430029[/C][C]125.419885070459[/C][/ROW]
[ROW][C]Winsorized Mean ( 12 / 24 )[/C][C]103.47375[/C][C]0.82478553757979[/C][C]125.455339946464[/C][/ROW]
[ROW][C]Winsorized Mean ( 13 / 24 )[/C][C]103.495416666667[/C][C]0.821432294695777[/C][C]125.993849200921[/C][/ROW]
[ROW][C]Winsorized Mean ( 14 / 24 )[/C][C]103.491527777778[/C][C]0.816750251057563[/C][C]126.711351044916[/C][/ROW]
[ROW][C]Winsorized Mean ( 15 / 24 )[/C][C]103.539444444444[/C][C]0.803805816503654[/C][C]128.811514321723[/C][/ROW]
[ROW][C]Winsorized Mean ( 16 / 24 )[/C][C]103.932777777778[/C][C]0.743724560255134[/C][C]139.746329934464[/C][/ROW]
[ROW][C]Winsorized Mean ( 17 / 24 )[/C][C]104.08625[/C][C]0.709196282889525[/C][C]146.766491183392[/C][/ROW]
[ROW][C]Winsorized Mean ( 18 / 24 )[/C][C]104.15625[/C][C]0.698140287207425[/C][C]149.1910034538[/C][/ROW]
[ROW][C]Winsorized Mean ( 19 / 24 )[/C][C]104.15625[/C][C]0.691549750780928[/C][C]150.612808235969[/C][/ROW]
[ROW][C]Winsorized Mean ( 20 / 24 )[/C][C]104.203472222222[/C][C]0.665808019805979[/C][C]156.506784422014[/C][/ROW]
[ROW][C]Winsorized Mean ( 21 / 24 )[/C][C]103.946805555556[/C][C]0.623115117912982[/C][C]166.817980445905[/C][/ROW]
[ROW][C]Winsorized Mean ( 22 / 24 )[/C][C]103.378472222222[/C][C]0.543856989356358[/C][C]190.083926924555[/C][/ROW]
[ROW][C]Winsorized Mean ( 23 / 24 )[/C][C]103.119722222222[/C][C]0.508652865486257[/C][C]202.731035681167[/C][/ROW]
[ROW][C]Winsorized Mean ( 24 / 24 )[/C][C]103.116388888889[/C][C]0.505687229193875[/C][C]203.913373595114[/C][/ROW]
[ROW][C]Trimmed Mean ( 1 / 24 )[/C][C]103.934714285714[/C][C]0.939450584370052[/C][C]110.633508579281[/C][/ROW]
[ROW][C]Trimmed Mean ( 2 / 24 )[/C][C]103.906617647059[/C][C]0.933423833598479[/C][C]111.317725032244[/C][/ROW]
[ROW][C]Trimmed Mean ( 3 / 24 )[/C][C]103.877424242424[/C][C]0.925831631715327[/C][C]112.199044279753[/C][/ROW]
[ROW][C]Trimmed Mean ( 4 / 24 )[/C][C]103.85[/C][C]0.917425930144547[/C][C]113.197149314973[/C][/ROW]
[ROW][C]Trimmed Mean ( 5 / 24 )[/C][C]103.814677419355[/C][C]0.908803081892566[/C][C]114.232312244323[/C][/ROW]
[ROW][C]Trimmed Mean ( 6 / 24 )[/C][C]103.771666666667[/C][C]0.900195778036493[/C][C]115.276775562104[/C][/ROW]
[ROW][C]Trimmed Mean ( 7 / 24 )[/C][C]103.725517241379[/C][C]0.890648742683753[/C][C]116.460633996774[/C][/ROW]
[ROW][C]Trimmed Mean ( 8 / 24 )[/C][C]103.675[/C][C]0.878700708469576[/C][C]117.986703550711[/C][/ROW]
[ROW][C]Trimmed Mean ( 9 / 24 )[/C][C]103.625925925926[/C][C]0.865822178406422[/C][C]119.684998271416[/C][/ROW]
[ROW][C]Trimmed Mean ( 10 / 24 )[/C][C]103.585769230769[/C][C]0.852767977642128[/C][C]121.470050408295[/C][/ROW]
[ROW][C]Trimmed Mean ( 11 / 24 )[/C][C]103.5702[/C][C]0.843548844018471[/C][C]122.779138083594[/C][/ROW]
[ROW][C]Trimmed Mean ( 12 / 24 )[/C][C]103.583125[/C][C]0.838313654520488[/C][C]123.561300047354[/C][/ROW]
[ROW][C]Trimmed Mean ( 13 / 24 )[/C][C]103.597391304348[/C][C]0.830485768725925[/C][C]124.743126499663[/C][/ROW]
[ROW][C]Trimmed Mean ( 14 / 24 )[/C][C]103.610227272727[/C][C]0.819979598611545[/C][C]126.357079429986[/C][/ROW]
[ROW][C]Trimmed Mean ( 15 / 24 )[/C][C]103.624761904762[/C][C]0.806233643152755[/C][C]128.529444020148[/C][/ROW]
[ROW][C]Trimmed Mean ( 16 / 24 )[/C][C]103.635[/C][C]0.790047061240252[/C][C]131.175730009436[/C][/ROW]
[ROW][C]Trimmed Mean ( 17 / 24 )[/C][C]103.599736842105[/C][C]0.780906072458874[/C][C]132.666066375814[/C][/ROW]
[ROW][C]Trimmed Mean ( 18 / 24 )[/C][C]103.5425[/C][C]0.774325551382498[/C][C]133.719596124825[/C][/ROW]
[ROW][C]Trimmed Mean ( 19 / 24 )[/C][C]103.470294117647[/C][C]0.765415489011632[/C][C]135.181866062387[/C][/ROW]
[ROW][C]Trimmed Mean ( 20 / 24 )[/C][C]103.3890625[/C][C]0.752191872315314[/C][C]137.450385074967[/C][/ROW]
[ROW][C]Trimmed Mean ( 21 / 24 )[/C][C]103.291333333333[/C][C]0.737616343183773[/C][C]140.03395435559[/C][/ROW]
[ROW][C]Trimmed Mean ( 22 / 24 )[/C][C]103.211071428571[/C][C]0.727136577945051[/C][C]141.941795474317[/C][/ROW]
[ROW][C]Trimmed Mean ( 23 / 24 )[/C][C]103.19[/C][C]0.732808296896262[/C][C]140.814453707813[/C][/ROW]
[ROW][C]Trimmed Mean ( 24 / 24 )[/C][C]103.199166666667[/C][C]0.745407416238647[/C][C]138.446659395225[/C][/ROW]
[ROW][C]Median[/C][C]102.365[/C][C][/C][C][/C][/ROW]
[ROW][C]Midrange[/C][C]104.98[/C][C][/C][C][/C][/ROW]
[ROW][C]Midmean - Weighted Average at Xnp[/C][C]103.381081081081[/C][C][/C][C][/C][/ROW]
[ROW][C]Midmean - Weighted Average at X(n+1)p[/C][C]103.5425[/C][C][/C][C][/C][/ROW]
[ROW][C]Midmean - Empirical Distribution Function[/C][C]103.381081081081[/C][C][/C][C][/C][/ROW]
[ROW][C]Midmean - Empirical Distribution Function - Averaging[/C][C]103.5425[/C][C][/C][C][/C][/ROW]
[ROW][C]Midmean - Empirical Distribution Function - Interpolation[/C][C]103.5425[/C][C][/C][C][/C][/ROW]
[ROW][C]Midmean - Closest Observation[/C][C]103.381081081081[/C][C][/C][C][/C][/ROW]
[ROW][C]Midmean - True Basic - Statistics Graphics Toolkit[/C][C]103.5425[/C][C][/C][C][/C][/ROW]
[ROW][C]Midmean - MS Excel (old versions)[/C][C]103.599736842105[/C][C][/C][C][/C][/ROW]
[ROW][C]Number of observations[/C][C]72[/C][C][/C][C][/C][/ROW]
[/TABLE]
Source: https://freestatistics.org/blog/index.php?pk=&T=1

Globally Unique Identifier (entire table): ba.freestatistics.org/blog/index.php?pk=&T=1

As an alternative you can also use a QR Code:  

The GUIDs for individual cells are displayed in the table below:

Central Tendency - Ungrouped Data
MeasureValueS.E.Value/S.E.
Arithmetic Mean103.963750.944585808111141110.062790598022
Geometric Mean103.660829388732
Harmonic Mean103.360432015235
Quadratic Mean104.267974569536
Winsorized Mean ( 1 / 24 )103.961250.944047406734414110.122912534251
Winsorized Mean ( 2 / 24 )103.9601388888890.943832224559225110.146841974419
Winsorized Mean ( 3 / 24 )103.9505555555560.941102387932959110.456159593722
Winsorized Mean ( 4 / 24 )103.9716666666670.935323895929822111.161135857976
Winsorized Mean ( 5 / 24 )103.9938888888890.927300686512417112.146890864505
Winsorized Mean ( 6 / 24 )103.9947222222220.921530013305809112.850065348562
Winsorized Mean ( 7 / 24 )104.0005555555560.919996957045915113.044456026788
Winsorized Mean ( 8 / 24 )103.9694444444440.909844629139535114.271647174278
Winsorized Mean ( 9 / 24 )103.8869444444440.894705095600916116.113057760859
Winsorized Mean ( 10 / 24 )103.6938888888890.859873420179189120.592038845997
Winsorized Mean ( 11 / 24 )103.4754166666670.825031984430029125.419885070459
Winsorized Mean ( 12 / 24 )103.473750.82478553757979125.455339946464
Winsorized Mean ( 13 / 24 )103.4954166666670.821432294695777125.993849200921
Winsorized Mean ( 14 / 24 )103.4915277777780.816750251057563126.711351044916
Winsorized Mean ( 15 / 24 )103.5394444444440.803805816503654128.811514321723
Winsorized Mean ( 16 / 24 )103.9327777777780.743724560255134139.746329934464
Winsorized Mean ( 17 / 24 )104.086250.709196282889525146.766491183392
Winsorized Mean ( 18 / 24 )104.156250.698140287207425149.1910034538
Winsorized Mean ( 19 / 24 )104.156250.691549750780928150.612808235969
Winsorized Mean ( 20 / 24 )104.2034722222220.665808019805979156.506784422014
Winsorized Mean ( 21 / 24 )103.9468055555560.623115117912982166.817980445905
Winsorized Mean ( 22 / 24 )103.3784722222220.543856989356358190.083926924555
Winsorized Mean ( 23 / 24 )103.1197222222220.508652865486257202.731035681167
Winsorized Mean ( 24 / 24 )103.1163888888890.505687229193875203.913373595114
Trimmed Mean ( 1 / 24 )103.9347142857140.939450584370052110.633508579281
Trimmed Mean ( 2 / 24 )103.9066176470590.933423833598479111.317725032244
Trimmed Mean ( 3 / 24 )103.8774242424240.925831631715327112.199044279753
Trimmed Mean ( 4 / 24 )103.850.917425930144547113.197149314973
Trimmed Mean ( 5 / 24 )103.8146774193550.908803081892566114.232312244323
Trimmed Mean ( 6 / 24 )103.7716666666670.900195778036493115.276775562104
Trimmed Mean ( 7 / 24 )103.7255172413790.890648742683753116.460633996774
Trimmed Mean ( 8 / 24 )103.6750.878700708469576117.986703550711
Trimmed Mean ( 9 / 24 )103.6259259259260.865822178406422119.684998271416
Trimmed Mean ( 10 / 24 )103.5857692307690.852767977642128121.470050408295
Trimmed Mean ( 11 / 24 )103.57020.843548844018471122.779138083594
Trimmed Mean ( 12 / 24 )103.5831250.838313654520488123.561300047354
Trimmed Mean ( 13 / 24 )103.5973913043480.830485768725925124.743126499663
Trimmed Mean ( 14 / 24 )103.6102272727270.819979598611545126.357079429986
Trimmed Mean ( 15 / 24 )103.6247619047620.806233643152755128.529444020148
Trimmed Mean ( 16 / 24 )103.6350.790047061240252131.175730009436
Trimmed Mean ( 17 / 24 )103.5997368421050.780906072458874132.666066375814
Trimmed Mean ( 18 / 24 )103.54250.774325551382498133.719596124825
Trimmed Mean ( 19 / 24 )103.4702941176470.765415489011632135.181866062387
Trimmed Mean ( 20 / 24 )103.38906250.752191872315314137.450385074967
Trimmed Mean ( 21 / 24 )103.2913333333330.737616343183773140.03395435559
Trimmed Mean ( 22 / 24 )103.2110714285710.727136577945051141.941795474317
Trimmed Mean ( 23 / 24 )103.190.732808296896262140.814453707813
Trimmed Mean ( 24 / 24 )103.1991666666670.745407416238647138.446659395225
Median102.365
Midrange104.98
Midmean - Weighted Average at Xnp103.381081081081
Midmean - Weighted Average at X(n+1)p103.5425
Midmean - Empirical Distribution Function103.381081081081
Midmean - Empirical Distribution Function - Averaging103.5425
Midmean - Empirical Distribution Function - Interpolation103.5425
Midmean - Closest Observation103.381081081081
Midmean - True Basic - Statistics Graphics Toolkit103.5425
Midmean - MS Excel (old versions)103.599736842105
Number of observations72


Parameters (Session):
Parameters (R input):
R code (references can be found in the software module):
geomean <- function(x) {
return(exp(mean(log(x))))
}
harmean <- function(x) {
return(1/mean(1/x))
}
quamean <- function(x) {
return(sqrt(mean(x*x)))
}
winmean <- function(x) {
x <-sort(x[!is.na(x)])
n<-length(x)
denom <- 3
nodenom <- n/denom
if (nodenom>40) denom <- n/40
sqrtn = sqrt(n)
roundnodenom = floor(nodenom)
win <- array(NA,dim=c(roundnodenom,2))
for (j in 1:roundnodenom) {
win[j,1] <- (j*x[j+1]+sum(x[(j+1):(n-j)])+j*x[n-j])/n
win[j,2] <- sd(c(rep(x[j+1],j),x[(j+1):(n-j)],rep(x[n-j],j)))/sqrtn
}
return(win)
}
trimean <- function(x) {
x <-sort(x[!is.na(x)])
n<-length(x)
denom <- 3
nodenom <- n/denom
if (nodenom>40) denom <- n/40
sqrtn = sqrt(n)
roundnodenom = floor(nodenom)
tri <- array(NA,dim=c(roundnodenom,2))
for (j in 1:roundnodenom) {
tri[j,1] <- mean(x,trim=j/n)
tri[j,2] <- sd(x[(j+1):(n-j)]) / sqrt(n-j*2)
}
return(tri)
}
midrange <- function(x) {
return((max(x)+min(x))/2)
}
q1 <- function(data,n,p,i,f) {
np <- n*p;
i <<- floor(np)
f <<- np - i
qvalue <- (1-f)*data[i] + f*data[i+1]
}
q2 <- function(data,n,p,i,f) {
np <- (n+1)*p
i <<- floor(np)
f <<- np - i
qvalue <- (1-f)*data[i] + f*data[i+1]
}
q3 <- function(data,n,p,i,f) {
np <- n*p
i <<- floor(np)
f <<- np - i
if (f==0) {
qvalue <- data[i]
} else {
qvalue <- data[i+1]
}
}
q4 <- function(data,n,p,i,f) {
np <- n*p
i <<- floor(np)
f <<- np - i
if (f==0) {
qvalue <- (data[i]+data[i+1])/2
} else {
qvalue <- data[i+1]
}
}
q5 <- function(data,n,p,i,f) {
np <- (n-1)*p
i <<- floor(np)
f <<- np - i
if (f==0) {
qvalue <- data[i+1]
} else {
qvalue <- data[i+1] + f*(data[i+2]-data[i+1])
}
}
q6 <- function(data,n,p,i,f) {
np <- n*p+0.5
i <<- floor(np)
f <<- np - i
qvalue <- data[i]
}
q7 <- function(data,n,p,i,f) {
np <- (n+1)*p
i <<- floor(np)
f <<- np - i
if (f==0) {
qvalue <- data[i]
} else {
qvalue <- f*data[i] + (1-f)*data[i+1]
}
}
q8 <- function(data,n,p,i,f) {
np <- (n+1)*p
i <<- floor(np)
f <<- np - i
if (f==0) {
qvalue <- data[i]
} else {
if (f == 0.5) {
qvalue <- (data[i]+data[i+1])/2
} else {
if (f < 0.5) {
qvalue <- data[i]
} else {
qvalue <- data[i+1]
}
}
}
}
midmean <- function(x,def) {
x <-sort(x[!is.na(x)])
n<-length(x)
if (def==1) {
qvalue1 <- q1(x,n,0.25,i,f)
qvalue3 <- q1(x,n,0.75,i,f)
}
if (def==2) {
qvalue1 <- q2(x,n,0.25,i,f)
qvalue3 <- q2(x,n,0.75,i,f)
}
if (def==3) {
qvalue1 <- q3(x,n,0.25,i,f)
qvalue3 <- q3(x,n,0.75,i,f)
}
if (def==4) {
qvalue1 <- q4(x,n,0.25,i,f)
qvalue3 <- q4(x,n,0.75,i,f)
}
if (def==5) {
qvalue1 <- q5(x,n,0.25,i,f)
qvalue3 <- q5(x,n,0.75,i,f)
}
if (def==6) {
qvalue1 <- q6(x,n,0.25,i,f)
qvalue3 <- q6(x,n,0.75,i,f)
}
if (def==7) {
qvalue1 <- q7(x,n,0.25,i,f)
qvalue3 <- q7(x,n,0.75,i,f)
}
if (def==8) {
qvalue1 <- q8(x,n,0.25,i,f)
qvalue3 <- q8(x,n,0.75,i,f)
}
midm <- 0
myn <- 0
roundno4 <- round(n/4)
round3no4 <- round(3*n/4)
for (i in 1:n) {
if ((x[i]>=qvalue1) & (x[i]<=qvalue3)){
midm = midm + x[i]
myn = myn + 1
}
}
midm = midm / myn
return(midm)
}
(arm <- mean(x))
sqrtn <- sqrt(length(x))
(armse <- sd(x) / sqrtn)
(armose <- arm / armse)
(geo <- geomean(x))
(har <- harmean(x))
(qua <- quamean(x))
(win <- winmean(x))
(tri <- trimean(x))
(midr <- midrange(x))
midm <- array(NA,dim=8)
for (j in 1:8) midm[j] <- midmean(x,j)
midm
bitmap(file='test1.png')
lb <- win[,1] - 2*win[,2]
ub <- win[,1] + 2*win[,2]
if ((ylimmin == '') | (ylimmax == '')) plot(win[,1],type='b',main=main, xlab='j', pch=19, ylab='Winsorized Mean(j/n)', ylim=c(min(lb),max(ub))) else plot(win[,1],type='l',main=main, xlab='j', pch=19, ylab='Winsorized Mean(j/n)', ylim=c(ylimmin,ylimmax))
lines(ub,lty=3)
lines(lb,lty=3)
grid()
dev.off()
bitmap(file='test2.png')
lb <- tri[,1] - 2*tri[,2]
ub <- tri[,1] + 2*tri[,2]
if ((ylimmin == '') | (ylimmax == '')) plot(tri[,1],type='b',main=main, xlab='j', pch=19, ylab='Trimmed Mean(j/n)', ylim=c(min(lb),max(ub))) else plot(tri[,1],type='l',main=main, xlab='j', pch=19, ylab='Trimmed Mean(j/n)', ylim=c(ylimmin,ylimmax))
lines(ub,lty=3)
lines(lb,lty=3)
grid()
dev.off()
load(file='createtable')
a<-table.start()
a<-table.row.start(a)
a<-table.element(a,'Central Tendency - Ungrouped Data',4,TRUE)
a<-table.row.end(a)
a<-table.row.start(a)
a<-table.element(a,'Measure',header=TRUE)
a<-table.element(a,'Value',header=TRUE)
a<-table.element(a,'S.E.',header=TRUE)
a<-table.element(a,'Value/S.E.',header=TRUE)
a<-table.row.end(a)
a<-table.row.start(a)
a<-table.element(a,hyperlink('arithmetic_mean.htm', 'Arithmetic Mean', 'click to view the definition of the Arithmetic Mean'),header=TRUE)
a<-table.element(a,arm)
a<-table.element(a,hyperlink('arithmetic_mean_standard_error.htm', armse, 'click to view the definition of the Standard Error of the Arithmetic Mean'))
a<-table.element(a,armose)
a<-table.row.end(a)
a<-table.row.start(a)
a<-table.element(a,hyperlink('geometric_mean.htm', 'Geometric Mean', 'click to view the definition of the Geometric Mean'),header=TRUE)
a<-table.element(a,geo)
a<-table.element(a,'')
a<-table.row.end(a)
a<-table.row.start(a)
a<-table.element(a,hyperlink('harmonic_mean.htm', 'Harmonic Mean', 'click to view the definition of the Harmonic Mean'),header=TRUE)
a<-table.element(a,har)
a<-table.element(a,'')
a<-table.row.end(a)
a<-table.row.start(a)
a<-table.element(a,hyperlink('quadratic_mean.htm', 'Quadratic Mean', 'click to view the definition of the Quadratic Mean'),header=TRUE)
a<-table.element(a,qua)
a<-table.element(a,'')
a<-table.row.end(a)
for (j in 1:length(win[,1])) {
a<-table.row.start(a)
mylabel <- paste('Winsorized Mean (',j)
mylabel <- paste(mylabel,'/')
mylabel <- paste(mylabel,length(win[,1]))
mylabel <- paste(mylabel,')')
a<-table.element(a,hyperlink('winsorized_mean.htm', mylabel, 'click to view the definition of the Winsorized Mean'),header=TRUE)
a<-table.element(a,win[j,1])
a<-table.element(a,win[j,2])
a<-table.element(a,win[j,1]/win[j,2])
a<-table.row.end(a)
}
for (j in 1:length(tri[,1])) {
a<-table.row.start(a)
mylabel <- paste('Trimmed Mean (',j)
mylabel <- paste(mylabel,'/')
mylabel <- paste(mylabel,length(tri[,1]))
mylabel <- paste(mylabel,')')
a<-table.element(a,hyperlink('arithmetic_mean.htm', mylabel, 'click to view the definition of the Trimmed Mean'),header=TRUE)
a<-table.element(a,tri[j,1])
a<-table.element(a,tri[j,2])
a<-table.element(a,tri[j,1]/tri[j,2])
a<-table.row.end(a)
}
a<-table.row.start(a)
a<-table.element(a,hyperlink('median_1.htm', 'Median', 'click to view the definition of the Median'),header=TRUE)
a<-table.element(a,median(x))
a<-table.element(a,'')
a<-table.row.end(a)
a<-table.row.start(a)
a<-table.element(a,hyperlink('midrange.htm', 'Midrange', 'click to view the definition of the Midrange'),header=TRUE)
a<-table.element(a,midr)
a<-table.element(a,'')
a<-table.row.end(a)
a<-table.row.start(a)
mymid <- hyperlink('midmean.htm', 'Midmean', 'click to view the definition of the Midmean')
mylabel <- paste(mymid,hyperlink('method_1.htm','Weighted Average at Xnp',''),sep=' - ')
a<-table.element(a,mylabel,header=TRUE)
a<-table.element(a,midm[1])
a<-table.element(a,'')
a<-table.row.end(a)
a<-table.row.start(a)
mymid <- hyperlink('midmean.htm', 'Midmean', 'click to view the definition of the Midmean')
mylabel <- paste(mymid,hyperlink('method_2.htm','Weighted Average at X(n+1)p',''),sep=' - ')
a<-table.element(a,mylabel,header=TRUE)
a<-table.element(a,midm[2])
a<-table.element(a,'')
a<-table.row.end(a)
a<-table.row.start(a)
mymid <- hyperlink('midmean.htm', 'Midmean', 'click to view the definition of the Midmean')
mylabel <- paste(mymid,hyperlink('method_3.htm','Empirical Distribution Function',''),sep=' - ')
a<-table.element(a,mylabel,header=TRUE)
a<-table.element(a,midm[3])
a<-table.element(a,'')
a<-table.row.end(a)
a<-table.row.start(a)
mymid <- hyperlink('midmean.htm', 'Midmean', 'click to view the definition of the Midmean')
mylabel <- paste(mymid,hyperlink('method_4.htm','Empirical Distribution Function - Averaging',''),sep=' - ')
a<-table.element(a,mylabel,header=TRUE)
a<-table.element(a,midm[4])
a<-table.element(a,'')
a<-table.row.end(a)
a<-table.row.start(a)
mymid <- hyperlink('midmean.htm', 'Midmean', 'click to view the definition of the Midmean')
mylabel <- paste(mymid,hyperlink('method_5.htm','Empirical Distribution Function - Interpolation',''),sep=' - ')
a<-table.element(a,mylabel,header=TRUE)
a<-table.element(a,midm[5])
a<-table.element(a,'')
a<-table.row.end(a)
a<-table.row.start(a)
mymid <- hyperlink('midmean.htm', 'Midmean', 'click to view the definition of the Midmean')
mylabel <- paste(mymid,hyperlink('method_6.htm','Closest Observation',''),sep=' - ')
a<-table.element(a,mylabel,header=TRUE)
a<-table.element(a,midm[6])
a<-table.element(a,'')
a<-table.row.end(a)
a<-table.row.start(a)
mymid <- hyperlink('midmean.htm', 'Midmean', 'click to view the definition of the Midmean')
mylabel <- paste(mymid,hyperlink('method_7.htm','True Basic - Statistics Graphics Toolkit',''),sep=' - ')
a<-table.element(a,mylabel,header=TRUE)
a<-table.element(a,midm[7])
a<-table.element(a,'')
a<-table.row.end(a)
a<-table.row.start(a)
mymid <- hyperlink('midmean.htm', 'Midmean', 'click to view the definition of the Midmean')
mylabel <- paste(mymid,hyperlink('method_8.htm','MS Excel (old versions)',''),sep=' - ')
a<-table.element(a,mylabel,header=TRUE)
a<-table.element(a,midm[8])
a<-table.element(a,'')
a<-table.row.end(a)
a<-table.row.start(a)
a<-table.element(a,'Number of observations',header=TRUE)
a<-table.element(a,length(x))
a<-table.element(a,'')
a<-table.row.end(a)
a<-table.end(a)
table.save(a,file='mytable.tab')