Free Statistics
of Irreproducible Research!
Description of Statistical Computation | |||||||||||||||||||||
|---|---|---|---|---|---|---|---|---|---|---|---|---|---|---|---|---|---|---|---|---|---|
| Author's title | |||||||||||||||||||||
| Author | *Unverified author* | ||||||||||||||||||||
| R Software Module | rwasp_meanplot.wasp | ||||||||||||||||||||
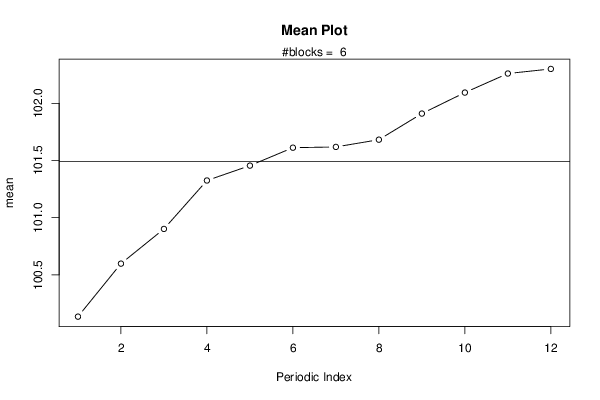
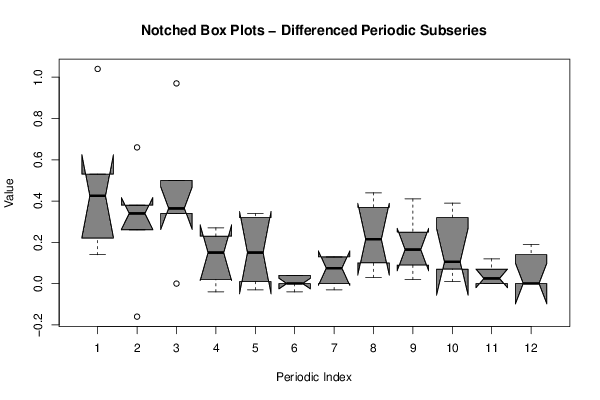
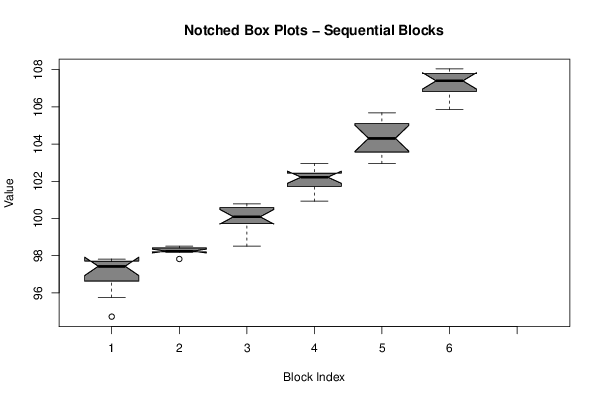
| Title produced by software | Mean Plot | ||||||||||||||||||||
| Date of computation | Tue, 14 Mar 2017 19:28:43 +0000 | ||||||||||||||||||||
| Cite this page as follows | Statistical Computations at FreeStatistics.org, Office for Research Development and Education, URL https://freestatistics.org/blog/index.php?v=date/2017/Mar/14/t1489519874bs3ep7wsnt050c1.htm/, Retrieved Tue, 14 May 2024 17:32:15 +0200 | ||||||||||||||||||||
| Statistical Computations at FreeStatistics.org, Office for Research Development and Education, URL https://freestatistics.org/blog/index.php?pk=, Retrieved Tue, 14 May 2024 17:32:15 +0200 | |||||||||||||||||||||
| QR Codes: | |||||||||||||||||||||
|
| |||||||||||||||||||||
| Original text written by user: | |||||||||||||||||||||
| IsPrivate? | No (this computation is public) | ||||||||||||||||||||
| User-defined keywords | |||||||||||||||||||||
| Estimated Impact | 0 | ||||||||||||||||||||
Tree of Dependent Computations | |||||||||||||||||||||
Dataset | |||||||||||||||||||||
| Dataseries X: | |||||||||||||||||||||
94,72 95,76 96,14 97,11 97,19 97,43 97,43 97,56 97,66 97,75 97,82 97,82 97,82 98,35 98,19 98,19 98,21 98,22 98,26 98,23 98,26 98,5 98,51 98,51 98,51 98,89 99,55 99,9 100,12 100,09 100,09 100,09 100,46 100,71 100,79 100,79 100,93 101,15 101,53 101,91 102,18 102,24 102,2 102,32 102,43 102,45 102,84 102,96 102,96 103,1 103,4 103,74 103,97 104,29 104,33 104,46 104,9 105,31 105,63 105,68 105,87 106,34 106,6 107,1 107,06 107,4 107,4 107,43 107,75 107,84 107,97 108,04 | |||||||||||||||||||||
Tables (Output of Computation) | |||||||||||||||||||||
| |||||||||||||||||||||
Figures (Output of Computation) | |||||||||||||||||||||
Input Parameters & R Code | |||||||||||||||||||||
| Parameters (Session): | |||||||||||||||||||||
| par1 = 12 ; | |||||||||||||||||||||
| Parameters (R input): | |||||||||||||||||||||
| par1 = 12 ; | |||||||||||||||||||||
| R code (references can be found in the software module): | |||||||||||||||||||||
par1 <- as.numeric(par1) | |||||||||||||||||||||