Free Statistics

of Irreproducible Research!

Author's title

Author*Unverified author*
R Software Modulerwasp_centraltendency.wasp
Title produced by softwareCentral Tendency
Date of computationTue, 14 Mar 2017 20:00:28 +0000
Cite this page as followsStatistical Computations at FreeStatistics.org, Office for Research Development and Education, URL https://freestatistics.org/blog/index.php?v=date/2017/Mar/14/t1489521862q8upfovqludcf8g.htm/, Retrieved Tue, 14 May 2024 00:51:40 +0200
Statistical Computations at FreeStatistics.org, Office for Research Development and Education, URL https://freestatistics.org/blog/index.php?pk=, Retrieved Tue, 14 May 2024 00:51:40 +0200
QR Codes:

Original text written by user:
IsPrivate?No (this computation is public)
User-defined keywords
Estimated Impact0
Dataseries X:
584302	
221901
252972
109429
306752	
119246	
129566	
57940	
277550	
102655	
123406	
51489	
118487	
49140	
54874	
14472	
65112	
28389	
29148
7575	
53375	
20751	
25726	
6897	
333776	
119850	
140239	
73686	
173658	
63922	
71367	
38369	
160117	
55928	
68872	
35318	
132040	
52910	
57858	
21271	
67982	
26934	
29051	
11997	
64058	
25976	
28807	
9274	


Summary of computational transaction
Raw Inputview raw input (R code)
Raw Outputview raw output of R engine
Computing time1 seconds
R Server'George Udny Yule' @ yule.wessa.net
R Framework error message
Warning: there are blank lines in the 'Data' field.
Please, use NA for missing data - blank lines are simply
 deleted and are NOT treated as missing values.

\begin{tabular}{lllllllll}
\hline
Summary of computational transaction \tabularnewline
Raw Input & view raw input (R code)  \tabularnewline
Raw Output & view raw output of R engine  \tabularnewline
Computing time & 1 seconds \tabularnewline
R Server & 'George Udny Yule' @ yule.wessa.net \tabularnewline
R Framework error message & 
Warning: there are blank lines in the 'Data' field.
Please, use NA for missing data - blank lines are simply
 deleted and are NOT treated as missing values.
\tabularnewline \hline \end{tabular} %Source: https://freestatistics.org/blog/index.php?pk=&T=0

[TABLE]
[ROW][C]Summary of computational transaction[/C][/ROW]
[ROW][C]Raw Input[/C][C]view raw input (R code) [/C][/ROW]
[ROW][C]Raw Output[/C][C]view raw output of R engine [/C][/ROW]
[ROW][C]Computing time[/C][C]1 seconds[/C][/ROW]
[ROW][C]R Server[/C][C]'George Udny Yule' @ yule.wessa.net[/C][/ROW]
[ROW][C]R Framework error message[/C][C]
Warning: there are blank lines in the 'Data' field.
Please, use NA for missing data - blank lines are simply
 deleted and are NOT treated as missing values.
[/C][/ROW] [/TABLE] Source: https://freestatistics.org/blog/index.php?pk=&T=0

Globally Unique Identifier (entire table): ba.freestatistics.org/blog/index.php?pk=&T=0

As an alternative you can also use a QR Code:  

The GUIDs for individual cells are displayed in the table below:

Summary of computational transaction
Raw Inputview raw input (R code)
Raw Outputview raw output of R engine
Computing time1 seconds
R Server'George Udny Yule' @ yule.wessa.net
R Framework error message
Warning: there are blank lines in the 'Data' field.
Please, use NA for missing data - blank lines are simply
 deleted and are NOT treated as missing values.


Central Tendency - Ungrouped Data
MeasureValueS.E.Value/S.E.
Arithmetic Mean97383.62515434.46706048376.30949061074662
Geometric Mean60852.0106633999
Harmonic Mean36976.6214906256
Quadratic Mean143805.565851517
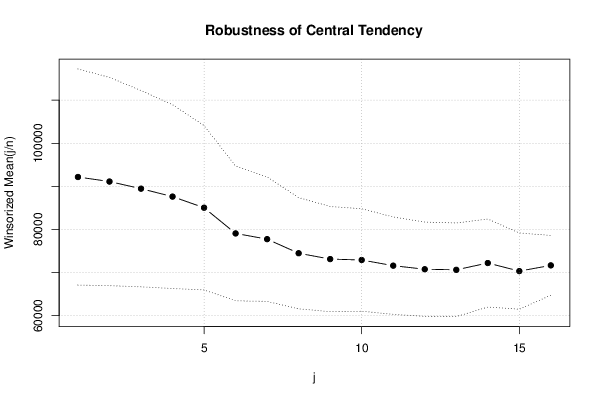
Winsorized Mean ( 1 / 16 )92178.458333333312540.70831028787.35033907596068
Winsorized Mean ( 2 / 16 )91123.2512085.72208632827.53974395150803
Winsorized Mean ( 3 / 16 )89468.312511393.45043461337.85260909444916
Winsorized Mean ( 4 / 16 )87626.395833333310665.2736861838.21604755880334
Winsorized Mean ( 5 / 16 )85043.89583333339540.687650023918.913811975924
Winsorized Mean ( 6 / 16 )79078.52083333337820.5620491791810.1116160623817
Winsorized Mean ( 7 / 16 )77753.47916666677225.550168934210.7609077992376
Winsorized Mean ( 8 / 16 )74482.14583333336455.8918052332111.5370808682013
Winsorized Mean ( 9 / 16 )73124.45833333336102.3557066247611.982988512772
Winsorized Mean ( 10 / 16 )72912.16666666675948.6402404584812.2569467507497
Winsorized Mean ( 11 / 16 )71596.29166666675652.487498296912.6663334838403
Winsorized Mean ( 12 / 16 )70768.29166666675471.0680628365412.9350048023303
Winsorized Mean ( 13 / 16 )70630.97916666675435.6276098391212.9940798443985
Winsorized Mean ( 14 / 16 )72209.18755108.6420063964114.1347127885627
Winsorized Mean ( 15 / 16 )703324422.6309802236515.9027511710786
Winsorized Mean ( 16 / 16 )71664.33333333333468.4554308294220.6617426005662
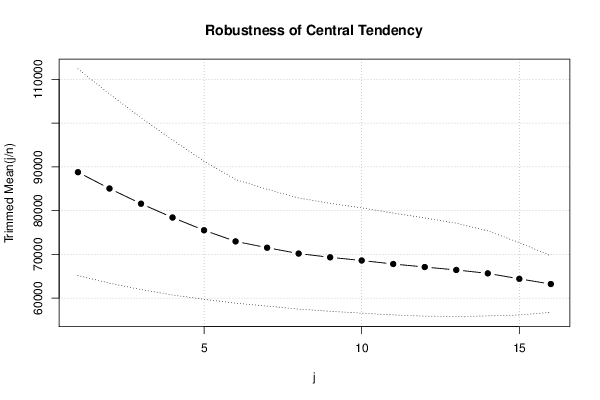
Trimmed Mean ( 1 / 16 )88765.543478260911810.43431499857.51585768234907
Trimmed Mean ( 2 / 16 )85042.363636363610820.09336318527.85967003997539
Trimmed Mean ( 3 / 16 )81567.57142857149821.333058118618.30514258562336
Trimmed Mean ( 4 / 16 )78407.2758859.769500314448.84980980568595
Trimmed Mean ( 5 / 16 )75495.97368421057891.979023464859.56616502144037
Trimmed Mean ( 6 / 16 )72949.86111111117065.7650694114910.3244107884254
Trimmed Mean ( 7 / 16 )71507.82352941186677.0424645888410.7095055795508
Trimmed Mean ( 8 / 16 )70169.468756351.3658743396711.0479336473897
Trimmed Mean ( 9 / 16 )69306.93333333336171.1237796121911.2308447875095
Trimmed Mean ( 10 / 16 )68579.78571428576018.7428613103611.3943704349175
Trimmed Mean ( 11 / 16 )67779.96153846155822.3773284909511.6412863190419
Trimmed Mean ( 12 / 16 )67086.08333333335616.0915686039611.9453328910037
Trimmed Mean ( 13 / 16 )66416.59090909095339.1043194143612.4396503487641
Trimmed Mean ( 14 / 16 )65638.554860.6331764682913.5041151259418
Trimmed Mean ( 15 / 16 )643874137.0704326498815.5634285294869
Trimmed Mean ( 16 / 16 )631983233.2646143900219.546188616524
Median60931
Midrange295599.5
Midmean - Weighted Average at Xnp65554.92
Midmean - Weighted Average at X(n+1)p67086.0833333333
Midmean - Empirical Distribution Function65554.92
Midmean - Empirical Distribution Function - Averaging67086.0833333333
Midmean - Empirical Distribution Function - Interpolation67086.0833333333
Midmean - Closest Observation65554.92
Midmean - True Basic - Statistics Graphics Toolkit67086.0833333333
Midmean - MS Excel (old versions)67779.9615384615
Number of observations48

\begin{tabular}{lllllllll}
\hline
Central Tendency - Ungrouped Data \tabularnewline
Measure & Value & S.E. & Value/S.E. \tabularnewline
Arithmetic Mean & 97383.625 & 15434.4670604837 & 6.30949061074662 \tabularnewline
Geometric Mean & 60852.0106633999 &  &  \tabularnewline
Harmonic Mean & 36976.6214906256 &  &  \tabularnewline
Quadratic Mean & 143805.565851517 &  &  \tabularnewline
Winsorized Mean ( 1 / 16 ) & 92178.4583333333 & 12540.7083102878 & 7.35033907596068 \tabularnewline
Winsorized Mean ( 2 / 16 ) & 91123.25 & 12085.7220863282 & 7.53974395150803 \tabularnewline
Winsorized Mean ( 3 / 16 ) & 89468.3125 & 11393.4504346133 & 7.85260909444916 \tabularnewline
Winsorized Mean ( 4 / 16 ) & 87626.3958333333 & 10665.273686183 & 8.21604755880334 \tabularnewline
Winsorized Mean ( 5 / 16 ) & 85043.8958333333 & 9540.68765002391 & 8.913811975924 \tabularnewline
Winsorized Mean ( 6 / 16 ) & 79078.5208333333 & 7820.56204917918 & 10.1116160623817 \tabularnewline
Winsorized Mean ( 7 / 16 ) & 77753.4791666667 & 7225.5501689342 & 10.7609077992376 \tabularnewline
Winsorized Mean ( 8 / 16 ) & 74482.1458333333 & 6455.89180523321 & 11.5370808682013 \tabularnewline
Winsorized Mean ( 9 / 16 ) & 73124.4583333333 & 6102.35570662476 & 11.982988512772 \tabularnewline
Winsorized Mean ( 10 / 16 ) & 72912.1666666667 & 5948.64024045848 & 12.2569467507497 \tabularnewline
Winsorized Mean ( 11 / 16 ) & 71596.2916666667 & 5652.4874982969 & 12.6663334838403 \tabularnewline
Winsorized Mean ( 12 / 16 ) & 70768.2916666667 & 5471.06806283654 & 12.9350048023303 \tabularnewline
Winsorized Mean ( 13 / 16 ) & 70630.9791666667 & 5435.62760983912 & 12.9940798443985 \tabularnewline
Winsorized Mean ( 14 / 16 ) & 72209.1875 & 5108.64200639641 & 14.1347127885627 \tabularnewline
Winsorized Mean ( 15 / 16 ) & 70332 & 4422.63098022365 & 15.9027511710786 \tabularnewline
Winsorized Mean ( 16 / 16 ) & 71664.3333333333 & 3468.45543082942 & 20.6617426005662 \tabularnewline
Trimmed Mean ( 1 / 16 ) & 88765.5434782609 & 11810.4343149985 & 7.51585768234907 \tabularnewline
Trimmed Mean ( 2 / 16 ) & 85042.3636363636 & 10820.0933631852 & 7.85967003997539 \tabularnewline
Trimmed Mean ( 3 / 16 ) & 81567.5714285714 & 9821.33305811861 & 8.30514258562336 \tabularnewline
Trimmed Mean ( 4 / 16 ) & 78407.275 & 8859.76950031444 & 8.84980980568595 \tabularnewline
Trimmed Mean ( 5 / 16 ) & 75495.9736842105 & 7891.97902346485 & 9.56616502144037 \tabularnewline
Trimmed Mean ( 6 / 16 ) & 72949.8611111111 & 7065.76506941149 & 10.3244107884254 \tabularnewline
Trimmed Mean ( 7 / 16 ) & 71507.8235294118 & 6677.04246458884 & 10.7095055795508 \tabularnewline
Trimmed Mean ( 8 / 16 ) & 70169.46875 & 6351.36587433967 & 11.0479336473897 \tabularnewline
Trimmed Mean ( 9 / 16 ) & 69306.9333333333 & 6171.12377961219 & 11.2308447875095 \tabularnewline
Trimmed Mean ( 10 / 16 ) & 68579.7857142857 & 6018.74286131036 & 11.3943704349175 \tabularnewline
Trimmed Mean ( 11 / 16 ) & 67779.9615384615 & 5822.37732849095 & 11.6412863190419 \tabularnewline
Trimmed Mean ( 12 / 16 ) & 67086.0833333333 & 5616.09156860396 & 11.9453328910037 \tabularnewline
Trimmed Mean ( 13 / 16 ) & 66416.5909090909 & 5339.10431941436 & 12.4396503487641 \tabularnewline
Trimmed Mean ( 14 / 16 ) & 65638.55 & 4860.63317646829 & 13.5041151259418 \tabularnewline
Trimmed Mean ( 15 / 16 ) & 64387 & 4137.07043264988 & 15.5634285294869 \tabularnewline
Trimmed Mean ( 16 / 16 ) & 63198 & 3233.26461439002 & 19.546188616524 \tabularnewline
Median & 60931 &  &  \tabularnewline
Midrange & 295599.5 &  &  \tabularnewline
Midmean - Weighted Average at Xnp & 65554.92 &  &  \tabularnewline
Midmean - Weighted Average at X(n+1)p & 67086.0833333333 &  &  \tabularnewline
Midmean - Empirical Distribution Function & 65554.92 &  &  \tabularnewline
Midmean - Empirical Distribution Function - Averaging & 67086.0833333333 &  &  \tabularnewline
Midmean - Empirical Distribution Function - Interpolation & 67086.0833333333 &  &  \tabularnewline
Midmean - Closest Observation & 65554.92 &  &  \tabularnewline
Midmean - True Basic - Statistics Graphics Toolkit & 67086.0833333333 &  &  \tabularnewline
Midmean - MS Excel (old versions) & 67779.9615384615 &  &  \tabularnewline
Number of observations & 48 &  &  \tabularnewline
\hline
\end{tabular}
%Source: https://freestatistics.org/blog/index.php?pk=&T=1

[TABLE]
[ROW][C]Central Tendency - Ungrouped Data[/C][/ROW]
[ROW][C]Measure[/C][C]Value[/C][C]S.E.[/C][C]Value/S.E.[/C][/ROW]
[ROW][C]Arithmetic Mean[/C][C]97383.625[/C][C]15434.4670604837[/C][C]6.30949061074662[/C][/ROW]
[ROW][C]Geometric Mean[/C][C]60852.0106633999[/C][C][/C][C][/C][/ROW]
[ROW][C]Harmonic Mean[/C][C]36976.6214906256[/C][C][/C][C][/C][/ROW]
[ROW][C]Quadratic Mean[/C][C]143805.565851517[/C][C][/C][C][/C][/ROW]
[ROW][C]Winsorized Mean ( 1 / 16 )[/C][C]92178.4583333333[/C][C]12540.7083102878[/C][C]7.35033907596068[/C][/ROW]
[ROW][C]Winsorized Mean ( 2 / 16 )[/C][C]91123.25[/C][C]12085.7220863282[/C][C]7.53974395150803[/C][/ROW]
[ROW][C]Winsorized Mean ( 3 / 16 )[/C][C]89468.3125[/C][C]11393.4504346133[/C][C]7.85260909444916[/C][/ROW]
[ROW][C]Winsorized Mean ( 4 / 16 )[/C][C]87626.3958333333[/C][C]10665.273686183[/C][C]8.21604755880334[/C][/ROW]
[ROW][C]Winsorized Mean ( 5 / 16 )[/C][C]85043.8958333333[/C][C]9540.68765002391[/C][C]8.913811975924[/C][/ROW]
[ROW][C]Winsorized Mean ( 6 / 16 )[/C][C]79078.5208333333[/C][C]7820.56204917918[/C][C]10.1116160623817[/C][/ROW]
[ROW][C]Winsorized Mean ( 7 / 16 )[/C][C]77753.4791666667[/C][C]7225.5501689342[/C][C]10.7609077992376[/C][/ROW]
[ROW][C]Winsorized Mean ( 8 / 16 )[/C][C]74482.1458333333[/C][C]6455.89180523321[/C][C]11.5370808682013[/C][/ROW]
[ROW][C]Winsorized Mean ( 9 / 16 )[/C][C]73124.4583333333[/C][C]6102.35570662476[/C][C]11.982988512772[/C][/ROW]
[ROW][C]Winsorized Mean ( 10 / 16 )[/C][C]72912.1666666667[/C][C]5948.64024045848[/C][C]12.2569467507497[/C][/ROW]
[ROW][C]Winsorized Mean ( 11 / 16 )[/C][C]71596.2916666667[/C][C]5652.4874982969[/C][C]12.6663334838403[/C][/ROW]
[ROW][C]Winsorized Mean ( 12 / 16 )[/C][C]70768.2916666667[/C][C]5471.06806283654[/C][C]12.9350048023303[/C][/ROW]
[ROW][C]Winsorized Mean ( 13 / 16 )[/C][C]70630.9791666667[/C][C]5435.62760983912[/C][C]12.9940798443985[/C][/ROW]
[ROW][C]Winsorized Mean ( 14 / 16 )[/C][C]72209.1875[/C][C]5108.64200639641[/C][C]14.1347127885627[/C][/ROW]
[ROW][C]Winsorized Mean ( 15 / 16 )[/C][C]70332[/C][C]4422.63098022365[/C][C]15.9027511710786[/C][/ROW]
[ROW][C]Winsorized Mean ( 16 / 16 )[/C][C]71664.3333333333[/C][C]3468.45543082942[/C][C]20.6617426005662[/C][/ROW]
[ROW][C]Trimmed Mean ( 1 / 16 )[/C][C]88765.5434782609[/C][C]11810.4343149985[/C][C]7.51585768234907[/C][/ROW]
[ROW][C]Trimmed Mean ( 2 / 16 )[/C][C]85042.3636363636[/C][C]10820.0933631852[/C][C]7.85967003997539[/C][/ROW]
[ROW][C]Trimmed Mean ( 3 / 16 )[/C][C]81567.5714285714[/C][C]9821.33305811861[/C][C]8.30514258562336[/C][/ROW]
[ROW][C]Trimmed Mean ( 4 / 16 )[/C][C]78407.275[/C][C]8859.76950031444[/C][C]8.84980980568595[/C][/ROW]
[ROW][C]Trimmed Mean ( 5 / 16 )[/C][C]75495.9736842105[/C][C]7891.97902346485[/C][C]9.56616502144037[/C][/ROW]
[ROW][C]Trimmed Mean ( 6 / 16 )[/C][C]72949.8611111111[/C][C]7065.76506941149[/C][C]10.3244107884254[/C][/ROW]
[ROW][C]Trimmed Mean ( 7 / 16 )[/C][C]71507.8235294118[/C][C]6677.04246458884[/C][C]10.7095055795508[/C][/ROW]
[ROW][C]Trimmed Mean ( 8 / 16 )[/C][C]70169.46875[/C][C]6351.36587433967[/C][C]11.0479336473897[/C][/ROW]
[ROW][C]Trimmed Mean ( 9 / 16 )[/C][C]69306.9333333333[/C][C]6171.12377961219[/C][C]11.2308447875095[/C][/ROW]
[ROW][C]Trimmed Mean ( 10 / 16 )[/C][C]68579.7857142857[/C][C]6018.74286131036[/C][C]11.3943704349175[/C][/ROW]
[ROW][C]Trimmed Mean ( 11 / 16 )[/C][C]67779.9615384615[/C][C]5822.37732849095[/C][C]11.6412863190419[/C][/ROW]
[ROW][C]Trimmed Mean ( 12 / 16 )[/C][C]67086.0833333333[/C][C]5616.09156860396[/C][C]11.9453328910037[/C][/ROW]
[ROW][C]Trimmed Mean ( 13 / 16 )[/C][C]66416.5909090909[/C][C]5339.10431941436[/C][C]12.4396503487641[/C][/ROW]
[ROW][C]Trimmed Mean ( 14 / 16 )[/C][C]65638.55[/C][C]4860.63317646829[/C][C]13.5041151259418[/C][/ROW]
[ROW][C]Trimmed Mean ( 15 / 16 )[/C][C]64387[/C][C]4137.07043264988[/C][C]15.5634285294869[/C][/ROW]
[ROW][C]Trimmed Mean ( 16 / 16 )[/C][C]63198[/C][C]3233.26461439002[/C][C]19.546188616524[/C][/ROW]
[ROW][C]Median[/C][C]60931[/C][C][/C][C][/C][/ROW]
[ROW][C]Midrange[/C][C]295599.5[/C][C][/C][C][/C][/ROW]
[ROW][C]Midmean - Weighted Average at Xnp[/C][C]65554.92[/C][C][/C][C][/C][/ROW]
[ROW][C]Midmean - Weighted Average at X(n+1)p[/C][C]67086.0833333333[/C][C][/C][C][/C][/ROW]
[ROW][C]Midmean - Empirical Distribution Function[/C][C]65554.92[/C][C][/C][C][/C][/ROW]
[ROW][C]Midmean - Empirical Distribution Function - Averaging[/C][C]67086.0833333333[/C][C][/C][C][/C][/ROW]
[ROW][C]Midmean - Empirical Distribution Function - Interpolation[/C][C]67086.0833333333[/C][C][/C][C][/C][/ROW]
[ROW][C]Midmean - Closest Observation[/C][C]65554.92[/C][C][/C][C][/C][/ROW]
[ROW][C]Midmean - True Basic - Statistics Graphics Toolkit[/C][C]67086.0833333333[/C][C][/C][C][/C][/ROW]
[ROW][C]Midmean - MS Excel (old versions)[/C][C]67779.9615384615[/C][C][/C][C][/C][/ROW]
[ROW][C]Number of observations[/C][C]48[/C][C][/C][C][/C][/ROW]
[/TABLE]
Source: https://freestatistics.org/blog/index.php?pk=&T=1

Globally Unique Identifier (entire table): ba.freestatistics.org/blog/index.php?pk=&T=1

As an alternative you can also use a QR Code:  

The GUIDs for individual cells are displayed in the table below:

Central Tendency - Ungrouped Data
MeasureValueS.E.Value/S.E.
Arithmetic Mean97383.62515434.46706048376.30949061074662
Geometric Mean60852.0106633999
Harmonic Mean36976.6214906256
Quadratic Mean143805.565851517
Winsorized Mean ( 1 / 16 )92178.458333333312540.70831028787.35033907596068
Winsorized Mean ( 2 / 16 )91123.2512085.72208632827.53974395150803
Winsorized Mean ( 3 / 16 )89468.312511393.45043461337.85260909444916
Winsorized Mean ( 4 / 16 )87626.395833333310665.2736861838.21604755880334
Winsorized Mean ( 5 / 16 )85043.89583333339540.687650023918.913811975924
Winsorized Mean ( 6 / 16 )79078.52083333337820.5620491791810.1116160623817
Winsorized Mean ( 7 / 16 )77753.47916666677225.550168934210.7609077992376
Winsorized Mean ( 8 / 16 )74482.14583333336455.8918052332111.5370808682013
Winsorized Mean ( 9 / 16 )73124.45833333336102.3557066247611.982988512772
Winsorized Mean ( 10 / 16 )72912.16666666675948.6402404584812.2569467507497
Winsorized Mean ( 11 / 16 )71596.29166666675652.487498296912.6663334838403
Winsorized Mean ( 12 / 16 )70768.29166666675471.0680628365412.9350048023303
Winsorized Mean ( 13 / 16 )70630.97916666675435.6276098391212.9940798443985
Winsorized Mean ( 14 / 16 )72209.18755108.6420063964114.1347127885627
Winsorized Mean ( 15 / 16 )703324422.6309802236515.9027511710786
Winsorized Mean ( 16 / 16 )71664.33333333333468.4554308294220.6617426005662
Trimmed Mean ( 1 / 16 )88765.543478260911810.43431499857.51585768234907
Trimmed Mean ( 2 / 16 )85042.363636363610820.09336318527.85967003997539
Trimmed Mean ( 3 / 16 )81567.57142857149821.333058118618.30514258562336
Trimmed Mean ( 4 / 16 )78407.2758859.769500314448.84980980568595
Trimmed Mean ( 5 / 16 )75495.97368421057891.979023464859.56616502144037
Trimmed Mean ( 6 / 16 )72949.86111111117065.7650694114910.3244107884254
Trimmed Mean ( 7 / 16 )71507.82352941186677.0424645888410.7095055795508
Trimmed Mean ( 8 / 16 )70169.468756351.3658743396711.0479336473897
Trimmed Mean ( 9 / 16 )69306.93333333336171.1237796121911.2308447875095
Trimmed Mean ( 10 / 16 )68579.78571428576018.7428613103611.3943704349175
Trimmed Mean ( 11 / 16 )67779.96153846155822.3773284909511.6412863190419
Trimmed Mean ( 12 / 16 )67086.08333333335616.0915686039611.9453328910037
Trimmed Mean ( 13 / 16 )66416.59090909095339.1043194143612.4396503487641
Trimmed Mean ( 14 / 16 )65638.554860.6331764682913.5041151259418
Trimmed Mean ( 15 / 16 )643874137.0704326498815.5634285294869
Trimmed Mean ( 16 / 16 )631983233.2646143900219.546188616524
Median60931
Midrange295599.5
Midmean - Weighted Average at Xnp65554.92
Midmean - Weighted Average at X(n+1)p67086.0833333333
Midmean - Empirical Distribution Function65554.92
Midmean - Empirical Distribution Function - Averaging67086.0833333333
Midmean - Empirical Distribution Function - Interpolation67086.0833333333
Midmean - Closest Observation65554.92
Midmean - True Basic - Statistics Graphics Toolkit67086.0833333333
Midmean - MS Excel (old versions)67779.9615384615
Number of observations48


Parameters (Session):
Parameters (R input):
R code (references can be found in the software module):
geomean <- function(x) {
return(exp(mean(log(x))))
}
harmean <- function(x) {
return(1/mean(1/x))
}
quamean <- function(x) {
return(sqrt(mean(x*x)))
}
winmean <- function(x) {
x <-sort(x[!is.na(x)])
n<-length(x)
denom <- 3
nodenom <- n/denom
if (nodenom>40) denom <- n/40
sqrtn = sqrt(n)
roundnodenom = floor(nodenom)
win <- array(NA,dim=c(roundnodenom,2))
for (j in 1:roundnodenom) {
win[j,1] <- (j*x[j+1]+sum(x[(j+1):(n-j)])+j*x[n-j])/n
win[j,2] <- sd(c(rep(x[j+1],j),x[(j+1):(n-j)],rep(x[n-j],j)))/sqrtn
}
return(win)
}
trimean <- function(x) {
x <-sort(x[!is.na(x)])
n<-length(x)
denom <- 3
nodenom <- n/denom
if (nodenom>40) denom <- n/40
sqrtn = sqrt(n)
roundnodenom = floor(nodenom)
tri <- array(NA,dim=c(roundnodenom,2))
for (j in 1:roundnodenom) {
tri[j,1] <- mean(x,trim=j/n)
tri[j,2] <- sd(x[(j+1):(n-j)]) / sqrt(n-j*2)
}
return(tri)
}
midrange <- function(x) {
return((max(x)+min(x))/2)
}
q1 <- function(data,n,p,i,f) {
np <- n*p;
i <<- floor(np)
f <<- np - i
qvalue <- (1-f)*data[i] + f*data[i+1]
}
q2 <- function(data,n,p,i,f) {
np <- (n+1)*p
i <<- floor(np)
f <<- np - i
qvalue <- (1-f)*data[i] + f*data[i+1]
}
q3 <- function(data,n,p,i,f) {
np <- n*p
i <<- floor(np)
f <<- np - i
if (f==0) {
qvalue <- data[i]
} else {
qvalue <- data[i+1]
}
}
q4 <- function(data,n,p,i,f) {
np <- n*p
i <<- floor(np)
f <<- np - i
if (f==0) {
qvalue <- (data[i]+data[i+1])/2
} else {
qvalue <- data[i+1]
}
}
q5 <- function(data,n,p,i,f) {
np <- (n-1)*p
i <<- floor(np)
f <<- np - i
if (f==0) {
qvalue <- data[i+1]
} else {
qvalue <- data[i+1] + f*(data[i+2]-data[i+1])
}
}
q6 <- function(data,n,p,i,f) {
np <- n*p+0.5
i <<- floor(np)
f <<- np - i
qvalue <- data[i]
}
q7 <- function(data,n,p,i,f) {
np <- (n+1)*p
i <<- floor(np)
f <<- np - i
if (f==0) {
qvalue <- data[i]
} else {
qvalue <- f*data[i] + (1-f)*data[i+1]
}
}
q8 <- function(data,n,p,i,f) {
np <- (n+1)*p
i <<- floor(np)
f <<- np - i
if (f==0) {
qvalue <- data[i]
} else {
if (f == 0.5) {
qvalue <- (data[i]+data[i+1])/2
} else {
if (f < 0.5) {
qvalue <- data[i]
} else {
qvalue <- data[i+1]
}
}
}
}
midmean <- function(x,def) {
x <-sort(x[!is.na(x)])
n<-length(x)
if (def==1) {
qvalue1 <- q1(x,n,0.25,i,f)
qvalue3 <- q1(x,n,0.75,i,f)
}
if (def==2) {
qvalue1 <- q2(x,n,0.25,i,f)
qvalue3 <- q2(x,n,0.75,i,f)
}
if (def==3) {
qvalue1 <- q3(x,n,0.25,i,f)
qvalue3 <- q3(x,n,0.75,i,f)
}
if (def==4) {
qvalue1 <- q4(x,n,0.25,i,f)
qvalue3 <- q4(x,n,0.75,i,f)
}
if (def==5) {
qvalue1 <- q5(x,n,0.25,i,f)
qvalue3 <- q5(x,n,0.75,i,f)
}
if (def==6) {
qvalue1 <- q6(x,n,0.25,i,f)
qvalue3 <- q6(x,n,0.75,i,f)
}
if (def==7) {
qvalue1 <- q7(x,n,0.25,i,f)
qvalue3 <- q7(x,n,0.75,i,f)
}
if (def==8) {
qvalue1 <- q8(x,n,0.25,i,f)
qvalue3 <- q8(x,n,0.75,i,f)
}
midm <- 0
myn <- 0
roundno4 <- round(n/4)
round3no4 <- round(3*n/4)
for (i in 1:n) {
if ((x[i]>=qvalue1) & (x[i]<=qvalue3)){
midm = midm + x[i]
myn = myn + 1
}
}
midm = midm / myn
return(midm)
}
(arm <- mean(x))
sqrtn <- sqrt(length(x))
(armse <- sd(x) / sqrtn)
(armose <- arm / armse)
(geo <- geomean(x))
(har <- harmean(x))
(qua <- quamean(x))
(win <- winmean(x))
(tri <- trimean(x))
(midr <- midrange(x))
midm <- array(NA,dim=8)
for (j in 1:8) midm[j] <- midmean(x,j)
midm
bitmap(file='test1.png')
lb <- win[,1] - 2*win[,2]
ub <- win[,1] + 2*win[,2]
if ((ylimmin == '') | (ylimmax == '')) plot(win[,1],type='b',main=main, xlab='j', pch=19, ylab='Winsorized Mean(j/n)', ylim=c(min(lb),max(ub))) else plot(win[,1],type='l',main=main, xlab='j', pch=19, ylab='Winsorized Mean(j/n)', ylim=c(ylimmin,ylimmax))
lines(ub,lty=3)
lines(lb,lty=3)
grid()
dev.off()
bitmap(file='test2.png')
lb <- tri[,1] - 2*tri[,2]
ub <- tri[,1] + 2*tri[,2]
if ((ylimmin == '') | (ylimmax == '')) plot(tri[,1],type='b',main=main, xlab='j', pch=19, ylab='Trimmed Mean(j/n)', ylim=c(min(lb),max(ub))) else plot(tri[,1],type='l',main=main, xlab='j', pch=19, ylab='Trimmed Mean(j/n)', ylim=c(ylimmin,ylimmax))
lines(ub,lty=3)
lines(lb,lty=3)
grid()
dev.off()
load(file='createtable')
a<-table.start()
a<-table.row.start(a)
a<-table.element(a,'Central Tendency - Ungrouped Data',4,TRUE)
a<-table.row.end(a)
a<-table.row.start(a)
a<-table.element(a,'Measure',header=TRUE)
a<-table.element(a,'Value',header=TRUE)
a<-table.element(a,'S.E.',header=TRUE)
a<-table.element(a,'Value/S.E.',header=TRUE)
a<-table.row.end(a)
a<-table.row.start(a)
a<-table.element(a,hyperlink('arithmetic_mean.htm', 'Arithmetic Mean', 'click to view the definition of the Arithmetic Mean'),header=TRUE)
a<-table.element(a,arm)
a<-table.element(a,hyperlink('arithmetic_mean_standard_error.htm', armse, 'click to view the definition of the Standard Error of the Arithmetic Mean'))
a<-table.element(a,armose)
a<-table.row.end(a)
a<-table.row.start(a)
a<-table.element(a,hyperlink('geometric_mean.htm', 'Geometric Mean', 'click to view the definition of the Geometric Mean'),header=TRUE)
a<-table.element(a,geo)
a<-table.element(a,'')
a<-table.row.end(a)
a<-table.row.start(a)
a<-table.element(a,hyperlink('harmonic_mean.htm', 'Harmonic Mean', 'click to view the definition of the Harmonic Mean'),header=TRUE)
a<-table.element(a,har)
a<-table.element(a,'')
a<-table.row.end(a)
a<-table.row.start(a)
a<-table.element(a,hyperlink('quadratic_mean.htm', 'Quadratic Mean', 'click to view the definition of the Quadratic Mean'),header=TRUE)
a<-table.element(a,qua)
a<-table.element(a,'')
a<-table.row.end(a)
for (j in 1:length(win[,1])) {
a<-table.row.start(a)
mylabel <- paste('Winsorized Mean (',j)
mylabel <- paste(mylabel,'/')
mylabel <- paste(mylabel,length(win[,1]))
mylabel <- paste(mylabel,')')
a<-table.element(a,hyperlink('winsorized_mean.htm', mylabel, 'click to view the definition of the Winsorized Mean'),header=TRUE)
a<-table.element(a,win[j,1])
a<-table.element(a,win[j,2])
a<-table.element(a,win[j,1]/win[j,2])
a<-table.row.end(a)
}
for (j in 1:length(tri[,1])) {
a<-table.row.start(a)
mylabel <- paste('Trimmed Mean (',j)
mylabel <- paste(mylabel,'/')
mylabel <- paste(mylabel,length(tri[,1]))
mylabel <- paste(mylabel,')')
a<-table.element(a,hyperlink('arithmetic_mean.htm', mylabel, 'click to view the definition of the Trimmed Mean'),header=TRUE)
a<-table.element(a,tri[j,1])
a<-table.element(a,tri[j,2])
a<-table.element(a,tri[j,1]/tri[j,2])
a<-table.row.end(a)
}
a<-table.row.start(a)
a<-table.element(a,hyperlink('median_1.htm', 'Median', 'click to view the definition of the Median'),header=TRUE)
a<-table.element(a,median(x))
a<-table.element(a,'')
a<-table.row.end(a)
a<-table.row.start(a)
a<-table.element(a,hyperlink('midrange.htm', 'Midrange', 'click to view the definition of the Midrange'),header=TRUE)
a<-table.element(a,midr)
a<-table.element(a,'')
a<-table.row.end(a)
a<-table.row.start(a)
mymid <- hyperlink('midmean.htm', 'Midmean', 'click to view the definition of the Midmean')
mylabel <- paste(mymid,hyperlink('method_1.htm','Weighted Average at Xnp',''),sep=' - ')
a<-table.element(a,mylabel,header=TRUE)
a<-table.element(a,midm[1])
a<-table.element(a,'')
a<-table.row.end(a)
a<-table.row.start(a)
mymid <- hyperlink('midmean.htm', 'Midmean', 'click to view the definition of the Midmean')
mylabel <- paste(mymid,hyperlink('method_2.htm','Weighted Average at X(n+1)p',''),sep=' - ')
a<-table.element(a,mylabel,header=TRUE)
a<-table.element(a,midm[2])
a<-table.element(a,'')
a<-table.row.end(a)
a<-table.row.start(a)
mymid <- hyperlink('midmean.htm', 'Midmean', 'click to view the definition of the Midmean')
mylabel <- paste(mymid,hyperlink('method_3.htm','Empirical Distribution Function',''),sep=' - ')
a<-table.element(a,mylabel,header=TRUE)
a<-table.element(a,midm[3])
a<-table.element(a,'')
a<-table.row.end(a)
a<-table.row.start(a)
mymid <- hyperlink('midmean.htm', 'Midmean', 'click to view the definition of the Midmean')
mylabel <- paste(mymid,hyperlink('method_4.htm','Empirical Distribution Function - Averaging',''),sep=' - ')
a<-table.element(a,mylabel,header=TRUE)
a<-table.element(a,midm[4])
a<-table.element(a,'')
a<-table.row.end(a)
a<-table.row.start(a)
mymid <- hyperlink('midmean.htm', 'Midmean', 'click to view the definition of the Midmean')
mylabel <- paste(mymid,hyperlink('method_5.htm','Empirical Distribution Function - Interpolation',''),sep=' - ')
a<-table.element(a,mylabel,header=TRUE)
a<-table.element(a,midm[5])
a<-table.element(a,'')
a<-table.row.end(a)
a<-table.row.start(a)
mymid <- hyperlink('midmean.htm', 'Midmean', 'click to view the definition of the Midmean')
mylabel <- paste(mymid,hyperlink('method_6.htm','Closest Observation',''),sep=' - ')
a<-table.element(a,mylabel,header=TRUE)
a<-table.element(a,midm[6])
a<-table.element(a,'')
a<-table.row.end(a)
a<-table.row.start(a)
mymid <- hyperlink('midmean.htm', 'Midmean', 'click to view the definition of the Midmean')
mylabel <- paste(mymid,hyperlink('method_7.htm','True Basic - Statistics Graphics Toolkit',''),sep=' - ')
a<-table.element(a,mylabel,header=TRUE)
a<-table.element(a,midm[7])
a<-table.element(a,'')
a<-table.row.end(a)
a<-table.row.start(a)
mymid <- hyperlink('midmean.htm', 'Midmean', 'click to view the definition of the Midmean')
mylabel <- paste(mymid,hyperlink('method_8.htm','MS Excel (old versions)',''),sep=' - ')
a<-table.element(a,mylabel,header=TRUE)
a<-table.element(a,midm[8])
a<-table.element(a,'')
a<-table.row.end(a)
a<-table.row.start(a)
a<-table.element(a,'Number of observations',header=TRUE)
a<-table.element(a,length(x))
a<-table.element(a,'')
a<-table.row.end(a)
a<-table.end(a)
table.save(a,file='mytable.tab')