Free Statistics

of Irreproducible Research!

Author's title

Author*Unverified author*
R Software Modulerwasp_centraltendency.wasp
Title produced by softwareCentral Tendency
Date of computationTue, 14 Mar 2017 21:15:23 +0000
Cite this page as followsStatistical Computations at FreeStatistics.org, Office for Research Development and Education, URL https://freestatistics.org/blog/index.php?v=date/2017/Mar/14/t1489526271y65dnuxo118uvuy.htm/, Retrieved Tue, 14 May 2024 08:39:26 +0200
Statistical Computations at FreeStatistics.org, Office for Research Development and Education, URL https://freestatistics.org/blog/index.php?pk=, Retrieved Tue, 14 May 2024 08:39:26 +0200
QR Codes:

Original text written by user:
IsPrivate?No (this computation is public)
User-defined keywords
Estimated Impact0
Dataseries X:
310
345
365
306
379
336
356
452
354
440
495
360
657
639
620
794
757
737
757
596
869
805
786
731
832
826
907
776
835
715
729
733
736
712
711
667
790
766
1040
949
758
1023
921
775
907
835
871
836
1021
944
915
864
1022
891
1087
822
890
1092
967
833
671
679
862
624
516
650
583
444
562
540
524
683


Summary of computational transaction
Raw Inputview raw input (R code)
Raw Outputview raw output of R engine
Computing time1 seconds
R Server'Gertrude Mary Cox' @ cox.wessa.net
R Framework error message
Warning: there are blank lines in the 'Data' field.
Please, use NA for missing data - blank lines are simply
 deleted and are NOT treated as missing values.

\begin{tabular}{lllllllll}
\hline
Summary of computational transaction \tabularnewline
Raw Input & view raw input (R code)  \tabularnewline
Raw Output & view raw output of R engine  \tabularnewline
Computing time & 1 seconds \tabularnewline
R Server & 'Gertrude Mary Cox' @ cox.wessa.net \tabularnewline
R Framework error message & 
Warning: there are blank lines in the 'Data' field.
Please, use NA for missing data - blank lines are simply
 deleted and are NOT treated as missing values.
\tabularnewline \hline \end{tabular} %Source: https://freestatistics.org/blog/index.php?pk=&T=0

[TABLE]
[ROW][C]Summary of computational transaction[/C][/ROW]
[ROW][C]Raw Input[/C][C]view raw input (R code) [/C][/ROW]
[ROW][C]Raw Output[/C][C]view raw output of R engine [/C][/ROW]
[ROW][C]Computing time[/C][C]1 seconds[/C][/ROW]
[ROW][C]R Server[/C][C]'Gertrude Mary Cox' @ cox.wessa.net[/C][/ROW]
[ROW][C]R Framework error message[/C][C]
Warning: there are blank lines in the 'Data' field.
Please, use NA for missing data - blank lines are simply
 deleted and are NOT treated as missing values.
[/C][/ROW] [/TABLE] Source: https://freestatistics.org/blog/index.php?pk=&T=0

Globally Unique Identifier (entire table): ba.freestatistics.org/blog/index.php?pk=&T=0

As an alternative you can also use a QR Code:  

The GUIDs for individual cells are displayed in the table below:

Summary of computational transaction
Raw Inputview raw input (R code)
Raw Outputview raw output of R engine
Computing time1 seconds
R Server'Gertrude Mary Cox' @ cox.wessa.net
R Framework error message
Warning: there are blank lines in the 'Data' field.
Please, use NA for missing data - blank lines are simply
 deleted and are NOT treated as missing values.


Central Tendency - Ungrouped Data
MeasureValueS.E.Value/S.E.
Arithmetic Mean716.41666666666724.16024481617429.6527072518347
Geometric Mean682.312989479539
Harmonic Mean642.76791152522
Quadratic Mean744.779684052793
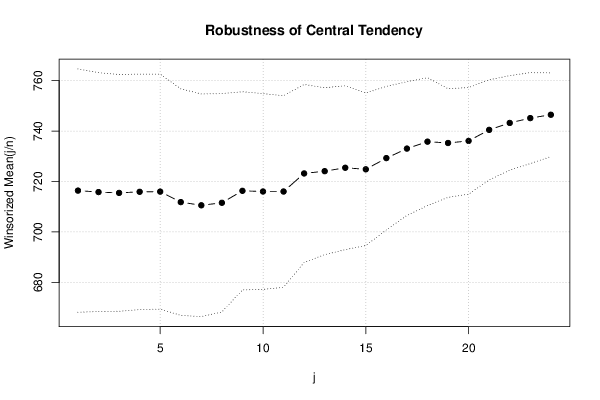
Winsorized Mean ( 1 / 24 )716.40277777777824.131897116063529.6869646978936
Winsorized Mean ( 2 / 24 )715.81944444444423.697578886166330.2064378763314
Winsorized Mean ( 3 / 24 )715.48611111111123.479996756267230.4721554495163
Winsorized Mean ( 4 / 24 )715.93055555555623.359629099584330.6481987579288
Winsorized Mean ( 5 / 24 )71623.316568423918930.7077777047802
Winsorized Mean ( 6 / 24 )711.83333333333322.468130794715731.6819115856647
Winsorized Mean ( 7 / 24 )710.56944444444422.087913214421132.1700577843867
Winsorized Mean ( 8 / 24 )711.56944444444421.664118903915232.8455289412138
Winsorized Mean ( 9 / 24 )716.31944444444419.653063115542836.448234060671
Winsorized Mean ( 10 / 24 )716.04166666666719.422012477134636.8675320083157
Winsorized Mean ( 11 / 24 )716.04166666666719.007210120914537.6721076955304
Winsorized Mean ( 12 / 24 )723.20833333333317.651822285753540.9707463414144
Winsorized Mean ( 13 / 24 )724.11111111111116.553460076814543.7437917964553
Winsorized Mean ( 14 / 24 )725.47222222222216.252253632366244.6382537851521
Winsorized Mean ( 15 / 24 )724.84722222222215.12209904049547.932976783261
Winsorized Mean ( 16 / 24 )729.29166666666714.23520341394251.2315592169477
Winsorized Mean ( 17 / 24 )733.06944444444413.265663467226255.260669491243
Winsorized Mean ( 18 / 24 )735.81944444444412.68454271082858.0091424041893
Winsorized Mean ( 19 / 24 )735.29166666666710.78034054985768.206719747496
Winsorized Mean ( 20 / 24 )736.12510.577142980904569.595825765896
Winsorized Mean ( 21 / 24 )740.59.9354134948956274.5313720843563
Winsorized Mean ( 22 / 24 )743.259.3758828483630579.2725348663849
Winsorized Mean ( 23 / 24 )745.1666666666679.0221428182479982.5930914282922
Winsorized Mean ( 24 / 24 )746.58.2971043462211289.9711476257365
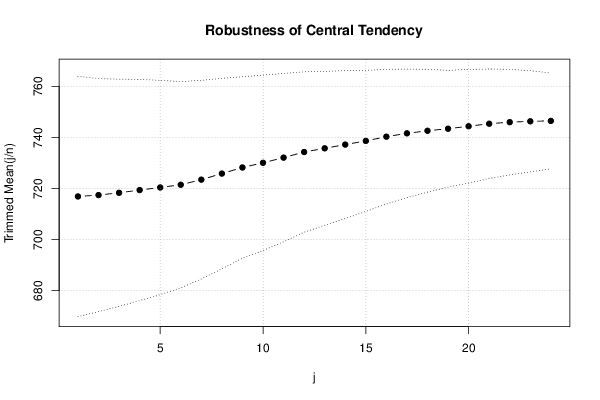
Trimmed Mean ( 1 / 24 )716.91428571428623.531140926771630.4666181697397
Trimmed Mean ( 2 / 24 )717.45588235294122.816782113514531.444218504764
Trimmed Mean ( 3 / 24 )718.34848484848522.241957163721932.2969997451554
Trimmed Mean ( 4 / 24 )719.42187521.650678678641533.2286061641897
Trimmed Mean ( 5 / 24 )720.43548387096820.981075063584534.3373960432267
Trimmed Mean ( 6 / 24 )721.520.180240097567735.7527956313543
Trimmed Mean ( 7 / 24 )723.519.448323727914737.2011495757621
Trimmed Mean ( 8 / 24 )725.87518.645393263084238.9305277586798
Trimmed Mean ( 9 / 24 )728.25925925925917.758339448711741.0094232832164
Trimmed Mean ( 10 / 24 )730.09615384615417.173352231269942.5133162130551
Trimmed Mean ( 11 / 24 )732.1216.486151021697144.4081823001907
Trimmed Mean ( 12 / 24 )734.312515.707492346790146.7491871896447
Trimmed Mean ( 13 / 24 )735.76086956521715.059052352687248.8583778270698
Trimmed Mean ( 14 / 24 )737.22727272727314.484367297936350.8981343515303
Trimmed Mean ( 15 / 24 )738.66666666666713.802222828716853.5179496689334
Trimmed Mean ( 16 / 24 )740.32513.179062041057856.1743315035322
Trimmed Mean ( 17 / 24 )741.63157894736812.580631609035558.9502659321748
Trimmed Mean ( 18 / 24 )742.63888888888912.03026294938761.7308941636002
Trimmed Mean ( 19 / 24 )743.44117647058811.430031367864165.0427940697343
Trimmed Mean ( 20 / 24 )744.4062511.123831886391266.9199478743202
Trimmed Mean ( 21 / 24 )745.410.721940122944269.5210000664804
Trimmed Mean ( 22 / 24 )74610.32898013783772.2239746852899
Trimmed Mean ( 23 / 24 )746.3461538461549.9125316657082475.2931923968616
Trimmed Mean ( 24 / 24 )746.59.3781274976574579.6001120891635
Median747
Midrange699
Midmean - Weighted Average at Xnp738.324324324324
Midmean - Weighted Average at X(n+1)p742.638888888889
Midmean - Empirical Distribution Function738.324324324324
Midmean - Empirical Distribution Function - Averaging742.638888888889
Midmean - Empirical Distribution Function - Interpolation742.638888888889
Midmean - Closest Observation738.324324324324
Midmean - True Basic - Statistics Graphics Toolkit742.638888888889
Midmean - MS Excel (old versions)741.631578947368
Number of observations72

\begin{tabular}{lllllllll}
\hline
Central Tendency - Ungrouped Data \tabularnewline
Measure & Value & S.E. & Value/S.E. \tabularnewline
Arithmetic Mean & 716.416666666667 & 24.160244816174 & 29.6527072518347 \tabularnewline
Geometric Mean & 682.312989479539 &  &  \tabularnewline
Harmonic Mean & 642.76791152522 &  &  \tabularnewline
Quadratic Mean & 744.779684052793 &  &  \tabularnewline
Winsorized Mean ( 1 / 24 ) & 716.402777777778 & 24.1318971160635 & 29.6869646978936 \tabularnewline
Winsorized Mean ( 2 / 24 ) & 715.819444444444 & 23.6975788861663 & 30.2064378763314 \tabularnewline
Winsorized Mean ( 3 / 24 ) & 715.486111111111 & 23.4799967562672 & 30.4721554495163 \tabularnewline
Winsorized Mean ( 4 / 24 ) & 715.930555555556 & 23.3596290995843 & 30.6481987579288 \tabularnewline
Winsorized Mean ( 5 / 24 ) & 716 & 23.3165684239189 & 30.7077777047802 \tabularnewline
Winsorized Mean ( 6 / 24 ) & 711.833333333333 & 22.4681307947157 & 31.6819115856647 \tabularnewline
Winsorized Mean ( 7 / 24 ) & 710.569444444444 & 22.0879132144211 & 32.1700577843867 \tabularnewline
Winsorized Mean ( 8 / 24 ) & 711.569444444444 & 21.6641189039152 & 32.8455289412138 \tabularnewline
Winsorized Mean ( 9 / 24 ) & 716.319444444444 & 19.6530631155428 & 36.448234060671 \tabularnewline
Winsorized Mean ( 10 / 24 ) & 716.041666666667 & 19.4220124771346 & 36.8675320083157 \tabularnewline
Winsorized Mean ( 11 / 24 ) & 716.041666666667 & 19.0072101209145 & 37.6721076955304 \tabularnewline
Winsorized Mean ( 12 / 24 ) & 723.208333333333 & 17.6518222857535 & 40.9707463414144 \tabularnewline
Winsorized Mean ( 13 / 24 ) & 724.111111111111 & 16.5534600768145 & 43.7437917964553 \tabularnewline
Winsorized Mean ( 14 / 24 ) & 725.472222222222 & 16.2522536323662 & 44.6382537851521 \tabularnewline
Winsorized Mean ( 15 / 24 ) & 724.847222222222 & 15.122099040495 & 47.932976783261 \tabularnewline
Winsorized Mean ( 16 / 24 ) & 729.291666666667 & 14.235203413942 & 51.2315592169477 \tabularnewline
Winsorized Mean ( 17 / 24 ) & 733.069444444444 & 13.2656634672262 & 55.260669491243 \tabularnewline
Winsorized Mean ( 18 / 24 ) & 735.819444444444 & 12.684542710828 & 58.0091424041893 \tabularnewline
Winsorized Mean ( 19 / 24 ) & 735.291666666667 & 10.780340549857 & 68.206719747496 \tabularnewline
Winsorized Mean ( 20 / 24 ) & 736.125 & 10.5771429809045 & 69.595825765896 \tabularnewline
Winsorized Mean ( 21 / 24 ) & 740.5 & 9.93541349489562 & 74.5313720843563 \tabularnewline
Winsorized Mean ( 22 / 24 ) & 743.25 & 9.37588284836305 & 79.2725348663849 \tabularnewline
Winsorized Mean ( 23 / 24 ) & 745.166666666667 & 9.02214281824799 & 82.5930914282922 \tabularnewline
Winsorized Mean ( 24 / 24 ) & 746.5 & 8.29710434622112 & 89.9711476257365 \tabularnewline
Trimmed Mean ( 1 / 24 ) & 716.914285714286 & 23.5311409267716 & 30.4666181697397 \tabularnewline
Trimmed Mean ( 2 / 24 ) & 717.455882352941 & 22.8167821135145 & 31.444218504764 \tabularnewline
Trimmed Mean ( 3 / 24 ) & 718.348484848485 & 22.2419571637219 & 32.2969997451554 \tabularnewline
Trimmed Mean ( 4 / 24 ) & 719.421875 & 21.6506786786415 & 33.2286061641897 \tabularnewline
Trimmed Mean ( 5 / 24 ) & 720.435483870968 & 20.9810750635845 & 34.3373960432267 \tabularnewline
Trimmed Mean ( 6 / 24 ) & 721.5 & 20.1802400975677 & 35.7527956313543 \tabularnewline
Trimmed Mean ( 7 / 24 ) & 723.5 & 19.4483237279147 & 37.2011495757621 \tabularnewline
Trimmed Mean ( 8 / 24 ) & 725.875 & 18.6453932630842 & 38.9305277586798 \tabularnewline
Trimmed Mean ( 9 / 24 ) & 728.259259259259 & 17.7583394487117 & 41.0094232832164 \tabularnewline
Trimmed Mean ( 10 / 24 ) & 730.096153846154 & 17.1733522312699 & 42.5133162130551 \tabularnewline
Trimmed Mean ( 11 / 24 ) & 732.12 & 16.4861510216971 & 44.4081823001907 \tabularnewline
Trimmed Mean ( 12 / 24 ) & 734.3125 & 15.7074923467901 & 46.7491871896447 \tabularnewline
Trimmed Mean ( 13 / 24 ) & 735.760869565217 & 15.0590523526872 & 48.8583778270698 \tabularnewline
Trimmed Mean ( 14 / 24 ) & 737.227272727273 & 14.4843672979363 & 50.8981343515303 \tabularnewline
Trimmed Mean ( 15 / 24 ) & 738.666666666667 & 13.8022228287168 & 53.5179496689334 \tabularnewline
Trimmed Mean ( 16 / 24 ) & 740.325 & 13.1790620410578 & 56.1743315035322 \tabularnewline
Trimmed Mean ( 17 / 24 ) & 741.631578947368 & 12.5806316090355 & 58.9502659321748 \tabularnewline
Trimmed Mean ( 18 / 24 ) & 742.638888888889 & 12.030262949387 & 61.7308941636002 \tabularnewline
Trimmed Mean ( 19 / 24 ) & 743.441176470588 & 11.4300313678641 & 65.0427940697343 \tabularnewline
Trimmed Mean ( 20 / 24 ) & 744.40625 & 11.1238318863912 & 66.9199478743202 \tabularnewline
Trimmed Mean ( 21 / 24 ) & 745.4 & 10.7219401229442 & 69.5210000664804 \tabularnewline
Trimmed Mean ( 22 / 24 ) & 746 & 10.328980137837 & 72.2239746852899 \tabularnewline
Trimmed Mean ( 23 / 24 ) & 746.346153846154 & 9.91253166570824 & 75.2931923968616 \tabularnewline
Trimmed Mean ( 24 / 24 ) & 746.5 & 9.37812749765745 & 79.6001120891635 \tabularnewline
Median & 747 &  &  \tabularnewline
Midrange & 699 &  &  \tabularnewline
Midmean - Weighted Average at Xnp & 738.324324324324 &  &  \tabularnewline
Midmean - Weighted Average at X(n+1)p & 742.638888888889 &  &  \tabularnewline
Midmean - Empirical Distribution Function & 738.324324324324 &  &  \tabularnewline
Midmean - Empirical Distribution Function - Averaging & 742.638888888889 &  &  \tabularnewline
Midmean - Empirical Distribution Function - Interpolation & 742.638888888889 &  &  \tabularnewline
Midmean - Closest Observation & 738.324324324324 &  &  \tabularnewline
Midmean - True Basic - Statistics Graphics Toolkit & 742.638888888889 &  &  \tabularnewline
Midmean - MS Excel (old versions) & 741.631578947368 &  &  \tabularnewline
Number of observations & 72 &  &  \tabularnewline
\hline
\end{tabular}
%Source: https://freestatistics.org/blog/index.php?pk=&T=1

[TABLE]
[ROW][C]Central Tendency - Ungrouped Data[/C][/ROW]
[ROW][C]Measure[/C][C]Value[/C][C]S.E.[/C][C]Value/S.E.[/C][/ROW]
[ROW][C]Arithmetic Mean[/C][C]716.416666666667[/C][C]24.160244816174[/C][C]29.6527072518347[/C][/ROW]
[ROW][C]Geometric Mean[/C][C]682.312989479539[/C][C][/C][C][/C][/ROW]
[ROW][C]Harmonic Mean[/C][C]642.76791152522[/C][C][/C][C][/C][/ROW]
[ROW][C]Quadratic Mean[/C][C]744.779684052793[/C][C][/C][C][/C][/ROW]
[ROW][C]Winsorized Mean ( 1 / 24 )[/C][C]716.402777777778[/C][C]24.1318971160635[/C][C]29.6869646978936[/C][/ROW]
[ROW][C]Winsorized Mean ( 2 / 24 )[/C][C]715.819444444444[/C][C]23.6975788861663[/C][C]30.2064378763314[/C][/ROW]
[ROW][C]Winsorized Mean ( 3 / 24 )[/C][C]715.486111111111[/C][C]23.4799967562672[/C][C]30.4721554495163[/C][/ROW]
[ROW][C]Winsorized Mean ( 4 / 24 )[/C][C]715.930555555556[/C][C]23.3596290995843[/C][C]30.6481987579288[/C][/ROW]
[ROW][C]Winsorized Mean ( 5 / 24 )[/C][C]716[/C][C]23.3165684239189[/C][C]30.7077777047802[/C][/ROW]
[ROW][C]Winsorized Mean ( 6 / 24 )[/C][C]711.833333333333[/C][C]22.4681307947157[/C][C]31.6819115856647[/C][/ROW]
[ROW][C]Winsorized Mean ( 7 / 24 )[/C][C]710.569444444444[/C][C]22.0879132144211[/C][C]32.1700577843867[/C][/ROW]
[ROW][C]Winsorized Mean ( 8 / 24 )[/C][C]711.569444444444[/C][C]21.6641189039152[/C][C]32.8455289412138[/C][/ROW]
[ROW][C]Winsorized Mean ( 9 / 24 )[/C][C]716.319444444444[/C][C]19.6530631155428[/C][C]36.448234060671[/C][/ROW]
[ROW][C]Winsorized Mean ( 10 / 24 )[/C][C]716.041666666667[/C][C]19.4220124771346[/C][C]36.8675320083157[/C][/ROW]
[ROW][C]Winsorized Mean ( 11 / 24 )[/C][C]716.041666666667[/C][C]19.0072101209145[/C][C]37.6721076955304[/C][/ROW]
[ROW][C]Winsorized Mean ( 12 / 24 )[/C][C]723.208333333333[/C][C]17.6518222857535[/C][C]40.9707463414144[/C][/ROW]
[ROW][C]Winsorized Mean ( 13 / 24 )[/C][C]724.111111111111[/C][C]16.5534600768145[/C][C]43.7437917964553[/C][/ROW]
[ROW][C]Winsorized Mean ( 14 / 24 )[/C][C]725.472222222222[/C][C]16.2522536323662[/C][C]44.6382537851521[/C][/ROW]
[ROW][C]Winsorized Mean ( 15 / 24 )[/C][C]724.847222222222[/C][C]15.122099040495[/C][C]47.932976783261[/C][/ROW]
[ROW][C]Winsorized Mean ( 16 / 24 )[/C][C]729.291666666667[/C][C]14.235203413942[/C][C]51.2315592169477[/C][/ROW]
[ROW][C]Winsorized Mean ( 17 / 24 )[/C][C]733.069444444444[/C][C]13.2656634672262[/C][C]55.260669491243[/C][/ROW]
[ROW][C]Winsorized Mean ( 18 / 24 )[/C][C]735.819444444444[/C][C]12.684542710828[/C][C]58.0091424041893[/C][/ROW]
[ROW][C]Winsorized Mean ( 19 / 24 )[/C][C]735.291666666667[/C][C]10.780340549857[/C][C]68.206719747496[/C][/ROW]
[ROW][C]Winsorized Mean ( 20 / 24 )[/C][C]736.125[/C][C]10.5771429809045[/C][C]69.595825765896[/C][/ROW]
[ROW][C]Winsorized Mean ( 21 / 24 )[/C][C]740.5[/C][C]9.93541349489562[/C][C]74.5313720843563[/C][/ROW]
[ROW][C]Winsorized Mean ( 22 / 24 )[/C][C]743.25[/C][C]9.37588284836305[/C][C]79.2725348663849[/C][/ROW]
[ROW][C]Winsorized Mean ( 23 / 24 )[/C][C]745.166666666667[/C][C]9.02214281824799[/C][C]82.5930914282922[/C][/ROW]
[ROW][C]Winsorized Mean ( 24 / 24 )[/C][C]746.5[/C][C]8.29710434622112[/C][C]89.9711476257365[/C][/ROW]
[ROW][C]Trimmed Mean ( 1 / 24 )[/C][C]716.914285714286[/C][C]23.5311409267716[/C][C]30.4666181697397[/C][/ROW]
[ROW][C]Trimmed Mean ( 2 / 24 )[/C][C]717.455882352941[/C][C]22.8167821135145[/C][C]31.444218504764[/C][/ROW]
[ROW][C]Trimmed Mean ( 3 / 24 )[/C][C]718.348484848485[/C][C]22.2419571637219[/C][C]32.2969997451554[/C][/ROW]
[ROW][C]Trimmed Mean ( 4 / 24 )[/C][C]719.421875[/C][C]21.6506786786415[/C][C]33.2286061641897[/C][/ROW]
[ROW][C]Trimmed Mean ( 5 / 24 )[/C][C]720.435483870968[/C][C]20.9810750635845[/C][C]34.3373960432267[/C][/ROW]
[ROW][C]Trimmed Mean ( 6 / 24 )[/C][C]721.5[/C][C]20.1802400975677[/C][C]35.7527956313543[/C][/ROW]
[ROW][C]Trimmed Mean ( 7 / 24 )[/C][C]723.5[/C][C]19.4483237279147[/C][C]37.2011495757621[/C][/ROW]
[ROW][C]Trimmed Mean ( 8 / 24 )[/C][C]725.875[/C][C]18.6453932630842[/C][C]38.9305277586798[/C][/ROW]
[ROW][C]Trimmed Mean ( 9 / 24 )[/C][C]728.259259259259[/C][C]17.7583394487117[/C][C]41.0094232832164[/C][/ROW]
[ROW][C]Trimmed Mean ( 10 / 24 )[/C][C]730.096153846154[/C][C]17.1733522312699[/C][C]42.5133162130551[/C][/ROW]
[ROW][C]Trimmed Mean ( 11 / 24 )[/C][C]732.12[/C][C]16.4861510216971[/C][C]44.4081823001907[/C][/ROW]
[ROW][C]Trimmed Mean ( 12 / 24 )[/C][C]734.3125[/C][C]15.7074923467901[/C][C]46.7491871896447[/C][/ROW]
[ROW][C]Trimmed Mean ( 13 / 24 )[/C][C]735.760869565217[/C][C]15.0590523526872[/C][C]48.8583778270698[/C][/ROW]
[ROW][C]Trimmed Mean ( 14 / 24 )[/C][C]737.227272727273[/C][C]14.4843672979363[/C][C]50.8981343515303[/C][/ROW]
[ROW][C]Trimmed Mean ( 15 / 24 )[/C][C]738.666666666667[/C][C]13.8022228287168[/C][C]53.5179496689334[/C][/ROW]
[ROW][C]Trimmed Mean ( 16 / 24 )[/C][C]740.325[/C][C]13.1790620410578[/C][C]56.1743315035322[/C][/ROW]
[ROW][C]Trimmed Mean ( 17 / 24 )[/C][C]741.631578947368[/C][C]12.5806316090355[/C][C]58.9502659321748[/C][/ROW]
[ROW][C]Trimmed Mean ( 18 / 24 )[/C][C]742.638888888889[/C][C]12.030262949387[/C][C]61.7308941636002[/C][/ROW]
[ROW][C]Trimmed Mean ( 19 / 24 )[/C][C]743.441176470588[/C][C]11.4300313678641[/C][C]65.0427940697343[/C][/ROW]
[ROW][C]Trimmed Mean ( 20 / 24 )[/C][C]744.40625[/C][C]11.1238318863912[/C][C]66.9199478743202[/C][/ROW]
[ROW][C]Trimmed Mean ( 21 / 24 )[/C][C]745.4[/C][C]10.7219401229442[/C][C]69.5210000664804[/C][/ROW]
[ROW][C]Trimmed Mean ( 22 / 24 )[/C][C]746[/C][C]10.328980137837[/C][C]72.2239746852899[/C][/ROW]
[ROW][C]Trimmed Mean ( 23 / 24 )[/C][C]746.346153846154[/C][C]9.91253166570824[/C][C]75.2931923968616[/C][/ROW]
[ROW][C]Trimmed Mean ( 24 / 24 )[/C][C]746.5[/C][C]9.37812749765745[/C][C]79.6001120891635[/C][/ROW]
[ROW][C]Median[/C][C]747[/C][C][/C][C][/C][/ROW]
[ROW][C]Midrange[/C][C]699[/C][C][/C][C][/C][/ROW]
[ROW][C]Midmean - Weighted Average at Xnp[/C][C]738.324324324324[/C][C][/C][C][/C][/ROW]
[ROW][C]Midmean - Weighted Average at X(n+1)p[/C][C]742.638888888889[/C][C][/C][C][/C][/ROW]
[ROW][C]Midmean - Empirical Distribution Function[/C][C]738.324324324324[/C][C][/C][C][/C][/ROW]
[ROW][C]Midmean - Empirical Distribution Function - Averaging[/C][C]742.638888888889[/C][C][/C][C][/C][/ROW]
[ROW][C]Midmean - Empirical Distribution Function - Interpolation[/C][C]742.638888888889[/C][C][/C][C][/C][/ROW]
[ROW][C]Midmean - Closest Observation[/C][C]738.324324324324[/C][C][/C][C][/C][/ROW]
[ROW][C]Midmean - True Basic - Statistics Graphics Toolkit[/C][C]742.638888888889[/C][C][/C][C][/C][/ROW]
[ROW][C]Midmean - MS Excel (old versions)[/C][C]741.631578947368[/C][C][/C][C][/C][/ROW]
[ROW][C]Number of observations[/C][C]72[/C][C][/C][C][/C][/ROW]
[/TABLE]
Source: https://freestatistics.org/blog/index.php?pk=&T=1

Globally Unique Identifier (entire table): ba.freestatistics.org/blog/index.php?pk=&T=1

As an alternative you can also use a QR Code:  

The GUIDs for individual cells are displayed in the table below:

Central Tendency - Ungrouped Data
MeasureValueS.E.Value/S.E.
Arithmetic Mean716.41666666666724.16024481617429.6527072518347
Geometric Mean682.312989479539
Harmonic Mean642.76791152522
Quadratic Mean744.779684052793
Winsorized Mean ( 1 / 24 )716.40277777777824.131897116063529.6869646978936
Winsorized Mean ( 2 / 24 )715.81944444444423.697578886166330.2064378763314
Winsorized Mean ( 3 / 24 )715.48611111111123.479996756267230.4721554495163
Winsorized Mean ( 4 / 24 )715.93055555555623.359629099584330.6481987579288
Winsorized Mean ( 5 / 24 )71623.316568423918930.7077777047802
Winsorized Mean ( 6 / 24 )711.83333333333322.468130794715731.6819115856647
Winsorized Mean ( 7 / 24 )710.56944444444422.087913214421132.1700577843867
Winsorized Mean ( 8 / 24 )711.56944444444421.664118903915232.8455289412138
Winsorized Mean ( 9 / 24 )716.31944444444419.653063115542836.448234060671
Winsorized Mean ( 10 / 24 )716.04166666666719.422012477134636.8675320083157
Winsorized Mean ( 11 / 24 )716.04166666666719.007210120914537.6721076955304
Winsorized Mean ( 12 / 24 )723.20833333333317.651822285753540.9707463414144
Winsorized Mean ( 13 / 24 )724.11111111111116.553460076814543.7437917964553
Winsorized Mean ( 14 / 24 )725.47222222222216.252253632366244.6382537851521
Winsorized Mean ( 15 / 24 )724.84722222222215.12209904049547.932976783261
Winsorized Mean ( 16 / 24 )729.29166666666714.23520341394251.2315592169477
Winsorized Mean ( 17 / 24 )733.06944444444413.265663467226255.260669491243
Winsorized Mean ( 18 / 24 )735.81944444444412.68454271082858.0091424041893
Winsorized Mean ( 19 / 24 )735.29166666666710.78034054985768.206719747496
Winsorized Mean ( 20 / 24 )736.12510.577142980904569.595825765896
Winsorized Mean ( 21 / 24 )740.59.9354134948956274.5313720843563
Winsorized Mean ( 22 / 24 )743.259.3758828483630579.2725348663849
Winsorized Mean ( 23 / 24 )745.1666666666679.0221428182479982.5930914282922
Winsorized Mean ( 24 / 24 )746.58.2971043462211289.9711476257365
Trimmed Mean ( 1 / 24 )716.91428571428623.531140926771630.4666181697397
Trimmed Mean ( 2 / 24 )717.45588235294122.816782113514531.444218504764
Trimmed Mean ( 3 / 24 )718.34848484848522.241957163721932.2969997451554
Trimmed Mean ( 4 / 24 )719.42187521.650678678641533.2286061641897
Trimmed Mean ( 5 / 24 )720.43548387096820.981075063584534.3373960432267
Trimmed Mean ( 6 / 24 )721.520.180240097567735.7527956313543
Trimmed Mean ( 7 / 24 )723.519.448323727914737.2011495757621
Trimmed Mean ( 8 / 24 )725.87518.645393263084238.9305277586798
Trimmed Mean ( 9 / 24 )728.25925925925917.758339448711741.0094232832164
Trimmed Mean ( 10 / 24 )730.09615384615417.173352231269942.5133162130551
Trimmed Mean ( 11 / 24 )732.1216.486151021697144.4081823001907
Trimmed Mean ( 12 / 24 )734.312515.707492346790146.7491871896447
Trimmed Mean ( 13 / 24 )735.76086956521715.059052352687248.8583778270698
Trimmed Mean ( 14 / 24 )737.22727272727314.484367297936350.8981343515303
Trimmed Mean ( 15 / 24 )738.66666666666713.802222828716853.5179496689334
Trimmed Mean ( 16 / 24 )740.32513.179062041057856.1743315035322
Trimmed Mean ( 17 / 24 )741.63157894736812.580631609035558.9502659321748
Trimmed Mean ( 18 / 24 )742.63888888888912.03026294938761.7308941636002
Trimmed Mean ( 19 / 24 )743.44117647058811.430031367864165.0427940697343
Trimmed Mean ( 20 / 24 )744.4062511.123831886391266.9199478743202
Trimmed Mean ( 21 / 24 )745.410.721940122944269.5210000664804
Trimmed Mean ( 22 / 24 )74610.32898013783772.2239746852899
Trimmed Mean ( 23 / 24 )746.3461538461549.9125316657082475.2931923968616
Trimmed Mean ( 24 / 24 )746.59.3781274976574579.6001120891635
Median747
Midrange699
Midmean - Weighted Average at Xnp738.324324324324
Midmean - Weighted Average at X(n+1)p742.638888888889
Midmean - Empirical Distribution Function738.324324324324
Midmean - Empirical Distribution Function - Averaging742.638888888889
Midmean - Empirical Distribution Function - Interpolation742.638888888889
Midmean - Closest Observation738.324324324324
Midmean - True Basic - Statistics Graphics Toolkit742.638888888889
Midmean - MS Excel (old versions)741.631578947368
Number of observations72


Parameters (Session):
Parameters (R input):
R code (references can be found in the software module):
geomean <- function(x) {
return(exp(mean(log(x))))
}
harmean <- function(x) {
return(1/mean(1/x))
}
quamean <- function(x) {
return(sqrt(mean(x*x)))
}
winmean <- function(x) {
x <-sort(x[!is.na(x)])
n<-length(x)
denom <- 3
nodenom <- n/denom
if (nodenom>40) denom <- n/40
sqrtn = sqrt(n)
roundnodenom = floor(nodenom)
win <- array(NA,dim=c(roundnodenom,2))
for (j in 1:roundnodenom) {
win[j,1] <- (j*x[j+1]+sum(x[(j+1):(n-j)])+j*x[n-j])/n
win[j,2] <- sd(c(rep(x[j+1],j),x[(j+1):(n-j)],rep(x[n-j],j)))/sqrtn
}
return(win)
}
trimean <- function(x) {
x <-sort(x[!is.na(x)])
n<-length(x)
denom <- 3
nodenom <- n/denom
if (nodenom>40) denom <- n/40
sqrtn = sqrt(n)
roundnodenom = floor(nodenom)
tri <- array(NA,dim=c(roundnodenom,2))
for (j in 1:roundnodenom) {
tri[j,1] <- mean(x,trim=j/n)
tri[j,2] <- sd(x[(j+1):(n-j)]) / sqrt(n-j*2)
}
return(tri)
}
midrange <- function(x) {
return((max(x)+min(x))/2)
}
q1 <- function(data,n,p,i,f) {
np <- n*p;
i <<- floor(np)
f <<- np - i
qvalue <- (1-f)*data[i] + f*data[i+1]
}
q2 <- function(data,n,p,i,f) {
np <- (n+1)*p
i <<- floor(np)
f <<- np - i
qvalue <- (1-f)*data[i] + f*data[i+1]
}
q3 <- function(data,n,p,i,f) {
np <- n*p
i <<- floor(np)
f <<- np - i
if (f==0) {
qvalue <- data[i]
} else {
qvalue <- data[i+1]
}
}
q4 <- function(data,n,p,i,f) {
np <- n*p
i <<- floor(np)
f <<- np - i
if (f==0) {
qvalue <- (data[i]+data[i+1])/2
} else {
qvalue <- data[i+1]
}
}
q5 <- function(data,n,p,i,f) {
np <- (n-1)*p
i <<- floor(np)
f <<- np - i
if (f==0) {
qvalue <- data[i+1]
} else {
qvalue <- data[i+1] + f*(data[i+2]-data[i+1])
}
}
q6 <- function(data,n,p,i,f) {
np <- n*p+0.5
i <<- floor(np)
f <<- np - i
qvalue <- data[i]
}
q7 <- function(data,n,p,i,f) {
np <- (n+1)*p
i <<- floor(np)
f <<- np - i
if (f==0) {
qvalue <- data[i]
} else {
qvalue <- f*data[i] + (1-f)*data[i+1]
}
}
q8 <- function(data,n,p,i,f) {
np <- (n+1)*p
i <<- floor(np)
f <<- np - i
if (f==0) {
qvalue <- data[i]
} else {
if (f == 0.5) {
qvalue <- (data[i]+data[i+1])/2
} else {
if (f < 0.5) {
qvalue <- data[i]
} else {
qvalue <- data[i+1]
}
}
}
}
midmean <- function(x,def) {
x <-sort(x[!is.na(x)])
n<-length(x)
if (def==1) {
qvalue1 <- q1(x,n,0.25,i,f)
qvalue3 <- q1(x,n,0.75,i,f)
}
if (def==2) {
qvalue1 <- q2(x,n,0.25,i,f)
qvalue3 <- q2(x,n,0.75,i,f)
}
if (def==3) {
qvalue1 <- q3(x,n,0.25,i,f)
qvalue3 <- q3(x,n,0.75,i,f)
}
if (def==4) {
qvalue1 <- q4(x,n,0.25,i,f)
qvalue3 <- q4(x,n,0.75,i,f)
}
if (def==5) {
qvalue1 <- q5(x,n,0.25,i,f)
qvalue3 <- q5(x,n,0.75,i,f)
}
if (def==6) {
qvalue1 <- q6(x,n,0.25,i,f)
qvalue3 <- q6(x,n,0.75,i,f)
}
if (def==7) {
qvalue1 <- q7(x,n,0.25,i,f)
qvalue3 <- q7(x,n,0.75,i,f)
}
if (def==8) {
qvalue1 <- q8(x,n,0.25,i,f)
qvalue3 <- q8(x,n,0.75,i,f)
}
midm <- 0
myn <- 0
roundno4 <- round(n/4)
round3no4 <- round(3*n/4)
for (i in 1:n) {
if ((x[i]>=qvalue1) & (x[i]<=qvalue3)){
midm = midm + x[i]
myn = myn + 1
}
}
midm = midm / myn
return(midm)
}
(arm <- mean(x))
sqrtn <- sqrt(length(x))
(armse <- sd(x) / sqrtn)
(armose <- arm / armse)
(geo <- geomean(x))
(har <- harmean(x))
(qua <- quamean(x))
(win <- winmean(x))
(tri <- trimean(x))
(midr <- midrange(x))
midm <- array(NA,dim=8)
for (j in 1:8) midm[j] <- midmean(x,j)
midm
bitmap(file='test1.png')
lb <- win[,1] - 2*win[,2]
ub <- win[,1] + 2*win[,2]
if ((ylimmin == '') | (ylimmax == '')) plot(win[,1],type='b',main=main, xlab='j', pch=19, ylab='Winsorized Mean(j/n)', ylim=c(min(lb),max(ub))) else plot(win[,1],type='l',main=main, xlab='j', pch=19, ylab='Winsorized Mean(j/n)', ylim=c(ylimmin,ylimmax))
lines(ub,lty=3)
lines(lb,lty=3)
grid()
dev.off()
bitmap(file='test2.png')
lb <- tri[,1] - 2*tri[,2]
ub <- tri[,1] + 2*tri[,2]
if ((ylimmin == '') | (ylimmax == '')) plot(tri[,1],type='b',main=main, xlab='j', pch=19, ylab='Trimmed Mean(j/n)', ylim=c(min(lb),max(ub))) else plot(tri[,1],type='l',main=main, xlab='j', pch=19, ylab='Trimmed Mean(j/n)', ylim=c(ylimmin,ylimmax))
lines(ub,lty=3)
lines(lb,lty=3)
grid()
dev.off()
load(file='createtable')
a<-table.start()
a<-table.row.start(a)
a<-table.element(a,'Central Tendency - Ungrouped Data',4,TRUE)
a<-table.row.end(a)
a<-table.row.start(a)
a<-table.element(a,'Measure',header=TRUE)
a<-table.element(a,'Value',header=TRUE)
a<-table.element(a,'S.E.',header=TRUE)
a<-table.element(a,'Value/S.E.',header=TRUE)
a<-table.row.end(a)
a<-table.row.start(a)
a<-table.element(a,hyperlink('arithmetic_mean.htm', 'Arithmetic Mean', 'click to view the definition of the Arithmetic Mean'),header=TRUE)
a<-table.element(a,arm)
a<-table.element(a,hyperlink('arithmetic_mean_standard_error.htm', armse, 'click to view the definition of the Standard Error of the Arithmetic Mean'))
a<-table.element(a,armose)
a<-table.row.end(a)
a<-table.row.start(a)
a<-table.element(a,hyperlink('geometric_mean.htm', 'Geometric Mean', 'click to view the definition of the Geometric Mean'),header=TRUE)
a<-table.element(a,geo)
a<-table.element(a,'')
a<-table.row.end(a)
a<-table.row.start(a)
a<-table.element(a,hyperlink('harmonic_mean.htm', 'Harmonic Mean', 'click to view the definition of the Harmonic Mean'),header=TRUE)
a<-table.element(a,har)
a<-table.element(a,'')
a<-table.row.end(a)
a<-table.row.start(a)
a<-table.element(a,hyperlink('quadratic_mean.htm', 'Quadratic Mean', 'click to view the definition of the Quadratic Mean'),header=TRUE)
a<-table.element(a,qua)
a<-table.element(a,'')
a<-table.row.end(a)
for (j in 1:length(win[,1])) {
a<-table.row.start(a)
mylabel <- paste('Winsorized Mean (',j)
mylabel <- paste(mylabel,'/')
mylabel <- paste(mylabel,length(win[,1]))
mylabel <- paste(mylabel,')')
a<-table.element(a,hyperlink('winsorized_mean.htm', mylabel, 'click to view the definition of the Winsorized Mean'),header=TRUE)
a<-table.element(a,win[j,1])
a<-table.element(a,win[j,2])
a<-table.element(a,win[j,1]/win[j,2])
a<-table.row.end(a)
}
for (j in 1:length(tri[,1])) {
a<-table.row.start(a)
mylabel <- paste('Trimmed Mean (',j)
mylabel <- paste(mylabel,'/')
mylabel <- paste(mylabel,length(tri[,1]))
mylabel <- paste(mylabel,')')
a<-table.element(a,hyperlink('arithmetic_mean.htm', mylabel, 'click to view the definition of the Trimmed Mean'),header=TRUE)
a<-table.element(a,tri[j,1])
a<-table.element(a,tri[j,2])
a<-table.element(a,tri[j,1]/tri[j,2])
a<-table.row.end(a)
}
a<-table.row.start(a)
a<-table.element(a,hyperlink('median_1.htm', 'Median', 'click to view the definition of the Median'),header=TRUE)
a<-table.element(a,median(x))
a<-table.element(a,'')
a<-table.row.end(a)
a<-table.row.start(a)
a<-table.element(a,hyperlink('midrange.htm', 'Midrange', 'click to view the definition of the Midrange'),header=TRUE)
a<-table.element(a,midr)
a<-table.element(a,'')
a<-table.row.end(a)
a<-table.row.start(a)
mymid <- hyperlink('midmean.htm', 'Midmean', 'click to view the definition of the Midmean')
mylabel <- paste(mymid,hyperlink('method_1.htm','Weighted Average at Xnp',''),sep=' - ')
a<-table.element(a,mylabel,header=TRUE)
a<-table.element(a,midm[1])
a<-table.element(a,'')
a<-table.row.end(a)
a<-table.row.start(a)
mymid <- hyperlink('midmean.htm', 'Midmean', 'click to view the definition of the Midmean')
mylabel <- paste(mymid,hyperlink('method_2.htm','Weighted Average at X(n+1)p',''),sep=' - ')
a<-table.element(a,mylabel,header=TRUE)
a<-table.element(a,midm[2])
a<-table.element(a,'')
a<-table.row.end(a)
a<-table.row.start(a)
mymid <- hyperlink('midmean.htm', 'Midmean', 'click to view the definition of the Midmean')
mylabel <- paste(mymid,hyperlink('method_3.htm','Empirical Distribution Function',''),sep=' - ')
a<-table.element(a,mylabel,header=TRUE)
a<-table.element(a,midm[3])
a<-table.element(a,'')
a<-table.row.end(a)
a<-table.row.start(a)
mymid <- hyperlink('midmean.htm', 'Midmean', 'click to view the definition of the Midmean')
mylabel <- paste(mymid,hyperlink('method_4.htm','Empirical Distribution Function - Averaging',''),sep=' - ')
a<-table.element(a,mylabel,header=TRUE)
a<-table.element(a,midm[4])
a<-table.element(a,'')
a<-table.row.end(a)
a<-table.row.start(a)
mymid <- hyperlink('midmean.htm', 'Midmean', 'click to view the definition of the Midmean')
mylabel <- paste(mymid,hyperlink('method_5.htm','Empirical Distribution Function - Interpolation',''),sep=' - ')
a<-table.element(a,mylabel,header=TRUE)
a<-table.element(a,midm[5])
a<-table.element(a,'')
a<-table.row.end(a)
a<-table.row.start(a)
mymid <- hyperlink('midmean.htm', 'Midmean', 'click to view the definition of the Midmean')
mylabel <- paste(mymid,hyperlink('method_6.htm','Closest Observation',''),sep=' - ')
a<-table.element(a,mylabel,header=TRUE)
a<-table.element(a,midm[6])
a<-table.element(a,'')
a<-table.row.end(a)
a<-table.row.start(a)
mymid <- hyperlink('midmean.htm', 'Midmean', 'click to view the definition of the Midmean')
mylabel <- paste(mymid,hyperlink('method_7.htm','True Basic - Statistics Graphics Toolkit',''),sep=' - ')
a<-table.element(a,mylabel,header=TRUE)
a<-table.element(a,midm[7])
a<-table.element(a,'')
a<-table.row.end(a)
a<-table.row.start(a)
mymid <- hyperlink('midmean.htm', 'Midmean', 'click to view the definition of the Midmean')
mylabel <- paste(mymid,hyperlink('method_8.htm','MS Excel (old versions)',''),sep=' - ')
a<-table.element(a,mylabel,header=TRUE)
a<-table.element(a,midm[8])
a<-table.element(a,'')
a<-table.row.end(a)
a<-table.row.start(a)
a<-table.element(a,'Number of observations',header=TRUE)
a<-table.element(a,length(x))
a<-table.element(a,'')
a<-table.row.end(a)
a<-table.end(a)
table.save(a,file='mytable.tab')