Free Statistics

of Irreproducible Research!

Author's title

Author*Unverified author*
R Software Modulerwasp_autocorrelation.wasp
Title produced by software(Partial) Autocorrelation Function
Date of computationThu, 16 Mar 2017 08:21:28 +0000
Cite this page as followsStatistical Computations at FreeStatistics.org, Office for Research Development and Education, URL https://freestatistics.org/blog/index.php?v=date/2017/Mar/16/t1489652562ncjsucmzpx3sz24.htm/, Retrieved Tue, 14 May 2024 18:14:06 +0200
Statistical Computations at FreeStatistics.org, Office for Research Development and Education, URL https://freestatistics.org/blog/index.php?pk=, Retrieved Tue, 14 May 2024 18:14:06 +0200
QR Codes:

Original text written by user:
IsPrivate?No (this computation is public)
User-defined keywords
Estimated Impact0
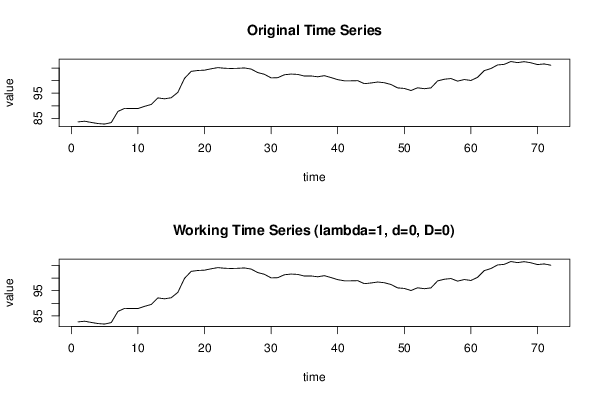
Dataseries X:
83,61
83,89
83,4
82,96
82,76
83,35
87,78
88,99
88,92
88,91
89,79
90,54
93,15
92,79
93,21
95,35
100,91
103,69
104,04
104,16
104,71
105,18
104,92
104,83
104,9
105,05
104,6
103,21
102,52
101,09
101,19
102,34
102,62
102,47
101,82
101,86
101,54
101,98
101,23
100,4
99,94
99,94
100
98,8
99,07
99,46
99,18
98,47
97,12
96,91
96,09
97,17
96,8
97,13
99,9
100,56
100,84
99,81
100,44
100,07
101,32
103,98
104,81
106,23
106,48
107,59
107,16
107,54
107,1
106,38
106,64
106,13


Summary of computational transaction
Raw Inputview raw input (R code)
Raw Outputview raw output of R engine
Computing time1 seconds
R Server'Gwilym Jenkins' @ jenkins.wessa.net

\begin{tabular}{lllllllll}
\hline
Summary of computational transaction \tabularnewline
Raw Input & view raw input (R code)  \tabularnewline
Raw Output & view raw output of R engine  \tabularnewline
Computing time & 1 seconds \tabularnewline
R Server & 'Gwilym Jenkins' @ jenkins.wessa.net \tabularnewline
\hline
\end{tabular}
%Source: https://freestatistics.org/blog/index.php?pk=&T=0

[TABLE]
[ROW][C]Summary of computational transaction[/C][/ROW]
[ROW][C]Raw Input[/C][C]view raw input (R code) [/C][/ROW]
[ROW][C]Raw Output[/C][C]view raw output of R engine [/C][/ROW]
[ROW][C]Computing time[/C][C]1 seconds[/C][/ROW]
[ROW][C]R Server[/C][C]'Gwilym Jenkins' @ jenkins.wessa.net[/C][/ROW]
[/TABLE]
Source: https://freestatistics.org/blog/index.php?pk=&T=0

Globally Unique Identifier (entire table): ba.freestatistics.org/blog/index.php?pk=&T=0

As an alternative you can also use a QR Code:  

The GUIDs for individual cells are displayed in the table below:

Summary of computational transaction
Raw Inputview raw input (R code)
Raw Outputview raw output of R engine
Computing time1 seconds
R Server'Gwilym Jenkins' @ jenkins.wessa.net


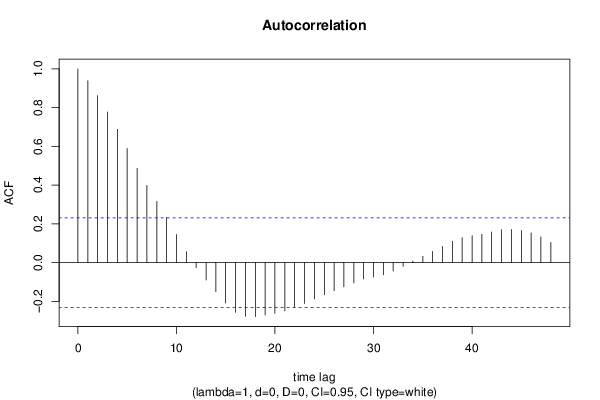
Autocorrelation Function
Time lag kACF(k)T-STATP-value
10.9387347.96540
20.8624137.31780
30.7780736.60220
40.6880065.83790
50.5894395.00162e-06
60.4863864.12714.9e-05
70.3984023.38060.000586
80.3153252.67560.004614
90.2328171.97550.026022
100.1454471.23420.110579
110.0556460.47220.319115
12-0.026373-0.22380.411779
13-0.090056-0.76420.223637
14-0.150917-1.28060.102227
15-0.208342-1.76780.040662
16-0.256192-2.17390.016502
17-0.277026-2.35060.010742
18-0.279309-2.370.010235
19-0.270882-2.29850.012219
20-0.261721-2.22080.014756
21-0.249635-2.11820.018804
22-0.231764-1.96660.026543
23-0.211428-1.7940.038503
24-0.188541-1.59980.057009
25-0.166354-1.41160.081194
26-0.145318-1.23310.110782
27-0.124883-1.05970.146418
28-0.104801-0.88930.18841
29-0.085008-0.72130.236525
30-0.074093-0.62870.265768
31-0.063401-0.5380.296127
32-0.043978-0.37320.355062
33-0.018942-0.16070.436379
340.0075210.06380.474646
350.0320280.27180.39329
360.057670.48930.313042
370.0830970.70510.24151
380.1102260.93530.176381
390.1287061.09210.139214
400.1385521.17570.121804
410.1464291.24250.109043
420.1583541.34370.091636
430.1696771.43980.077135
440.1705161.44690.076136
450.1656541.40560.082069
460.1524881.29390.099917
470.1320621.12060.133094
480.1041790.8840.189823

\begin{tabular}{lllllllll}
\hline
Autocorrelation Function \tabularnewline
Time lag k & ACF(k) & T-STAT & P-value \tabularnewline
1 & 0.938734 & 7.9654 & 0 \tabularnewline
2 & 0.862413 & 7.3178 & 0 \tabularnewline
3 & 0.778073 & 6.6022 & 0 \tabularnewline
4 & 0.688006 & 5.8379 & 0 \tabularnewline
5 & 0.589439 & 5.0016 & 2e-06 \tabularnewline
6 & 0.486386 & 4.1271 & 4.9e-05 \tabularnewline
7 & 0.398402 & 3.3806 & 0.000586 \tabularnewline
8 & 0.315325 & 2.6756 & 0.004614 \tabularnewline
9 & 0.232817 & 1.9755 & 0.026022 \tabularnewline
10 & 0.145447 & 1.2342 & 0.110579 \tabularnewline
11 & 0.055646 & 0.4722 & 0.319115 \tabularnewline
12 & -0.026373 & -0.2238 & 0.411779 \tabularnewline
13 & -0.090056 & -0.7642 & 0.223637 \tabularnewline
14 & -0.150917 & -1.2806 & 0.102227 \tabularnewline
15 & -0.208342 & -1.7678 & 0.040662 \tabularnewline
16 & -0.256192 & -2.1739 & 0.016502 \tabularnewline
17 & -0.277026 & -2.3506 & 0.010742 \tabularnewline
18 & -0.279309 & -2.37 & 0.010235 \tabularnewline
19 & -0.270882 & -2.2985 & 0.012219 \tabularnewline
20 & -0.261721 & -2.2208 & 0.014756 \tabularnewline
21 & -0.249635 & -2.1182 & 0.018804 \tabularnewline
22 & -0.231764 & -1.9666 & 0.026543 \tabularnewline
23 & -0.211428 & -1.794 & 0.038503 \tabularnewline
24 & -0.188541 & -1.5998 & 0.057009 \tabularnewline
25 & -0.166354 & -1.4116 & 0.081194 \tabularnewline
26 & -0.145318 & -1.2331 & 0.110782 \tabularnewline
27 & -0.124883 & -1.0597 & 0.146418 \tabularnewline
28 & -0.104801 & -0.8893 & 0.18841 \tabularnewline
29 & -0.085008 & -0.7213 & 0.236525 \tabularnewline
30 & -0.074093 & -0.6287 & 0.265768 \tabularnewline
31 & -0.063401 & -0.538 & 0.296127 \tabularnewline
32 & -0.043978 & -0.3732 & 0.355062 \tabularnewline
33 & -0.018942 & -0.1607 & 0.436379 \tabularnewline
34 & 0.007521 & 0.0638 & 0.474646 \tabularnewline
35 & 0.032028 & 0.2718 & 0.39329 \tabularnewline
36 & 0.05767 & 0.4893 & 0.313042 \tabularnewline
37 & 0.083097 & 0.7051 & 0.24151 \tabularnewline
38 & 0.110226 & 0.9353 & 0.176381 \tabularnewline
39 & 0.128706 & 1.0921 & 0.139214 \tabularnewline
40 & 0.138552 & 1.1757 & 0.121804 \tabularnewline
41 & 0.146429 & 1.2425 & 0.109043 \tabularnewline
42 & 0.158354 & 1.3437 & 0.091636 \tabularnewline
43 & 0.169677 & 1.4398 & 0.077135 \tabularnewline
44 & 0.170516 & 1.4469 & 0.076136 \tabularnewline
45 & 0.165654 & 1.4056 & 0.082069 \tabularnewline
46 & 0.152488 & 1.2939 & 0.099917 \tabularnewline
47 & 0.132062 & 1.1206 & 0.133094 \tabularnewline
48 & 0.104179 & 0.884 & 0.189823 \tabularnewline
\hline
\end{tabular}
%Source: https://freestatistics.org/blog/index.php?pk=&T=1

[TABLE]
[ROW][C]Autocorrelation Function[/C][/ROW]
[ROW][C]Time lag k[/C][C]ACF(k)[/C][C]T-STAT[/C][C]P-value[/C][/ROW]
[ROW][C]1[/C][C]0.938734[/C][C]7.9654[/C][C]0[/C][/ROW]
[ROW][C]2[/C][C]0.862413[/C][C]7.3178[/C][C]0[/C][/ROW]
[ROW][C]3[/C][C]0.778073[/C][C]6.6022[/C][C]0[/C][/ROW]
[ROW][C]4[/C][C]0.688006[/C][C]5.8379[/C][C]0[/C][/ROW]
[ROW][C]5[/C][C]0.589439[/C][C]5.0016[/C][C]2e-06[/C][/ROW]
[ROW][C]6[/C][C]0.486386[/C][C]4.1271[/C][C]4.9e-05[/C][/ROW]
[ROW][C]7[/C][C]0.398402[/C][C]3.3806[/C][C]0.000586[/C][/ROW]
[ROW][C]8[/C][C]0.315325[/C][C]2.6756[/C][C]0.004614[/C][/ROW]
[ROW][C]9[/C][C]0.232817[/C][C]1.9755[/C][C]0.026022[/C][/ROW]
[ROW][C]10[/C][C]0.145447[/C][C]1.2342[/C][C]0.110579[/C][/ROW]
[ROW][C]11[/C][C]0.055646[/C][C]0.4722[/C][C]0.319115[/C][/ROW]
[ROW][C]12[/C][C]-0.026373[/C][C]-0.2238[/C][C]0.411779[/C][/ROW]
[ROW][C]13[/C][C]-0.090056[/C][C]-0.7642[/C][C]0.223637[/C][/ROW]
[ROW][C]14[/C][C]-0.150917[/C][C]-1.2806[/C][C]0.102227[/C][/ROW]
[ROW][C]15[/C][C]-0.208342[/C][C]-1.7678[/C][C]0.040662[/C][/ROW]
[ROW][C]16[/C][C]-0.256192[/C][C]-2.1739[/C][C]0.016502[/C][/ROW]
[ROW][C]17[/C][C]-0.277026[/C][C]-2.3506[/C][C]0.010742[/C][/ROW]
[ROW][C]18[/C][C]-0.279309[/C][C]-2.37[/C][C]0.010235[/C][/ROW]
[ROW][C]19[/C][C]-0.270882[/C][C]-2.2985[/C][C]0.012219[/C][/ROW]
[ROW][C]20[/C][C]-0.261721[/C][C]-2.2208[/C][C]0.014756[/C][/ROW]
[ROW][C]21[/C][C]-0.249635[/C][C]-2.1182[/C][C]0.018804[/C][/ROW]
[ROW][C]22[/C][C]-0.231764[/C][C]-1.9666[/C][C]0.026543[/C][/ROW]
[ROW][C]23[/C][C]-0.211428[/C][C]-1.794[/C][C]0.038503[/C][/ROW]
[ROW][C]24[/C][C]-0.188541[/C][C]-1.5998[/C][C]0.057009[/C][/ROW]
[ROW][C]25[/C][C]-0.166354[/C][C]-1.4116[/C][C]0.081194[/C][/ROW]
[ROW][C]26[/C][C]-0.145318[/C][C]-1.2331[/C][C]0.110782[/C][/ROW]
[ROW][C]27[/C][C]-0.124883[/C][C]-1.0597[/C][C]0.146418[/C][/ROW]
[ROW][C]28[/C][C]-0.104801[/C][C]-0.8893[/C][C]0.18841[/C][/ROW]
[ROW][C]29[/C][C]-0.085008[/C][C]-0.7213[/C][C]0.236525[/C][/ROW]
[ROW][C]30[/C][C]-0.074093[/C][C]-0.6287[/C][C]0.265768[/C][/ROW]
[ROW][C]31[/C][C]-0.063401[/C][C]-0.538[/C][C]0.296127[/C][/ROW]
[ROW][C]32[/C][C]-0.043978[/C][C]-0.3732[/C][C]0.355062[/C][/ROW]
[ROW][C]33[/C][C]-0.018942[/C][C]-0.1607[/C][C]0.436379[/C][/ROW]
[ROW][C]34[/C][C]0.007521[/C][C]0.0638[/C][C]0.474646[/C][/ROW]
[ROW][C]35[/C][C]0.032028[/C][C]0.2718[/C][C]0.39329[/C][/ROW]
[ROW][C]36[/C][C]0.05767[/C][C]0.4893[/C][C]0.313042[/C][/ROW]
[ROW][C]37[/C][C]0.083097[/C][C]0.7051[/C][C]0.24151[/C][/ROW]
[ROW][C]38[/C][C]0.110226[/C][C]0.9353[/C][C]0.176381[/C][/ROW]
[ROW][C]39[/C][C]0.128706[/C][C]1.0921[/C][C]0.139214[/C][/ROW]
[ROW][C]40[/C][C]0.138552[/C][C]1.1757[/C][C]0.121804[/C][/ROW]
[ROW][C]41[/C][C]0.146429[/C][C]1.2425[/C][C]0.109043[/C][/ROW]
[ROW][C]42[/C][C]0.158354[/C][C]1.3437[/C][C]0.091636[/C][/ROW]
[ROW][C]43[/C][C]0.169677[/C][C]1.4398[/C][C]0.077135[/C][/ROW]
[ROW][C]44[/C][C]0.170516[/C][C]1.4469[/C][C]0.076136[/C][/ROW]
[ROW][C]45[/C][C]0.165654[/C][C]1.4056[/C][C]0.082069[/C][/ROW]
[ROW][C]46[/C][C]0.152488[/C][C]1.2939[/C][C]0.099917[/C][/ROW]
[ROW][C]47[/C][C]0.132062[/C][C]1.1206[/C][C]0.133094[/C][/ROW]
[ROW][C]48[/C][C]0.104179[/C][C]0.884[/C][C]0.189823[/C][/ROW]
[/TABLE]
Source: https://freestatistics.org/blog/index.php?pk=&T=1

Globally Unique Identifier (entire table): ba.freestatistics.org/blog/index.php?pk=&T=1

As an alternative you can also use a QR Code:  

The GUIDs for individual cells are displayed in the table below:

Autocorrelation Function
Time lag kACF(k)T-STATP-value
10.9387347.96540
20.8624137.31780
30.7780736.60220
40.6880065.83790
50.5894395.00162e-06
60.4863864.12714.9e-05
70.3984023.38060.000586
80.3153252.67560.004614
90.2328171.97550.026022
100.1454471.23420.110579
110.0556460.47220.319115
12-0.026373-0.22380.411779
13-0.090056-0.76420.223637
14-0.150917-1.28060.102227
15-0.208342-1.76780.040662
16-0.256192-2.17390.016502
17-0.277026-2.35060.010742
18-0.279309-2.370.010235
19-0.270882-2.29850.012219
20-0.261721-2.22080.014756
21-0.249635-2.11820.018804
22-0.231764-1.96660.026543
23-0.211428-1.7940.038503
24-0.188541-1.59980.057009
25-0.166354-1.41160.081194
26-0.145318-1.23310.110782
27-0.124883-1.05970.146418
28-0.104801-0.88930.18841
29-0.085008-0.72130.236525
30-0.074093-0.62870.265768
31-0.063401-0.5380.296127
32-0.043978-0.37320.355062
33-0.018942-0.16070.436379
340.0075210.06380.474646
350.0320280.27180.39329
360.057670.48930.313042
370.0830970.70510.24151
380.1102260.93530.176381
390.1287061.09210.139214
400.1385521.17570.121804
410.1464291.24250.109043
420.1583541.34370.091636
430.1696771.43980.077135
440.1705161.44690.076136
450.1656541.40560.082069
460.1524881.29390.099917
470.1320621.12060.133094
480.1041790.8840.189823


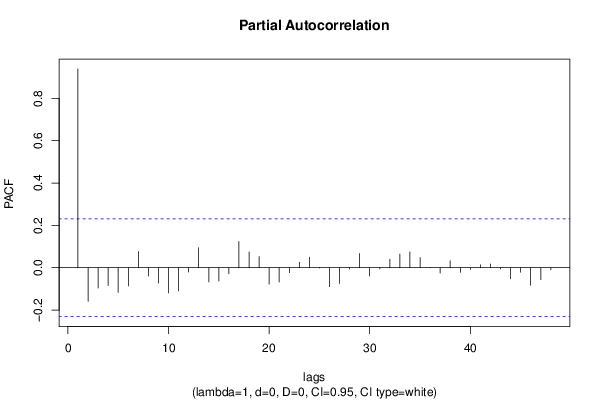
Partial Autocorrelation Function
Time lag kPACF(k)T-STATP-value
10.9387347.96540
2-0.158355-1.34370.091635
3-0.095434-0.80980.210366
4-0.084049-0.71320.239021
5-0.116356-0.98730.163398
6-0.085617-0.72650.234948
70.0770360.65370.257702
8-0.039154-0.33220.37034
9-0.07172-0.60860.272364
10-0.118663-1.00690.15868
11-0.109189-0.92650.178641
12-0.020034-0.170.432745
130.0943010.80020.213122
14-0.066707-0.5660.286567
15-0.062315-0.52880.299299
16-0.028756-0.2440.40396
170.1238851.05120.148342
180.0740670.62850.265841
190.052660.44680.328168
20-0.077392-0.65670.256736
21-0.067113-0.56950.285405
22-0.023018-0.19530.422847
230.0262010.22230.412345
240.0494180.41930.338114
25-0.001513-0.01280.494896
26-0.089125-0.75630.225982
27-0.074459-0.63180.264758
28-0.00631-0.05350.478725
290.0672830.57090.284917
30-0.039138-0.33210.370391
31-0.006259-0.05310.478895
320.0399860.33930.367689
330.0642260.5450.293728
340.0739740.62770.266097
350.047920.40660.342748
360.0014210.01210.495207
37-0.025051-0.21260.416133
380.0331670.28140.389592
39-0.021967-0.18640.426328
40-0.008231-0.06980.472255
410.0135750.11520.454309
420.017610.14940.440817
43-0.005283-0.04480.482185
44-0.052186-0.44280.329614
45-0.020634-0.17510.430753
46-0.082701-0.70170.242552
47-0.056067-0.47570.317848
48-0.009886-0.08390.466689

\begin{tabular}{lllllllll}
\hline
Partial Autocorrelation Function \tabularnewline
Time lag k & PACF(k) & T-STAT & P-value \tabularnewline
1 & 0.938734 & 7.9654 & 0 \tabularnewline
2 & -0.158355 & -1.3437 & 0.091635 \tabularnewline
3 & -0.095434 & -0.8098 & 0.210366 \tabularnewline
4 & -0.084049 & -0.7132 & 0.239021 \tabularnewline
5 & -0.116356 & -0.9873 & 0.163398 \tabularnewline
6 & -0.085617 & -0.7265 & 0.234948 \tabularnewline
7 & 0.077036 & 0.6537 & 0.257702 \tabularnewline
8 & -0.039154 & -0.3322 & 0.37034 \tabularnewline
9 & -0.07172 & -0.6086 & 0.272364 \tabularnewline
10 & -0.118663 & -1.0069 & 0.15868 \tabularnewline
11 & -0.109189 & -0.9265 & 0.178641 \tabularnewline
12 & -0.020034 & -0.17 & 0.432745 \tabularnewline
13 & 0.094301 & 0.8002 & 0.213122 \tabularnewline
14 & -0.066707 & -0.566 & 0.286567 \tabularnewline
15 & -0.062315 & -0.5288 & 0.299299 \tabularnewline
16 & -0.028756 & -0.244 & 0.40396 \tabularnewline
17 & 0.123885 & 1.0512 & 0.148342 \tabularnewline
18 & 0.074067 & 0.6285 & 0.265841 \tabularnewline
19 & 0.05266 & 0.4468 & 0.328168 \tabularnewline
20 & -0.077392 & -0.6567 & 0.256736 \tabularnewline
21 & -0.067113 & -0.5695 & 0.285405 \tabularnewline
22 & -0.023018 & -0.1953 & 0.422847 \tabularnewline
23 & 0.026201 & 0.2223 & 0.412345 \tabularnewline
24 & 0.049418 & 0.4193 & 0.338114 \tabularnewline
25 & -0.001513 & -0.0128 & 0.494896 \tabularnewline
26 & -0.089125 & -0.7563 & 0.225982 \tabularnewline
27 & -0.074459 & -0.6318 & 0.264758 \tabularnewline
28 & -0.00631 & -0.0535 & 0.478725 \tabularnewline
29 & 0.067283 & 0.5709 & 0.284917 \tabularnewline
30 & -0.039138 & -0.3321 & 0.370391 \tabularnewline
31 & -0.006259 & -0.0531 & 0.478895 \tabularnewline
32 & 0.039986 & 0.3393 & 0.367689 \tabularnewline
33 & 0.064226 & 0.545 & 0.293728 \tabularnewline
34 & 0.073974 & 0.6277 & 0.266097 \tabularnewline
35 & 0.04792 & 0.4066 & 0.342748 \tabularnewline
36 & 0.001421 & 0.0121 & 0.495207 \tabularnewline
37 & -0.025051 & -0.2126 & 0.416133 \tabularnewline
38 & 0.033167 & 0.2814 & 0.389592 \tabularnewline
39 & -0.021967 & -0.1864 & 0.426328 \tabularnewline
40 & -0.008231 & -0.0698 & 0.472255 \tabularnewline
41 & 0.013575 & 0.1152 & 0.454309 \tabularnewline
42 & 0.01761 & 0.1494 & 0.440817 \tabularnewline
43 & -0.005283 & -0.0448 & 0.482185 \tabularnewline
44 & -0.052186 & -0.4428 & 0.329614 \tabularnewline
45 & -0.020634 & -0.1751 & 0.430753 \tabularnewline
46 & -0.082701 & -0.7017 & 0.242552 \tabularnewline
47 & -0.056067 & -0.4757 & 0.317848 \tabularnewline
48 & -0.009886 & -0.0839 & 0.466689 \tabularnewline
\hline
\end{tabular}
%Source: https://freestatistics.org/blog/index.php?pk=&T=2

[TABLE]
[ROW][C]Partial Autocorrelation Function[/C][/ROW]
[ROW][C]Time lag k[/C][C]PACF(k)[/C][C]T-STAT[/C][C]P-value[/C][/ROW]
[ROW][C]1[/C][C]0.938734[/C][C]7.9654[/C][C]0[/C][/ROW]
[ROW][C]2[/C][C]-0.158355[/C][C]-1.3437[/C][C]0.091635[/C][/ROW]
[ROW][C]3[/C][C]-0.095434[/C][C]-0.8098[/C][C]0.210366[/C][/ROW]
[ROW][C]4[/C][C]-0.084049[/C][C]-0.7132[/C][C]0.239021[/C][/ROW]
[ROW][C]5[/C][C]-0.116356[/C][C]-0.9873[/C][C]0.163398[/C][/ROW]
[ROW][C]6[/C][C]-0.085617[/C][C]-0.7265[/C][C]0.234948[/C][/ROW]
[ROW][C]7[/C][C]0.077036[/C][C]0.6537[/C][C]0.257702[/C][/ROW]
[ROW][C]8[/C][C]-0.039154[/C][C]-0.3322[/C][C]0.37034[/C][/ROW]
[ROW][C]9[/C][C]-0.07172[/C][C]-0.6086[/C][C]0.272364[/C][/ROW]
[ROW][C]10[/C][C]-0.118663[/C][C]-1.0069[/C][C]0.15868[/C][/ROW]
[ROW][C]11[/C][C]-0.109189[/C][C]-0.9265[/C][C]0.178641[/C][/ROW]
[ROW][C]12[/C][C]-0.020034[/C][C]-0.17[/C][C]0.432745[/C][/ROW]
[ROW][C]13[/C][C]0.094301[/C][C]0.8002[/C][C]0.213122[/C][/ROW]
[ROW][C]14[/C][C]-0.066707[/C][C]-0.566[/C][C]0.286567[/C][/ROW]
[ROW][C]15[/C][C]-0.062315[/C][C]-0.5288[/C][C]0.299299[/C][/ROW]
[ROW][C]16[/C][C]-0.028756[/C][C]-0.244[/C][C]0.40396[/C][/ROW]
[ROW][C]17[/C][C]0.123885[/C][C]1.0512[/C][C]0.148342[/C][/ROW]
[ROW][C]18[/C][C]0.074067[/C][C]0.6285[/C][C]0.265841[/C][/ROW]
[ROW][C]19[/C][C]0.05266[/C][C]0.4468[/C][C]0.328168[/C][/ROW]
[ROW][C]20[/C][C]-0.077392[/C][C]-0.6567[/C][C]0.256736[/C][/ROW]
[ROW][C]21[/C][C]-0.067113[/C][C]-0.5695[/C][C]0.285405[/C][/ROW]
[ROW][C]22[/C][C]-0.023018[/C][C]-0.1953[/C][C]0.422847[/C][/ROW]
[ROW][C]23[/C][C]0.026201[/C][C]0.2223[/C][C]0.412345[/C][/ROW]
[ROW][C]24[/C][C]0.049418[/C][C]0.4193[/C][C]0.338114[/C][/ROW]
[ROW][C]25[/C][C]-0.001513[/C][C]-0.0128[/C][C]0.494896[/C][/ROW]
[ROW][C]26[/C][C]-0.089125[/C][C]-0.7563[/C][C]0.225982[/C][/ROW]
[ROW][C]27[/C][C]-0.074459[/C][C]-0.6318[/C][C]0.264758[/C][/ROW]
[ROW][C]28[/C][C]-0.00631[/C][C]-0.0535[/C][C]0.478725[/C][/ROW]
[ROW][C]29[/C][C]0.067283[/C][C]0.5709[/C][C]0.284917[/C][/ROW]
[ROW][C]30[/C][C]-0.039138[/C][C]-0.3321[/C][C]0.370391[/C][/ROW]
[ROW][C]31[/C][C]-0.006259[/C][C]-0.0531[/C][C]0.478895[/C][/ROW]
[ROW][C]32[/C][C]0.039986[/C][C]0.3393[/C][C]0.367689[/C][/ROW]
[ROW][C]33[/C][C]0.064226[/C][C]0.545[/C][C]0.293728[/C][/ROW]
[ROW][C]34[/C][C]0.073974[/C][C]0.6277[/C][C]0.266097[/C][/ROW]
[ROW][C]35[/C][C]0.04792[/C][C]0.4066[/C][C]0.342748[/C][/ROW]
[ROW][C]36[/C][C]0.001421[/C][C]0.0121[/C][C]0.495207[/C][/ROW]
[ROW][C]37[/C][C]-0.025051[/C][C]-0.2126[/C][C]0.416133[/C][/ROW]
[ROW][C]38[/C][C]0.033167[/C][C]0.2814[/C][C]0.389592[/C][/ROW]
[ROW][C]39[/C][C]-0.021967[/C][C]-0.1864[/C][C]0.426328[/C][/ROW]
[ROW][C]40[/C][C]-0.008231[/C][C]-0.0698[/C][C]0.472255[/C][/ROW]
[ROW][C]41[/C][C]0.013575[/C][C]0.1152[/C][C]0.454309[/C][/ROW]
[ROW][C]42[/C][C]0.01761[/C][C]0.1494[/C][C]0.440817[/C][/ROW]
[ROW][C]43[/C][C]-0.005283[/C][C]-0.0448[/C][C]0.482185[/C][/ROW]
[ROW][C]44[/C][C]-0.052186[/C][C]-0.4428[/C][C]0.329614[/C][/ROW]
[ROW][C]45[/C][C]-0.020634[/C][C]-0.1751[/C][C]0.430753[/C][/ROW]
[ROW][C]46[/C][C]-0.082701[/C][C]-0.7017[/C][C]0.242552[/C][/ROW]
[ROW][C]47[/C][C]-0.056067[/C][C]-0.4757[/C][C]0.317848[/C][/ROW]
[ROW][C]48[/C][C]-0.009886[/C][C]-0.0839[/C][C]0.466689[/C][/ROW]
[/TABLE]
Source: https://freestatistics.org/blog/index.php?pk=&T=2

Globally Unique Identifier (entire table): ba.freestatistics.org/blog/index.php?pk=&T=2

As an alternative you can also use a QR Code:  

The GUIDs for individual cells are displayed in the table below:

Partial Autocorrelation Function
Time lag kPACF(k)T-STATP-value
10.9387347.96540
2-0.158355-1.34370.091635
3-0.095434-0.80980.210366
4-0.084049-0.71320.239021
5-0.116356-0.98730.163398
6-0.085617-0.72650.234948
70.0770360.65370.257702
8-0.039154-0.33220.37034
9-0.07172-0.60860.272364
10-0.118663-1.00690.15868
11-0.109189-0.92650.178641
12-0.020034-0.170.432745
130.0943010.80020.213122
14-0.066707-0.5660.286567
15-0.062315-0.52880.299299
16-0.028756-0.2440.40396
170.1238851.05120.148342
180.0740670.62850.265841
190.052660.44680.328168
20-0.077392-0.65670.256736
21-0.067113-0.56950.285405
22-0.023018-0.19530.422847
230.0262010.22230.412345
240.0494180.41930.338114
25-0.001513-0.01280.494896
26-0.089125-0.75630.225982
27-0.074459-0.63180.264758
28-0.00631-0.05350.478725
290.0672830.57090.284917
30-0.039138-0.33210.370391
31-0.006259-0.05310.478895
320.0399860.33930.367689
330.0642260.5450.293728
340.0739740.62770.266097
350.047920.40660.342748
360.0014210.01210.495207
37-0.025051-0.21260.416133
380.0331670.28140.389592
39-0.021967-0.18640.426328
40-0.008231-0.06980.472255
410.0135750.11520.454309
420.017610.14940.440817
43-0.005283-0.04480.482185
44-0.052186-0.44280.329614
45-0.020634-0.17510.430753
46-0.082701-0.70170.242552
47-0.056067-0.47570.317848
48-0.009886-0.08390.466689


Parameters (Session):
par1 = 48 ; par2 = 1 ; par3 = 0 ; par4 = 0 ; par5 = 12 ; par6 = White Noise ; par7 = 0.95 ;
Parameters (R input):
par1 = 48 ; par2 = 1 ; par3 = 0 ; par4 = 0 ; par5 = 12 ; par6 = White Noise ; par7 = 0.95 ; par8 = ;
R code (references can be found in the software module):
if (par1 == 'Default') {
par1 = 10*log10(length(x))
} else {
par1 <- as.numeric(par1)
}
par2 <- as.numeric(par2)
par3 <- as.numeric(par3)
par4 <- as.numeric(par4)
par5 <- as.numeric(par5)
if (par6 == 'White Noise') par6 <- 'white' else par6 <- 'ma'
par7 <- as.numeric(par7)
if (par8 != '') par8 <- as.numeric(par8)
x <- na.omit(x)
ox <- x
if (par8 == '') {
if (par2 == 0) {
x <- log(x)
} else {
x <- (x ^ par2 - 1) / par2
}
} else {
x <- log(x,base=par8)
}
if (par3 > 0) x <- diff(x,lag=1,difference=par3)
if (par4 > 0) x <- diff(x,lag=par5,difference=par4)
bitmap(file='picts.png')
op <- par(mfrow=c(2,1))
plot(ox,type='l',main='Original Time Series',xlab='time',ylab='value')
if (par8=='') {
mytitle <- paste('Working Time Series (lambda=',par2,', d=',par3,', D=',par4,')',sep='')
mysub <- paste('(lambda=',par2,', d=',par3,', D=',par4,', CI=', par7, ', CI type=',par6,')',sep='')
} else {
mytitle <- paste('Working Time Series (base=',par8,', d=',par3,', D=',par4,')',sep='')
mysub <- paste('(base=',par8,', d=',par3,', D=',par4,', CI=', par7, ', CI type=',par6,')',sep='')
}
plot(x,type='l', main=mytitle,xlab='time',ylab='value')
par(op)
dev.off()
bitmap(file='pic1.png')
racf <- acf(x, par1, main='Autocorrelation', xlab='time lag', ylab='ACF', ci.type=par6, ci=par7, sub=mysub)
dev.off()
bitmap(file='pic2.png')
rpacf <- pacf(x,par1,main='Partial Autocorrelation',xlab='lags',ylab='PACF',sub=mysub)
dev.off()
(myacf <- c(racf$acf))
(mypacf <- c(rpacf$acf))
lengthx <- length(x)
sqrtn <- sqrt(lengthx)
load(file='createtable')
a<-table.start()
a<-table.row.start(a)
a<-table.element(a,'Autocorrelation Function',4,TRUE)
a<-table.row.end(a)
a<-table.row.start(a)
a<-table.element(a,'Time lag k',header=TRUE)
a<-table.element(a,hyperlink('basics.htm','ACF(k)','click here for more information about the Autocorrelation Function'),header=TRUE)
a<-table.element(a,'T-STAT',header=TRUE)
a<-table.element(a,'P-value',header=TRUE)
a<-table.row.end(a)
for (i in 2:(par1+1)) {
a<-table.row.start(a)
a<-table.element(a,i-1,header=TRUE)
a<-table.element(a,round(myacf[i],6))
mytstat <- myacf[i]*sqrtn
a<-table.element(a,round(mytstat,4))
a<-table.element(a,round(1-pt(abs(mytstat),lengthx),6))
a<-table.row.end(a)
}
a<-table.end(a)
table.save(a,file='mytable.tab')
a<-table.start()
a<-table.row.start(a)
a<-table.element(a,'Partial Autocorrelation Function',4,TRUE)
a<-table.row.end(a)
a<-table.row.start(a)
a<-table.element(a,'Time lag k',header=TRUE)
a<-table.element(a,hyperlink('basics.htm','PACF(k)','click here for more information about the Partial Autocorrelation Function'),header=TRUE)
a<-table.element(a,'T-STAT',header=TRUE)
a<-table.element(a,'P-value',header=TRUE)
a<-table.row.end(a)
for (i in 1:par1) {
a<-table.row.start(a)
a<-table.element(a,i,header=TRUE)
a<-table.element(a,round(mypacf[i],6))
mytstat <- mypacf[i]*sqrtn
a<-table.element(a,round(mytstat,4))
a<-table.element(a,round(1-pt(abs(mytstat),lengthx),6))
a<-table.row.end(a)
}
a<-table.end(a)
table.save(a,file='mytable1.tab')