Free Statistics

of Irreproducible Research!

Author's title

Author*Unverified author*
R Software Modulerwasp_autocorrelation.wasp
Title produced by software(Partial) Autocorrelation Function
Date of computationThu, 16 Mar 2017 10:10:44 +0000
Cite this page as followsStatistical Computations at FreeStatistics.org, Office for Research Development and Education, URL https://freestatistics.org/blog/index.php?v=date/2017/Mar/16/t14896590981hcbqrr2yv2yjc5.htm/, Retrieved Tue, 14 May 2024 11:18:15 +0200
Statistical Computations at FreeStatistics.org, Office for Research Development and Education, URL https://freestatistics.org/blog/index.php?pk=, Retrieved Tue, 14 May 2024 11:18:15 +0200
QR Codes:

Original text written by user:
IsPrivate?No (this computation is public)
User-defined keywords
Estimated Impact0
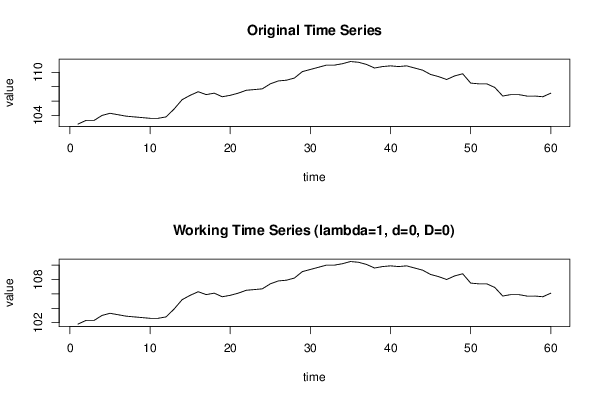
Dataseries X:
102,8
103,3
103,3
104
104,3
104,1
103,9
103,8
103,7
103,6
103,6
103,8
104,9
106,2
106,8
107,3
106,9
107,1
106,6
106,8
107,1
107,5
107,6
107,7
108,4
108,8
108,9
109,2
110,1
110,4
110,7
111
111
111,2
111,5
111,4
111,1
110,6
110,8
110,9
110,8
110,9
110,6
110,3
109,7
109,4
109
109,5
109,8
108,5
108,4
108,4
107,9
106,7
106,9
106,9
106,7
106,7
106,6
107,1


Summary of computational transaction
Raw Inputview raw input (R code)
Raw Outputview raw output of R engine
Computing time2 seconds
R Server'Sir Maurice George Kendall' @ kendall.wessa.net

\begin{tabular}{lllllllll}
\hline
Summary of computational transaction \tabularnewline
Raw Input & view raw input (R code)  \tabularnewline
Raw Output & view raw output of R engine  \tabularnewline
Computing time & 2 seconds \tabularnewline
R Server & 'Sir Maurice George Kendall' @ kendall.wessa.net \tabularnewline
\hline
\end{tabular}
%Source: https://freestatistics.org/blog/index.php?pk=&T=0

[TABLE]
[ROW][C]Summary of computational transaction[/C][/ROW]
[ROW][C]Raw Input[/C][C]view raw input (R code) [/C][/ROW]
[ROW][C]Raw Output[/C][C]view raw output of R engine [/C][/ROW]
[ROW][C]Computing time[/C][C]2 seconds[/C][/ROW]
[ROW][C]R Server[/C][C]'Sir Maurice George Kendall' @ kendall.wessa.net[/C][/ROW]
[/TABLE]
Source: https://freestatistics.org/blog/index.php?pk=&T=0

Globally Unique Identifier (entire table): ba.freestatistics.org/blog/index.php?pk=&T=0

As an alternative you can also use a QR Code:  

The GUIDs for individual cells are displayed in the table below:

Summary of computational transaction
Raw Inputview raw input (R code)
Raw Outputview raw output of R engine
Computing time2 seconds
R Server'Sir Maurice George Kendall' @ kendall.wessa.net


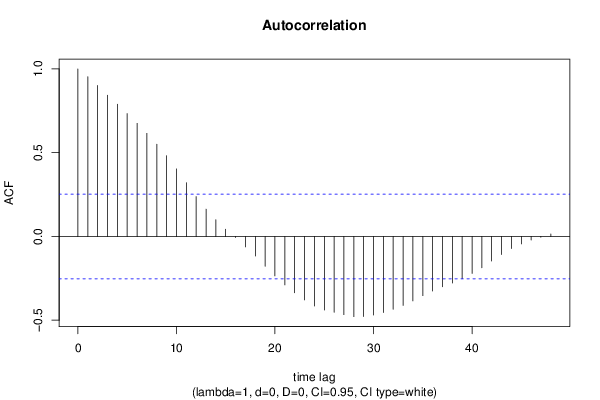
Autocorrelation Function
Time lag kACF(k)T-STATP-value
10.9533537.38460
20.9008016.97760
30.8432326.53160
40.7889736.11140
50.7332875.680
60.6752535.23051e-06
70.6156114.76856e-06
80.5510644.26853.6e-05
90.4818443.73240.000212
100.4033733.12450.001371
110.3211152.48730.007834
120.2381221.84450.035025
130.1630671.26310.105717
140.1002220.77630.220305
150.0430420.33340.369996
16-0.006224-0.04820.480854
17-0.062361-0.4830.315409
18-0.117061-0.90670.184084
19-0.177475-1.37470.087166
20-0.23527-1.82240.036689
21-0.288946-2.23820.014467
22-0.336447-2.60610.005767
23-0.378579-2.93250.002377
24-0.415372-3.21750.001043
25-0.438989-3.40040.000601
26-0.452399-3.50430.000436
27-0.466576-3.61410.000309
28-0.478611-3.70730.00023
29-0.477577-3.69930.000236
30-0.468578-3.62960.000294
31-0.454078-3.51730.000419
32-0.434578-3.36620.000667
33-0.411342-3.18620.001144
34-0.384469-2.97810.00209
35-0.353061-2.73480.004097
36-0.325956-2.52480.007118
37-0.299818-2.32240.011812
38-0.277636-2.15060.017775
39-0.251002-1.94430.028279
40-0.220216-1.70580.04661
41-0.18634-1.44340.077057
42-0.146265-1.1330.130868
43-0.107861-0.83550.203379
44-0.071875-0.55670.289888
45-0.044468-0.34440.365857
46-0.021357-0.16540.43458
47-0.004263-0.0330.486884
480.014590.1130.455199

\begin{tabular}{lllllllll}
\hline
Autocorrelation Function \tabularnewline
Time lag k & ACF(k) & T-STAT & P-value \tabularnewline
1 & 0.953353 & 7.3846 & 0 \tabularnewline
2 & 0.900801 & 6.9776 & 0 \tabularnewline
3 & 0.843232 & 6.5316 & 0 \tabularnewline
4 & 0.788973 & 6.1114 & 0 \tabularnewline
5 & 0.733287 & 5.68 & 0 \tabularnewline
6 & 0.675253 & 5.2305 & 1e-06 \tabularnewline
7 & 0.615611 & 4.7685 & 6e-06 \tabularnewline
8 & 0.551064 & 4.2685 & 3.6e-05 \tabularnewline
9 & 0.481844 & 3.7324 & 0.000212 \tabularnewline
10 & 0.403373 & 3.1245 & 0.001371 \tabularnewline
11 & 0.321115 & 2.4873 & 0.007834 \tabularnewline
12 & 0.238122 & 1.8445 & 0.035025 \tabularnewline
13 & 0.163067 & 1.2631 & 0.105717 \tabularnewline
14 & 0.100222 & 0.7763 & 0.220305 \tabularnewline
15 & 0.043042 & 0.3334 & 0.369996 \tabularnewline
16 & -0.006224 & -0.0482 & 0.480854 \tabularnewline
17 & -0.062361 & -0.483 & 0.315409 \tabularnewline
18 & -0.117061 & -0.9067 & 0.184084 \tabularnewline
19 & -0.177475 & -1.3747 & 0.087166 \tabularnewline
20 & -0.23527 & -1.8224 & 0.036689 \tabularnewline
21 & -0.288946 & -2.2382 & 0.014467 \tabularnewline
22 & -0.336447 & -2.6061 & 0.005767 \tabularnewline
23 & -0.378579 & -2.9325 & 0.002377 \tabularnewline
24 & -0.415372 & -3.2175 & 0.001043 \tabularnewline
25 & -0.438989 & -3.4004 & 0.000601 \tabularnewline
26 & -0.452399 & -3.5043 & 0.000436 \tabularnewline
27 & -0.466576 & -3.6141 & 0.000309 \tabularnewline
28 & -0.478611 & -3.7073 & 0.00023 \tabularnewline
29 & -0.477577 & -3.6993 & 0.000236 \tabularnewline
30 & -0.468578 & -3.6296 & 0.000294 \tabularnewline
31 & -0.454078 & -3.5173 & 0.000419 \tabularnewline
32 & -0.434578 & -3.3662 & 0.000667 \tabularnewline
33 & -0.411342 & -3.1862 & 0.001144 \tabularnewline
34 & -0.384469 & -2.9781 & 0.00209 \tabularnewline
35 & -0.353061 & -2.7348 & 0.004097 \tabularnewline
36 & -0.325956 & -2.5248 & 0.007118 \tabularnewline
37 & -0.299818 & -2.3224 & 0.011812 \tabularnewline
38 & -0.277636 & -2.1506 & 0.017775 \tabularnewline
39 & -0.251002 & -1.9443 & 0.028279 \tabularnewline
40 & -0.220216 & -1.7058 & 0.04661 \tabularnewline
41 & -0.18634 & -1.4434 & 0.077057 \tabularnewline
42 & -0.146265 & -1.133 & 0.130868 \tabularnewline
43 & -0.107861 & -0.8355 & 0.203379 \tabularnewline
44 & -0.071875 & -0.5567 & 0.289888 \tabularnewline
45 & -0.044468 & -0.3444 & 0.365857 \tabularnewline
46 & -0.021357 & -0.1654 & 0.43458 \tabularnewline
47 & -0.004263 & -0.033 & 0.486884 \tabularnewline
48 & 0.01459 & 0.113 & 0.455199 \tabularnewline
\hline
\end{tabular}
%Source: https://freestatistics.org/blog/index.php?pk=&T=1

[TABLE]
[ROW][C]Autocorrelation Function[/C][/ROW]
[ROW][C]Time lag k[/C][C]ACF(k)[/C][C]T-STAT[/C][C]P-value[/C][/ROW]
[ROW][C]1[/C][C]0.953353[/C][C]7.3846[/C][C]0[/C][/ROW]
[ROW][C]2[/C][C]0.900801[/C][C]6.9776[/C][C]0[/C][/ROW]
[ROW][C]3[/C][C]0.843232[/C][C]6.5316[/C][C]0[/C][/ROW]
[ROW][C]4[/C][C]0.788973[/C][C]6.1114[/C][C]0[/C][/ROW]
[ROW][C]5[/C][C]0.733287[/C][C]5.68[/C][C]0[/C][/ROW]
[ROW][C]6[/C][C]0.675253[/C][C]5.2305[/C][C]1e-06[/C][/ROW]
[ROW][C]7[/C][C]0.615611[/C][C]4.7685[/C][C]6e-06[/C][/ROW]
[ROW][C]8[/C][C]0.551064[/C][C]4.2685[/C][C]3.6e-05[/C][/ROW]
[ROW][C]9[/C][C]0.481844[/C][C]3.7324[/C][C]0.000212[/C][/ROW]
[ROW][C]10[/C][C]0.403373[/C][C]3.1245[/C][C]0.001371[/C][/ROW]
[ROW][C]11[/C][C]0.321115[/C][C]2.4873[/C][C]0.007834[/C][/ROW]
[ROW][C]12[/C][C]0.238122[/C][C]1.8445[/C][C]0.035025[/C][/ROW]
[ROW][C]13[/C][C]0.163067[/C][C]1.2631[/C][C]0.105717[/C][/ROW]
[ROW][C]14[/C][C]0.100222[/C][C]0.7763[/C][C]0.220305[/C][/ROW]
[ROW][C]15[/C][C]0.043042[/C][C]0.3334[/C][C]0.369996[/C][/ROW]
[ROW][C]16[/C][C]-0.006224[/C][C]-0.0482[/C][C]0.480854[/C][/ROW]
[ROW][C]17[/C][C]-0.062361[/C][C]-0.483[/C][C]0.315409[/C][/ROW]
[ROW][C]18[/C][C]-0.117061[/C][C]-0.9067[/C][C]0.184084[/C][/ROW]
[ROW][C]19[/C][C]-0.177475[/C][C]-1.3747[/C][C]0.087166[/C][/ROW]
[ROW][C]20[/C][C]-0.23527[/C][C]-1.8224[/C][C]0.036689[/C][/ROW]
[ROW][C]21[/C][C]-0.288946[/C][C]-2.2382[/C][C]0.014467[/C][/ROW]
[ROW][C]22[/C][C]-0.336447[/C][C]-2.6061[/C][C]0.005767[/C][/ROW]
[ROW][C]23[/C][C]-0.378579[/C][C]-2.9325[/C][C]0.002377[/C][/ROW]
[ROW][C]24[/C][C]-0.415372[/C][C]-3.2175[/C][C]0.001043[/C][/ROW]
[ROW][C]25[/C][C]-0.438989[/C][C]-3.4004[/C][C]0.000601[/C][/ROW]
[ROW][C]26[/C][C]-0.452399[/C][C]-3.5043[/C][C]0.000436[/C][/ROW]
[ROW][C]27[/C][C]-0.466576[/C][C]-3.6141[/C][C]0.000309[/C][/ROW]
[ROW][C]28[/C][C]-0.478611[/C][C]-3.7073[/C][C]0.00023[/C][/ROW]
[ROW][C]29[/C][C]-0.477577[/C][C]-3.6993[/C][C]0.000236[/C][/ROW]
[ROW][C]30[/C][C]-0.468578[/C][C]-3.6296[/C][C]0.000294[/C][/ROW]
[ROW][C]31[/C][C]-0.454078[/C][C]-3.5173[/C][C]0.000419[/C][/ROW]
[ROW][C]32[/C][C]-0.434578[/C][C]-3.3662[/C][C]0.000667[/C][/ROW]
[ROW][C]33[/C][C]-0.411342[/C][C]-3.1862[/C][C]0.001144[/C][/ROW]
[ROW][C]34[/C][C]-0.384469[/C][C]-2.9781[/C][C]0.00209[/C][/ROW]
[ROW][C]35[/C][C]-0.353061[/C][C]-2.7348[/C][C]0.004097[/C][/ROW]
[ROW][C]36[/C][C]-0.325956[/C][C]-2.5248[/C][C]0.007118[/C][/ROW]
[ROW][C]37[/C][C]-0.299818[/C][C]-2.3224[/C][C]0.011812[/C][/ROW]
[ROW][C]38[/C][C]-0.277636[/C][C]-2.1506[/C][C]0.017775[/C][/ROW]
[ROW][C]39[/C][C]-0.251002[/C][C]-1.9443[/C][C]0.028279[/C][/ROW]
[ROW][C]40[/C][C]-0.220216[/C][C]-1.7058[/C][C]0.04661[/C][/ROW]
[ROW][C]41[/C][C]-0.18634[/C][C]-1.4434[/C][C]0.077057[/C][/ROW]
[ROW][C]42[/C][C]-0.146265[/C][C]-1.133[/C][C]0.130868[/C][/ROW]
[ROW][C]43[/C][C]-0.107861[/C][C]-0.8355[/C][C]0.203379[/C][/ROW]
[ROW][C]44[/C][C]-0.071875[/C][C]-0.5567[/C][C]0.289888[/C][/ROW]
[ROW][C]45[/C][C]-0.044468[/C][C]-0.3444[/C][C]0.365857[/C][/ROW]
[ROW][C]46[/C][C]-0.021357[/C][C]-0.1654[/C][C]0.43458[/C][/ROW]
[ROW][C]47[/C][C]-0.004263[/C][C]-0.033[/C][C]0.486884[/C][/ROW]
[ROW][C]48[/C][C]0.01459[/C][C]0.113[/C][C]0.455199[/C][/ROW]
[/TABLE]
Source: https://freestatistics.org/blog/index.php?pk=&T=1

Globally Unique Identifier (entire table): ba.freestatistics.org/blog/index.php?pk=&T=1

As an alternative you can also use a QR Code:  

The GUIDs for individual cells are displayed in the table below:

Autocorrelation Function
Time lag kACF(k)T-STATP-value
10.9533537.38460
20.9008016.97760
30.8432326.53160
40.7889736.11140
50.7332875.680
60.6752535.23051e-06
70.6156114.76856e-06
80.5510644.26853.6e-05
90.4818443.73240.000212
100.4033733.12450.001371
110.3211152.48730.007834
120.2381221.84450.035025
130.1630671.26310.105717
140.1002220.77630.220305
150.0430420.33340.369996
16-0.006224-0.04820.480854
17-0.062361-0.4830.315409
18-0.117061-0.90670.184084
19-0.177475-1.37470.087166
20-0.23527-1.82240.036689
21-0.288946-2.23820.014467
22-0.336447-2.60610.005767
23-0.378579-2.93250.002377
24-0.415372-3.21750.001043
25-0.438989-3.40040.000601
26-0.452399-3.50430.000436
27-0.466576-3.61410.000309
28-0.478611-3.70730.00023
29-0.477577-3.69930.000236
30-0.468578-3.62960.000294
31-0.454078-3.51730.000419
32-0.434578-3.36620.000667
33-0.411342-3.18620.001144
34-0.384469-2.97810.00209
35-0.353061-2.73480.004097
36-0.325956-2.52480.007118
37-0.299818-2.32240.011812
38-0.277636-2.15060.017775
39-0.251002-1.94430.028279
40-0.220216-1.70580.04661
41-0.18634-1.44340.077057
42-0.146265-1.1330.130868
43-0.107861-0.83550.203379
44-0.071875-0.55670.289888
45-0.044468-0.34440.365857
46-0.021357-0.16540.43458
47-0.004263-0.0330.486884
480.014590.1130.455199


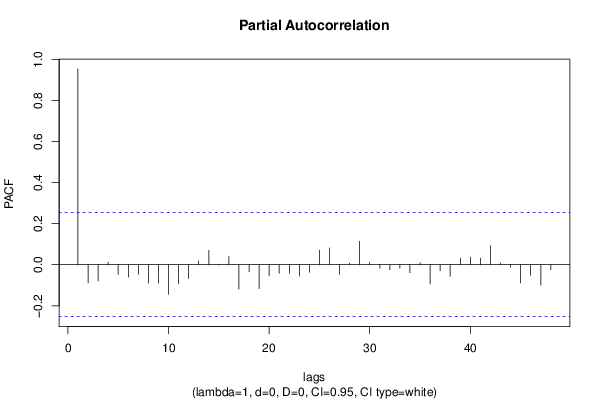
Partial Autocorrelation Function
Time lag kPACF(k)T-STATP-value
10.9533537.38460
2-0.088672-0.68690.247411
3-0.079239-0.61380.270839
40.0117140.09070.464002
5-0.048083-0.37240.355436
6-0.060538-0.46890.32041
7-0.046328-0.35890.36048
8-0.088863-0.68830.246949
9-0.089514-0.69340.245375
10-0.143243-1.10960.13581
11-0.092976-0.72020.237104
12-0.067063-0.51950.302674
130.0173030.1340.446914
140.0697930.54060.295388
15-0.001041-0.00810.496797
160.0393970.30520.380648
17-0.11913-0.92280.17991
18-0.034806-0.26960.394195
19-0.11566-0.89590.186943
20-0.054618-0.42310.336879
21-0.041947-0.32490.373186
22-0.042163-0.32660.372555
23-0.055506-0.42990.334388
24-0.036633-0.28380.388786
250.0708630.54890.292556
260.0812130.62910.265844
27-0.04686-0.3630.35895
280.0067690.05240.479178
290.11360.87990.1912
300.0118660.09190.463537
31-0.01679-0.13010.44848
32-0.024674-0.19110.424537
33-0.016583-0.12840.449111
34-0.038517-0.29840.383232
350.00980.07590.46987
36-0.093313-0.72280.236307
37-0.029414-0.22780.410271
38-0.056498-0.43760.331613
390.0320780.24850.402307
400.0366450.28380.388752
410.0328920.25480.399883
420.0924940.71650.238245
430.0083310.06450.474381
44-0.01212-0.09390.462757
45-0.088618-0.68640.247543
46-0.052141-0.40390.343868
47-0.100057-0.7750.220679
48-0.023869-0.18490.426971

\begin{tabular}{lllllllll}
\hline
Partial Autocorrelation Function \tabularnewline
Time lag k & PACF(k) & T-STAT & P-value \tabularnewline
1 & 0.953353 & 7.3846 & 0 \tabularnewline
2 & -0.088672 & -0.6869 & 0.247411 \tabularnewline
3 & -0.079239 & -0.6138 & 0.270839 \tabularnewline
4 & 0.011714 & 0.0907 & 0.464002 \tabularnewline
5 & -0.048083 & -0.3724 & 0.355436 \tabularnewline
6 & -0.060538 & -0.4689 & 0.32041 \tabularnewline
7 & -0.046328 & -0.3589 & 0.36048 \tabularnewline
8 & -0.088863 & -0.6883 & 0.246949 \tabularnewline
9 & -0.089514 & -0.6934 & 0.245375 \tabularnewline
10 & -0.143243 & -1.1096 & 0.13581 \tabularnewline
11 & -0.092976 & -0.7202 & 0.237104 \tabularnewline
12 & -0.067063 & -0.5195 & 0.302674 \tabularnewline
13 & 0.017303 & 0.134 & 0.446914 \tabularnewline
14 & 0.069793 & 0.5406 & 0.295388 \tabularnewline
15 & -0.001041 & -0.0081 & 0.496797 \tabularnewline
16 & 0.039397 & 0.3052 & 0.380648 \tabularnewline
17 & -0.11913 & -0.9228 & 0.17991 \tabularnewline
18 & -0.034806 & -0.2696 & 0.394195 \tabularnewline
19 & -0.11566 & -0.8959 & 0.186943 \tabularnewline
20 & -0.054618 & -0.4231 & 0.336879 \tabularnewline
21 & -0.041947 & -0.3249 & 0.373186 \tabularnewline
22 & -0.042163 & -0.3266 & 0.372555 \tabularnewline
23 & -0.055506 & -0.4299 & 0.334388 \tabularnewline
24 & -0.036633 & -0.2838 & 0.388786 \tabularnewline
25 & 0.070863 & 0.5489 & 0.292556 \tabularnewline
26 & 0.081213 & 0.6291 & 0.265844 \tabularnewline
27 & -0.04686 & -0.363 & 0.35895 \tabularnewline
28 & 0.006769 & 0.0524 & 0.479178 \tabularnewline
29 & 0.1136 & 0.8799 & 0.1912 \tabularnewline
30 & 0.011866 & 0.0919 & 0.463537 \tabularnewline
31 & -0.01679 & -0.1301 & 0.44848 \tabularnewline
32 & -0.024674 & -0.1911 & 0.424537 \tabularnewline
33 & -0.016583 & -0.1284 & 0.449111 \tabularnewline
34 & -0.038517 & -0.2984 & 0.383232 \tabularnewline
35 & 0.0098 & 0.0759 & 0.46987 \tabularnewline
36 & -0.093313 & -0.7228 & 0.236307 \tabularnewline
37 & -0.029414 & -0.2278 & 0.410271 \tabularnewline
38 & -0.056498 & -0.4376 & 0.331613 \tabularnewline
39 & 0.032078 & 0.2485 & 0.402307 \tabularnewline
40 & 0.036645 & 0.2838 & 0.388752 \tabularnewline
41 & 0.032892 & 0.2548 & 0.399883 \tabularnewline
42 & 0.092494 & 0.7165 & 0.238245 \tabularnewline
43 & 0.008331 & 0.0645 & 0.474381 \tabularnewline
44 & -0.01212 & -0.0939 & 0.462757 \tabularnewline
45 & -0.088618 & -0.6864 & 0.247543 \tabularnewline
46 & -0.052141 & -0.4039 & 0.343868 \tabularnewline
47 & -0.100057 & -0.775 & 0.220679 \tabularnewline
48 & -0.023869 & -0.1849 & 0.426971 \tabularnewline
\hline
\end{tabular}
%Source: https://freestatistics.org/blog/index.php?pk=&T=2

[TABLE]
[ROW][C]Partial Autocorrelation Function[/C][/ROW]
[ROW][C]Time lag k[/C][C]PACF(k)[/C][C]T-STAT[/C][C]P-value[/C][/ROW]
[ROW][C]1[/C][C]0.953353[/C][C]7.3846[/C][C]0[/C][/ROW]
[ROW][C]2[/C][C]-0.088672[/C][C]-0.6869[/C][C]0.247411[/C][/ROW]
[ROW][C]3[/C][C]-0.079239[/C][C]-0.6138[/C][C]0.270839[/C][/ROW]
[ROW][C]4[/C][C]0.011714[/C][C]0.0907[/C][C]0.464002[/C][/ROW]
[ROW][C]5[/C][C]-0.048083[/C][C]-0.3724[/C][C]0.355436[/C][/ROW]
[ROW][C]6[/C][C]-0.060538[/C][C]-0.4689[/C][C]0.32041[/C][/ROW]
[ROW][C]7[/C][C]-0.046328[/C][C]-0.3589[/C][C]0.36048[/C][/ROW]
[ROW][C]8[/C][C]-0.088863[/C][C]-0.6883[/C][C]0.246949[/C][/ROW]
[ROW][C]9[/C][C]-0.089514[/C][C]-0.6934[/C][C]0.245375[/C][/ROW]
[ROW][C]10[/C][C]-0.143243[/C][C]-1.1096[/C][C]0.13581[/C][/ROW]
[ROW][C]11[/C][C]-0.092976[/C][C]-0.7202[/C][C]0.237104[/C][/ROW]
[ROW][C]12[/C][C]-0.067063[/C][C]-0.5195[/C][C]0.302674[/C][/ROW]
[ROW][C]13[/C][C]0.017303[/C][C]0.134[/C][C]0.446914[/C][/ROW]
[ROW][C]14[/C][C]0.069793[/C][C]0.5406[/C][C]0.295388[/C][/ROW]
[ROW][C]15[/C][C]-0.001041[/C][C]-0.0081[/C][C]0.496797[/C][/ROW]
[ROW][C]16[/C][C]0.039397[/C][C]0.3052[/C][C]0.380648[/C][/ROW]
[ROW][C]17[/C][C]-0.11913[/C][C]-0.9228[/C][C]0.17991[/C][/ROW]
[ROW][C]18[/C][C]-0.034806[/C][C]-0.2696[/C][C]0.394195[/C][/ROW]
[ROW][C]19[/C][C]-0.11566[/C][C]-0.8959[/C][C]0.186943[/C][/ROW]
[ROW][C]20[/C][C]-0.054618[/C][C]-0.4231[/C][C]0.336879[/C][/ROW]
[ROW][C]21[/C][C]-0.041947[/C][C]-0.3249[/C][C]0.373186[/C][/ROW]
[ROW][C]22[/C][C]-0.042163[/C][C]-0.3266[/C][C]0.372555[/C][/ROW]
[ROW][C]23[/C][C]-0.055506[/C][C]-0.4299[/C][C]0.334388[/C][/ROW]
[ROW][C]24[/C][C]-0.036633[/C][C]-0.2838[/C][C]0.388786[/C][/ROW]
[ROW][C]25[/C][C]0.070863[/C][C]0.5489[/C][C]0.292556[/C][/ROW]
[ROW][C]26[/C][C]0.081213[/C][C]0.6291[/C][C]0.265844[/C][/ROW]
[ROW][C]27[/C][C]-0.04686[/C][C]-0.363[/C][C]0.35895[/C][/ROW]
[ROW][C]28[/C][C]0.006769[/C][C]0.0524[/C][C]0.479178[/C][/ROW]
[ROW][C]29[/C][C]0.1136[/C][C]0.8799[/C][C]0.1912[/C][/ROW]
[ROW][C]30[/C][C]0.011866[/C][C]0.0919[/C][C]0.463537[/C][/ROW]
[ROW][C]31[/C][C]-0.01679[/C][C]-0.1301[/C][C]0.44848[/C][/ROW]
[ROW][C]32[/C][C]-0.024674[/C][C]-0.1911[/C][C]0.424537[/C][/ROW]
[ROW][C]33[/C][C]-0.016583[/C][C]-0.1284[/C][C]0.449111[/C][/ROW]
[ROW][C]34[/C][C]-0.038517[/C][C]-0.2984[/C][C]0.383232[/C][/ROW]
[ROW][C]35[/C][C]0.0098[/C][C]0.0759[/C][C]0.46987[/C][/ROW]
[ROW][C]36[/C][C]-0.093313[/C][C]-0.7228[/C][C]0.236307[/C][/ROW]
[ROW][C]37[/C][C]-0.029414[/C][C]-0.2278[/C][C]0.410271[/C][/ROW]
[ROW][C]38[/C][C]-0.056498[/C][C]-0.4376[/C][C]0.331613[/C][/ROW]
[ROW][C]39[/C][C]0.032078[/C][C]0.2485[/C][C]0.402307[/C][/ROW]
[ROW][C]40[/C][C]0.036645[/C][C]0.2838[/C][C]0.388752[/C][/ROW]
[ROW][C]41[/C][C]0.032892[/C][C]0.2548[/C][C]0.399883[/C][/ROW]
[ROW][C]42[/C][C]0.092494[/C][C]0.7165[/C][C]0.238245[/C][/ROW]
[ROW][C]43[/C][C]0.008331[/C][C]0.0645[/C][C]0.474381[/C][/ROW]
[ROW][C]44[/C][C]-0.01212[/C][C]-0.0939[/C][C]0.462757[/C][/ROW]
[ROW][C]45[/C][C]-0.088618[/C][C]-0.6864[/C][C]0.247543[/C][/ROW]
[ROW][C]46[/C][C]-0.052141[/C][C]-0.4039[/C][C]0.343868[/C][/ROW]
[ROW][C]47[/C][C]-0.100057[/C][C]-0.775[/C][C]0.220679[/C][/ROW]
[ROW][C]48[/C][C]-0.023869[/C][C]-0.1849[/C][C]0.426971[/C][/ROW]
[/TABLE]
Source: https://freestatistics.org/blog/index.php?pk=&T=2

Globally Unique Identifier (entire table): ba.freestatistics.org/blog/index.php?pk=&T=2

As an alternative you can also use a QR Code:  

The GUIDs for individual cells are displayed in the table below:

Partial Autocorrelation Function
Time lag kPACF(k)T-STATP-value
10.9533537.38460
2-0.088672-0.68690.247411
3-0.079239-0.61380.270839
40.0117140.09070.464002
5-0.048083-0.37240.355436
6-0.060538-0.46890.32041
7-0.046328-0.35890.36048
8-0.088863-0.68830.246949
9-0.089514-0.69340.245375
10-0.143243-1.10960.13581
11-0.092976-0.72020.237104
12-0.067063-0.51950.302674
130.0173030.1340.446914
140.0697930.54060.295388
15-0.001041-0.00810.496797
160.0393970.30520.380648
17-0.11913-0.92280.17991
18-0.034806-0.26960.394195
19-0.11566-0.89590.186943
20-0.054618-0.42310.336879
21-0.041947-0.32490.373186
22-0.042163-0.32660.372555
23-0.055506-0.42990.334388
24-0.036633-0.28380.388786
250.0708630.54890.292556
260.0812130.62910.265844
27-0.04686-0.3630.35895
280.0067690.05240.479178
290.11360.87990.1912
300.0118660.09190.463537
31-0.01679-0.13010.44848
32-0.024674-0.19110.424537
33-0.016583-0.12840.449111
34-0.038517-0.29840.383232
350.00980.07590.46987
36-0.093313-0.72280.236307
37-0.029414-0.22780.410271
38-0.056498-0.43760.331613
390.0320780.24850.402307
400.0366450.28380.388752
410.0328920.25480.399883
420.0924940.71650.238245
430.0083310.06450.474381
44-0.01212-0.09390.462757
45-0.088618-0.68640.247543
46-0.052141-0.40390.343868
47-0.100057-0.7750.220679
48-0.023869-0.18490.426971


Parameters (Session):
par1 = 48 ; par2 = 1 ; par3 = 0 ; par4 = 0 ; par5 = 12 ; par6 = White Noise ; par7 = 0.95 ;
Parameters (R input):
par1 = 48 ; par2 = 1 ; par3 = 0 ; par4 = 0 ; par5 = 12 ; par6 = White Noise ; par7 = 0.95 ; par8 = ;
R code (references can be found in the software module):
if (par1 == 'Default') {
par1 = 10*log10(length(x))
} else {
par1 <- as.numeric(par1)
}
par2 <- as.numeric(par2)
par3 <- as.numeric(par3)
par4 <- as.numeric(par4)
par5 <- as.numeric(par5)
if (par6 == 'White Noise') par6 <- 'white' else par6 <- 'ma'
par7 <- as.numeric(par7)
if (par8 != '') par8 <- as.numeric(par8)
x <- na.omit(x)
ox <- x
if (par8 == '') {
if (par2 == 0) {
x <- log(x)
} else {
x <- (x ^ par2 - 1) / par2
}
} else {
x <- log(x,base=par8)
}
if (par3 > 0) x <- diff(x,lag=1,difference=par3)
if (par4 > 0) x <- diff(x,lag=par5,difference=par4)
bitmap(file='picts.png')
op <- par(mfrow=c(2,1))
plot(ox,type='l',main='Original Time Series',xlab='time',ylab='value')
if (par8=='') {
mytitle <- paste('Working Time Series (lambda=',par2,', d=',par3,', D=',par4,')',sep='')
mysub <- paste('(lambda=',par2,', d=',par3,', D=',par4,', CI=', par7, ', CI type=',par6,')',sep='')
} else {
mytitle <- paste('Working Time Series (base=',par8,', d=',par3,', D=',par4,')',sep='')
mysub <- paste('(base=',par8,', d=',par3,', D=',par4,', CI=', par7, ', CI type=',par6,')',sep='')
}
plot(x,type='l', main=mytitle,xlab='time',ylab='value')
par(op)
dev.off()
bitmap(file='pic1.png')
racf <- acf(x, par1, main='Autocorrelation', xlab='time lag', ylab='ACF', ci.type=par6, ci=par7, sub=mysub)
dev.off()
bitmap(file='pic2.png')
rpacf <- pacf(x,par1,main='Partial Autocorrelation',xlab='lags',ylab='PACF',sub=mysub)
dev.off()
(myacf <- c(racf$acf))
(mypacf <- c(rpacf$acf))
lengthx <- length(x)
sqrtn <- sqrt(lengthx)
load(file='createtable')
a<-table.start()
a<-table.row.start(a)
a<-table.element(a,'Autocorrelation Function',4,TRUE)
a<-table.row.end(a)
a<-table.row.start(a)
a<-table.element(a,'Time lag k',header=TRUE)
a<-table.element(a,hyperlink('basics.htm','ACF(k)','click here for more information about the Autocorrelation Function'),header=TRUE)
a<-table.element(a,'T-STAT',header=TRUE)
a<-table.element(a,'P-value',header=TRUE)
a<-table.row.end(a)
for (i in 2:(par1+1)) {
a<-table.row.start(a)
a<-table.element(a,i-1,header=TRUE)
a<-table.element(a,round(myacf[i],6))
mytstat <- myacf[i]*sqrtn
a<-table.element(a,round(mytstat,4))
a<-table.element(a,round(1-pt(abs(mytstat),lengthx),6))
a<-table.row.end(a)
}
a<-table.end(a)
table.save(a,file='mytable.tab')
a<-table.start()
a<-table.row.start(a)
a<-table.element(a,'Partial Autocorrelation Function',4,TRUE)
a<-table.row.end(a)
a<-table.row.start(a)
a<-table.element(a,'Time lag k',header=TRUE)
a<-table.element(a,hyperlink('basics.htm','PACF(k)','click here for more information about the Partial Autocorrelation Function'),header=TRUE)
a<-table.element(a,'T-STAT',header=TRUE)
a<-table.element(a,'P-value',header=TRUE)
a<-table.row.end(a)
for (i in 1:par1) {
a<-table.row.start(a)
a<-table.element(a,i,header=TRUE)
a<-table.element(a,round(mypacf[i],6))
mytstat <- mypacf[i]*sqrtn
a<-table.element(a,round(mytstat,4))
a<-table.element(a,round(1-pt(abs(mytstat),lengthx),6))
a<-table.row.end(a)
}
a<-table.end(a)
table.save(a,file='mytable1.tab')