Free Statistics

of Irreproducible Research!

Author's title

Author*Unverified author*
R Software Modulerwasp_autocorrelation.wasp
Title produced by software(Partial) Autocorrelation Function
Date of computationThu, 16 Mar 2017 10:23:19 +0000
Cite this page as followsStatistical Computations at FreeStatistics.org, Office for Research Development and Education, URL https://freestatistics.org/blog/index.php?v=date/2017/Mar/16/t1489659843ym4vhxgvs0uxrjn.htm/, Retrieved Tue, 14 May 2024 13:51:56 +0200
Statistical Computations at FreeStatistics.org, Office for Research Development and Education, URL https://freestatistics.org/blog/index.php?pk=, Retrieved Tue, 14 May 2024 13:51:56 +0200
QR Codes:

Original text written by user:
IsPrivate?No (this computation is public)
User-defined keywords
Estimated Impact0
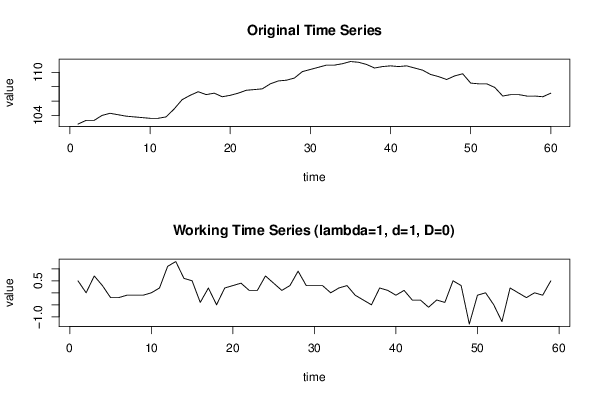
Dataseries X:
102.8
103.3
103.3
104
104.3
104.1
103.9
103.8
103.7
103.6
103.6
103.8
104.9
106.2
106.8
107.3
106.9
107.1
106.6
106.8
107.1
107.5
107.6
107.7
108.4
108.8
108.9
109.2
110.1
110.4
110.7
111
111
111.2
111.5
111.4
111.1
110.6
110.8
110.9
110.8
110.9
110.6
110.3
109.7
109.4
109
109.5
109.8
108.5
108.4
108.4
107.9
106.7
106.9
106.9
106.7
106.7
106.6
107.1


Summary of computational transaction
Raw Inputview raw input (R code)
Raw Outputview raw output of R engine
Computing time2 seconds
R Server'Gertrude Mary Cox' @ cox.wessa.net

\begin{tabular}{lllllllll}
\hline
Summary of computational transaction \tabularnewline
Raw Input & view raw input (R code)  \tabularnewline
Raw Output & view raw output of R engine  \tabularnewline
Computing time & 2 seconds \tabularnewline
R Server & 'Gertrude Mary Cox' @ cox.wessa.net \tabularnewline
\hline
\end{tabular}
%Source: https://freestatistics.org/blog/index.php?pk=&T=0

[TABLE]
[ROW][C]Summary of computational transaction[/C][/ROW]
[ROW][C]Raw Input[/C][C]view raw input (R code) [/C][/ROW]
[ROW][C]Raw Output[/C][C]view raw output of R engine [/C][/ROW]
[ROW][C]Computing time[/C][C]2 seconds[/C][/ROW]
[ROW][C]R Server[/C][C]'Gertrude Mary Cox' @ cox.wessa.net[/C][/ROW]
[/TABLE]
Source: https://freestatistics.org/blog/index.php?pk=&T=0

Globally Unique Identifier (entire table): ba.freestatistics.org/blog/index.php?pk=&T=0

As an alternative you can also use a QR Code:  

The GUIDs for individual cells are displayed in the table below:

Summary of computational transaction
Raw Inputview raw input (R code)
Raw Outputview raw output of R engine
Computing time2 seconds
R Server'Gertrude Mary Cox' @ cox.wessa.net


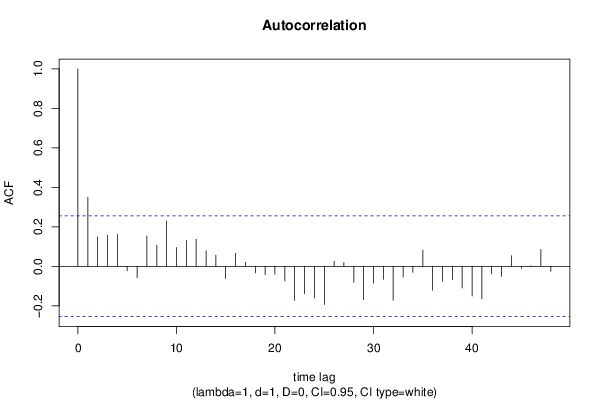
Autocorrelation Function
Time lag kACF(k)T-STATP-value
10.3493732.68360.004719
20.1479541.13650.13018
30.1574561.20940.115658
40.1609041.23590.110692
5-0.023046-0.1770.430049
6-0.057975-0.44530.328861
70.1539021.18210.120946
80.1063480.81690.208642
90.2293221.76150.041671
100.0952450.73160.233657
110.130931.00570.159335
120.1372311.05410.14807
130.0785830.60360.274208
140.0563490.43280.333359
15-0.061971-0.4760.317915
160.0662920.50920.306255
170.020910.16060.436473
18-0.033589-0.2580.398652
19-0.042085-0.32330.373821
20-0.039681-0.30480.380797
21-0.074081-0.5690.285749
22-0.172914-1.32820.094618
23-0.138788-1.0660.145372
24-0.160646-1.23390.111058
25-0.193779-1.48840.07098
260.0249880.19190.424226
270.0185110.14220.44371
28-0.080837-0.62090.268522
29-0.16884-1.29690.099859
30-0.085203-0.65450.25768
31-0.065623-0.50410.308047
32-0.171541-1.31760.09636
33-0.05401-0.41490.339875
34-0.0307-0.23580.407199
350.0823490.63250.26474
36-0.121004-0.92950.178221
37-0.076203-0.58530.280281
38-0.066631-0.51180.305351
39-0.110064-0.84540.200647
40-0.150366-1.1550.126378
41-0.16461-1.26440.105531
42-0.038435-0.29520.38443
43-0.050967-0.39150.348424
440.053480.41080.341359
45-0.010638-0.08170.467576
460.0007990.00610.497562
470.0850490.65330.25806
48-0.024446-0.18780.425848

\begin{tabular}{lllllllll}
\hline
Autocorrelation Function \tabularnewline
Time lag k & ACF(k) & T-STAT & P-value \tabularnewline
1 & 0.349373 & 2.6836 & 0.004719 \tabularnewline
2 & 0.147954 & 1.1365 & 0.13018 \tabularnewline
3 & 0.157456 & 1.2094 & 0.115658 \tabularnewline
4 & 0.160904 & 1.2359 & 0.110692 \tabularnewline
5 & -0.023046 & -0.177 & 0.430049 \tabularnewline
6 & -0.057975 & -0.4453 & 0.328861 \tabularnewline
7 & 0.153902 & 1.1821 & 0.120946 \tabularnewline
8 & 0.106348 & 0.8169 & 0.208642 \tabularnewline
9 & 0.229322 & 1.7615 & 0.041671 \tabularnewline
10 & 0.095245 & 0.7316 & 0.233657 \tabularnewline
11 & 0.13093 & 1.0057 & 0.159335 \tabularnewline
12 & 0.137231 & 1.0541 & 0.14807 \tabularnewline
13 & 0.078583 & 0.6036 & 0.274208 \tabularnewline
14 & 0.056349 & 0.4328 & 0.333359 \tabularnewline
15 & -0.061971 & -0.476 & 0.317915 \tabularnewline
16 & 0.066292 & 0.5092 & 0.306255 \tabularnewline
17 & 0.02091 & 0.1606 & 0.436473 \tabularnewline
18 & -0.033589 & -0.258 & 0.398652 \tabularnewline
19 & -0.042085 & -0.3233 & 0.373821 \tabularnewline
20 & -0.039681 & -0.3048 & 0.380797 \tabularnewline
21 & -0.074081 & -0.569 & 0.285749 \tabularnewline
22 & -0.172914 & -1.3282 & 0.094618 \tabularnewline
23 & -0.138788 & -1.066 & 0.145372 \tabularnewline
24 & -0.160646 & -1.2339 & 0.111058 \tabularnewline
25 & -0.193779 & -1.4884 & 0.07098 \tabularnewline
26 & 0.024988 & 0.1919 & 0.424226 \tabularnewline
27 & 0.018511 & 0.1422 & 0.44371 \tabularnewline
28 & -0.080837 & -0.6209 & 0.268522 \tabularnewline
29 & -0.16884 & -1.2969 & 0.099859 \tabularnewline
30 & -0.085203 & -0.6545 & 0.25768 \tabularnewline
31 & -0.065623 & -0.5041 & 0.308047 \tabularnewline
32 & -0.171541 & -1.3176 & 0.09636 \tabularnewline
33 & -0.05401 & -0.4149 & 0.339875 \tabularnewline
34 & -0.0307 & -0.2358 & 0.407199 \tabularnewline
35 & 0.082349 & 0.6325 & 0.26474 \tabularnewline
36 & -0.121004 & -0.9295 & 0.178221 \tabularnewline
37 & -0.076203 & -0.5853 & 0.280281 \tabularnewline
38 & -0.066631 & -0.5118 & 0.305351 \tabularnewline
39 & -0.110064 & -0.8454 & 0.200647 \tabularnewline
40 & -0.150366 & -1.155 & 0.126378 \tabularnewline
41 & -0.16461 & -1.2644 & 0.105531 \tabularnewline
42 & -0.038435 & -0.2952 & 0.38443 \tabularnewline
43 & -0.050967 & -0.3915 & 0.348424 \tabularnewline
44 & 0.05348 & 0.4108 & 0.341359 \tabularnewline
45 & -0.010638 & -0.0817 & 0.467576 \tabularnewline
46 & 0.000799 & 0.0061 & 0.497562 \tabularnewline
47 & 0.085049 & 0.6533 & 0.25806 \tabularnewline
48 & -0.024446 & -0.1878 & 0.425848 \tabularnewline
\hline
\end{tabular}
%Source: https://freestatistics.org/blog/index.php?pk=&T=1

[TABLE]
[ROW][C]Autocorrelation Function[/C][/ROW]
[ROW][C]Time lag k[/C][C]ACF(k)[/C][C]T-STAT[/C][C]P-value[/C][/ROW]
[ROW][C]1[/C][C]0.349373[/C][C]2.6836[/C][C]0.004719[/C][/ROW]
[ROW][C]2[/C][C]0.147954[/C][C]1.1365[/C][C]0.13018[/C][/ROW]
[ROW][C]3[/C][C]0.157456[/C][C]1.2094[/C][C]0.115658[/C][/ROW]
[ROW][C]4[/C][C]0.160904[/C][C]1.2359[/C][C]0.110692[/C][/ROW]
[ROW][C]5[/C][C]-0.023046[/C][C]-0.177[/C][C]0.430049[/C][/ROW]
[ROW][C]6[/C][C]-0.057975[/C][C]-0.4453[/C][C]0.328861[/C][/ROW]
[ROW][C]7[/C][C]0.153902[/C][C]1.1821[/C][C]0.120946[/C][/ROW]
[ROW][C]8[/C][C]0.106348[/C][C]0.8169[/C][C]0.208642[/C][/ROW]
[ROW][C]9[/C][C]0.229322[/C][C]1.7615[/C][C]0.041671[/C][/ROW]
[ROW][C]10[/C][C]0.095245[/C][C]0.7316[/C][C]0.233657[/C][/ROW]
[ROW][C]11[/C][C]0.13093[/C][C]1.0057[/C][C]0.159335[/C][/ROW]
[ROW][C]12[/C][C]0.137231[/C][C]1.0541[/C][C]0.14807[/C][/ROW]
[ROW][C]13[/C][C]0.078583[/C][C]0.6036[/C][C]0.274208[/C][/ROW]
[ROW][C]14[/C][C]0.056349[/C][C]0.4328[/C][C]0.333359[/C][/ROW]
[ROW][C]15[/C][C]-0.061971[/C][C]-0.476[/C][C]0.317915[/C][/ROW]
[ROW][C]16[/C][C]0.066292[/C][C]0.5092[/C][C]0.306255[/C][/ROW]
[ROW][C]17[/C][C]0.02091[/C][C]0.1606[/C][C]0.436473[/C][/ROW]
[ROW][C]18[/C][C]-0.033589[/C][C]-0.258[/C][C]0.398652[/C][/ROW]
[ROW][C]19[/C][C]-0.042085[/C][C]-0.3233[/C][C]0.373821[/C][/ROW]
[ROW][C]20[/C][C]-0.039681[/C][C]-0.3048[/C][C]0.380797[/C][/ROW]
[ROW][C]21[/C][C]-0.074081[/C][C]-0.569[/C][C]0.285749[/C][/ROW]
[ROW][C]22[/C][C]-0.172914[/C][C]-1.3282[/C][C]0.094618[/C][/ROW]
[ROW][C]23[/C][C]-0.138788[/C][C]-1.066[/C][C]0.145372[/C][/ROW]
[ROW][C]24[/C][C]-0.160646[/C][C]-1.2339[/C][C]0.111058[/C][/ROW]
[ROW][C]25[/C][C]-0.193779[/C][C]-1.4884[/C][C]0.07098[/C][/ROW]
[ROW][C]26[/C][C]0.024988[/C][C]0.1919[/C][C]0.424226[/C][/ROW]
[ROW][C]27[/C][C]0.018511[/C][C]0.1422[/C][C]0.44371[/C][/ROW]
[ROW][C]28[/C][C]-0.080837[/C][C]-0.6209[/C][C]0.268522[/C][/ROW]
[ROW][C]29[/C][C]-0.16884[/C][C]-1.2969[/C][C]0.099859[/C][/ROW]
[ROW][C]30[/C][C]-0.085203[/C][C]-0.6545[/C][C]0.25768[/C][/ROW]
[ROW][C]31[/C][C]-0.065623[/C][C]-0.5041[/C][C]0.308047[/C][/ROW]
[ROW][C]32[/C][C]-0.171541[/C][C]-1.3176[/C][C]0.09636[/C][/ROW]
[ROW][C]33[/C][C]-0.05401[/C][C]-0.4149[/C][C]0.339875[/C][/ROW]
[ROW][C]34[/C][C]-0.0307[/C][C]-0.2358[/C][C]0.407199[/C][/ROW]
[ROW][C]35[/C][C]0.082349[/C][C]0.6325[/C][C]0.26474[/C][/ROW]
[ROW][C]36[/C][C]-0.121004[/C][C]-0.9295[/C][C]0.178221[/C][/ROW]
[ROW][C]37[/C][C]-0.076203[/C][C]-0.5853[/C][C]0.280281[/C][/ROW]
[ROW][C]38[/C][C]-0.066631[/C][C]-0.5118[/C][C]0.305351[/C][/ROW]
[ROW][C]39[/C][C]-0.110064[/C][C]-0.8454[/C][C]0.200647[/C][/ROW]
[ROW][C]40[/C][C]-0.150366[/C][C]-1.155[/C][C]0.126378[/C][/ROW]
[ROW][C]41[/C][C]-0.16461[/C][C]-1.2644[/C][C]0.105531[/C][/ROW]
[ROW][C]42[/C][C]-0.038435[/C][C]-0.2952[/C][C]0.38443[/C][/ROW]
[ROW][C]43[/C][C]-0.050967[/C][C]-0.3915[/C][C]0.348424[/C][/ROW]
[ROW][C]44[/C][C]0.05348[/C][C]0.4108[/C][C]0.341359[/C][/ROW]
[ROW][C]45[/C][C]-0.010638[/C][C]-0.0817[/C][C]0.467576[/C][/ROW]
[ROW][C]46[/C][C]0.000799[/C][C]0.0061[/C][C]0.497562[/C][/ROW]
[ROW][C]47[/C][C]0.085049[/C][C]0.6533[/C][C]0.25806[/C][/ROW]
[ROW][C]48[/C][C]-0.024446[/C][C]-0.1878[/C][C]0.425848[/C][/ROW]
[/TABLE]
Source: https://freestatistics.org/blog/index.php?pk=&T=1

Globally Unique Identifier (entire table): ba.freestatistics.org/blog/index.php?pk=&T=1

As an alternative you can also use a QR Code:  

The GUIDs for individual cells are displayed in the table below:

Autocorrelation Function
Time lag kACF(k)T-STATP-value
10.3493732.68360.004719
20.1479541.13650.13018
30.1574561.20940.115658
40.1609041.23590.110692
5-0.023046-0.1770.430049
6-0.057975-0.44530.328861
70.1539021.18210.120946
80.1063480.81690.208642
90.2293221.76150.041671
100.0952450.73160.233657
110.130931.00570.159335
120.1372311.05410.14807
130.0785830.60360.274208
140.0563490.43280.333359
15-0.061971-0.4760.317915
160.0662920.50920.306255
170.020910.16060.436473
18-0.033589-0.2580.398652
19-0.042085-0.32330.373821
20-0.039681-0.30480.380797
21-0.074081-0.5690.285749
22-0.172914-1.32820.094618
23-0.138788-1.0660.145372
24-0.160646-1.23390.111058
25-0.193779-1.48840.07098
260.0249880.19190.424226
270.0185110.14220.44371
28-0.080837-0.62090.268522
29-0.16884-1.29690.099859
30-0.085203-0.65450.25768
31-0.065623-0.50410.308047
32-0.171541-1.31760.09636
33-0.05401-0.41490.339875
34-0.0307-0.23580.407199
350.0823490.63250.26474
36-0.121004-0.92950.178221
37-0.076203-0.58530.280281
38-0.066631-0.51180.305351
39-0.110064-0.84540.200647
40-0.150366-1.1550.126378
41-0.16461-1.26440.105531
42-0.038435-0.29520.38443
43-0.050967-0.39150.348424
440.053480.41080.341359
45-0.010638-0.08170.467576
460.0007990.00610.497562
470.0850490.65330.25806
48-0.024446-0.18780.425848


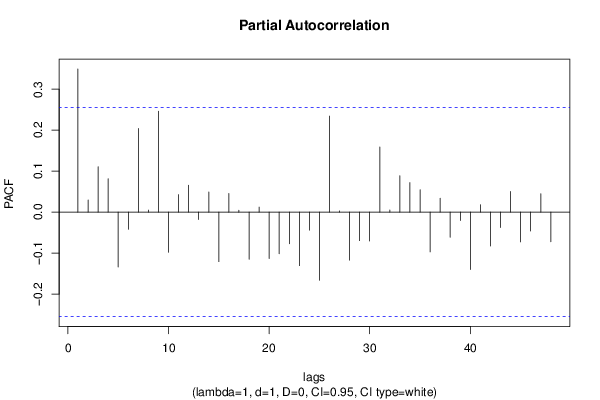
Partial Autocorrelation Function
Time lag kPACF(k)T-STATP-value
10.3493732.68360.004719
20.0294920.22650.410784
30.1105660.84930.199581
40.0814620.62570.266955
5-0.133897-1.02850.153961
6-0.041995-0.32260.374082
70.2041051.56780.061143
80.0048980.03760.485058
90.2463621.89230.031677
10-0.098114-0.75360.227034
110.042710.32810.372014
120.0654070.50240.308627
13-0.017919-0.13760.445497
140.0490930.37710.35373
15-0.120871-0.92840.178483
160.0452410.34750.364724
170.0046450.03570.485828
18-0.114964-0.88310.190395
190.0121010.0930.463129
20-0.113348-0.87060.193739
21-0.101484-0.77950.219397
22-0.077137-0.59250.277891
23-0.130685-1.00380.159784
24-0.044048-0.33830.368156
25-0.166153-1.27620.103435
260.2342561.79940.038539
270.0029410.02260.491028
28-0.117258-0.90070.185711
29-0.069687-0.53530.297234
30-0.070498-0.54150.2951
310.1590571.22170.113333
320.0050680.03890.484541
330.0887880.6820.248956
340.071930.55250.291345
350.0547750.42070.33774
36-0.097143-0.74620.229265
370.0339220.26060.397671
38-0.061301-0.47090.319737
39-0.020663-0.15870.437219
40-0.14006-1.07580.143194
410.0177830.13660.445907
42-0.082839-0.63630.263521
43-0.037785-0.29020.386329
440.0502230.38580.350527
45-0.072645-0.5580.289478
46-0.045968-0.35310.362642
470.044610.34270.366537
48-0.072225-0.55480.290575

\begin{tabular}{lllllllll}
\hline
Partial Autocorrelation Function \tabularnewline
Time lag k & PACF(k) & T-STAT & P-value \tabularnewline
1 & 0.349373 & 2.6836 & 0.004719 \tabularnewline
2 & 0.029492 & 0.2265 & 0.410784 \tabularnewline
3 & 0.110566 & 0.8493 & 0.199581 \tabularnewline
4 & 0.081462 & 0.6257 & 0.266955 \tabularnewline
5 & -0.133897 & -1.0285 & 0.153961 \tabularnewline
6 & -0.041995 & -0.3226 & 0.374082 \tabularnewline
7 & 0.204105 & 1.5678 & 0.061143 \tabularnewline
8 & 0.004898 & 0.0376 & 0.485058 \tabularnewline
9 & 0.246362 & 1.8923 & 0.031677 \tabularnewline
10 & -0.098114 & -0.7536 & 0.227034 \tabularnewline
11 & 0.04271 & 0.3281 & 0.372014 \tabularnewline
12 & 0.065407 & 0.5024 & 0.308627 \tabularnewline
13 & -0.017919 & -0.1376 & 0.445497 \tabularnewline
14 & 0.049093 & 0.3771 & 0.35373 \tabularnewline
15 & -0.120871 & -0.9284 & 0.178483 \tabularnewline
16 & 0.045241 & 0.3475 & 0.364724 \tabularnewline
17 & 0.004645 & 0.0357 & 0.485828 \tabularnewline
18 & -0.114964 & -0.8831 & 0.190395 \tabularnewline
19 & 0.012101 & 0.093 & 0.463129 \tabularnewline
20 & -0.113348 & -0.8706 & 0.193739 \tabularnewline
21 & -0.101484 & -0.7795 & 0.219397 \tabularnewline
22 & -0.077137 & -0.5925 & 0.277891 \tabularnewline
23 & -0.130685 & -1.0038 & 0.159784 \tabularnewline
24 & -0.044048 & -0.3383 & 0.368156 \tabularnewline
25 & -0.166153 & -1.2762 & 0.103435 \tabularnewline
26 & 0.234256 & 1.7994 & 0.038539 \tabularnewline
27 & 0.002941 & 0.0226 & 0.491028 \tabularnewline
28 & -0.117258 & -0.9007 & 0.185711 \tabularnewline
29 & -0.069687 & -0.5353 & 0.297234 \tabularnewline
30 & -0.070498 & -0.5415 & 0.2951 \tabularnewline
31 & 0.159057 & 1.2217 & 0.113333 \tabularnewline
32 & 0.005068 & 0.0389 & 0.484541 \tabularnewline
33 & 0.088788 & 0.682 & 0.248956 \tabularnewline
34 & 0.07193 & 0.5525 & 0.291345 \tabularnewline
35 & 0.054775 & 0.4207 & 0.33774 \tabularnewline
36 & -0.097143 & -0.7462 & 0.229265 \tabularnewline
37 & 0.033922 & 0.2606 & 0.397671 \tabularnewline
38 & -0.061301 & -0.4709 & 0.319737 \tabularnewline
39 & -0.020663 & -0.1587 & 0.437219 \tabularnewline
40 & -0.14006 & -1.0758 & 0.143194 \tabularnewline
41 & 0.017783 & 0.1366 & 0.445907 \tabularnewline
42 & -0.082839 & -0.6363 & 0.263521 \tabularnewline
43 & -0.037785 & -0.2902 & 0.386329 \tabularnewline
44 & 0.050223 & 0.3858 & 0.350527 \tabularnewline
45 & -0.072645 & -0.558 & 0.289478 \tabularnewline
46 & -0.045968 & -0.3531 & 0.362642 \tabularnewline
47 & 0.04461 & 0.3427 & 0.366537 \tabularnewline
48 & -0.072225 & -0.5548 & 0.290575 \tabularnewline
\hline
\end{tabular}
%Source: https://freestatistics.org/blog/index.php?pk=&T=2

[TABLE]
[ROW][C]Partial Autocorrelation Function[/C][/ROW]
[ROW][C]Time lag k[/C][C]PACF(k)[/C][C]T-STAT[/C][C]P-value[/C][/ROW]
[ROW][C]1[/C][C]0.349373[/C][C]2.6836[/C][C]0.004719[/C][/ROW]
[ROW][C]2[/C][C]0.029492[/C][C]0.2265[/C][C]0.410784[/C][/ROW]
[ROW][C]3[/C][C]0.110566[/C][C]0.8493[/C][C]0.199581[/C][/ROW]
[ROW][C]4[/C][C]0.081462[/C][C]0.6257[/C][C]0.266955[/C][/ROW]
[ROW][C]5[/C][C]-0.133897[/C][C]-1.0285[/C][C]0.153961[/C][/ROW]
[ROW][C]6[/C][C]-0.041995[/C][C]-0.3226[/C][C]0.374082[/C][/ROW]
[ROW][C]7[/C][C]0.204105[/C][C]1.5678[/C][C]0.061143[/C][/ROW]
[ROW][C]8[/C][C]0.004898[/C][C]0.0376[/C][C]0.485058[/C][/ROW]
[ROW][C]9[/C][C]0.246362[/C][C]1.8923[/C][C]0.031677[/C][/ROW]
[ROW][C]10[/C][C]-0.098114[/C][C]-0.7536[/C][C]0.227034[/C][/ROW]
[ROW][C]11[/C][C]0.04271[/C][C]0.3281[/C][C]0.372014[/C][/ROW]
[ROW][C]12[/C][C]0.065407[/C][C]0.5024[/C][C]0.308627[/C][/ROW]
[ROW][C]13[/C][C]-0.017919[/C][C]-0.1376[/C][C]0.445497[/C][/ROW]
[ROW][C]14[/C][C]0.049093[/C][C]0.3771[/C][C]0.35373[/C][/ROW]
[ROW][C]15[/C][C]-0.120871[/C][C]-0.9284[/C][C]0.178483[/C][/ROW]
[ROW][C]16[/C][C]0.045241[/C][C]0.3475[/C][C]0.364724[/C][/ROW]
[ROW][C]17[/C][C]0.004645[/C][C]0.0357[/C][C]0.485828[/C][/ROW]
[ROW][C]18[/C][C]-0.114964[/C][C]-0.8831[/C][C]0.190395[/C][/ROW]
[ROW][C]19[/C][C]0.012101[/C][C]0.093[/C][C]0.463129[/C][/ROW]
[ROW][C]20[/C][C]-0.113348[/C][C]-0.8706[/C][C]0.193739[/C][/ROW]
[ROW][C]21[/C][C]-0.101484[/C][C]-0.7795[/C][C]0.219397[/C][/ROW]
[ROW][C]22[/C][C]-0.077137[/C][C]-0.5925[/C][C]0.277891[/C][/ROW]
[ROW][C]23[/C][C]-0.130685[/C][C]-1.0038[/C][C]0.159784[/C][/ROW]
[ROW][C]24[/C][C]-0.044048[/C][C]-0.3383[/C][C]0.368156[/C][/ROW]
[ROW][C]25[/C][C]-0.166153[/C][C]-1.2762[/C][C]0.103435[/C][/ROW]
[ROW][C]26[/C][C]0.234256[/C][C]1.7994[/C][C]0.038539[/C][/ROW]
[ROW][C]27[/C][C]0.002941[/C][C]0.0226[/C][C]0.491028[/C][/ROW]
[ROW][C]28[/C][C]-0.117258[/C][C]-0.9007[/C][C]0.185711[/C][/ROW]
[ROW][C]29[/C][C]-0.069687[/C][C]-0.5353[/C][C]0.297234[/C][/ROW]
[ROW][C]30[/C][C]-0.070498[/C][C]-0.5415[/C][C]0.2951[/C][/ROW]
[ROW][C]31[/C][C]0.159057[/C][C]1.2217[/C][C]0.113333[/C][/ROW]
[ROW][C]32[/C][C]0.005068[/C][C]0.0389[/C][C]0.484541[/C][/ROW]
[ROW][C]33[/C][C]0.088788[/C][C]0.682[/C][C]0.248956[/C][/ROW]
[ROW][C]34[/C][C]0.07193[/C][C]0.5525[/C][C]0.291345[/C][/ROW]
[ROW][C]35[/C][C]0.054775[/C][C]0.4207[/C][C]0.33774[/C][/ROW]
[ROW][C]36[/C][C]-0.097143[/C][C]-0.7462[/C][C]0.229265[/C][/ROW]
[ROW][C]37[/C][C]0.033922[/C][C]0.2606[/C][C]0.397671[/C][/ROW]
[ROW][C]38[/C][C]-0.061301[/C][C]-0.4709[/C][C]0.319737[/C][/ROW]
[ROW][C]39[/C][C]-0.020663[/C][C]-0.1587[/C][C]0.437219[/C][/ROW]
[ROW][C]40[/C][C]-0.14006[/C][C]-1.0758[/C][C]0.143194[/C][/ROW]
[ROW][C]41[/C][C]0.017783[/C][C]0.1366[/C][C]0.445907[/C][/ROW]
[ROW][C]42[/C][C]-0.082839[/C][C]-0.6363[/C][C]0.263521[/C][/ROW]
[ROW][C]43[/C][C]-0.037785[/C][C]-0.2902[/C][C]0.386329[/C][/ROW]
[ROW][C]44[/C][C]0.050223[/C][C]0.3858[/C][C]0.350527[/C][/ROW]
[ROW][C]45[/C][C]-0.072645[/C][C]-0.558[/C][C]0.289478[/C][/ROW]
[ROW][C]46[/C][C]-0.045968[/C][C]-0.3531[/C][C]0.362642[/C][/ROW]
[ROW][C]47[/C][C]0.04461[/C][C]0.3427[/C][C]0.366537[/C][/ROW]
[ROW][C]48[/C][C]-0.072225[/C][C]-0.5548[/C][C]0.290575[/C][/ROW]
[/TABLE]
Source: https://freestatistics.org/blog/index.php?pk=&T=2

Globally Unique Identifier (entire table): ba.freestatistics.org/blog/index.php?pk=&T=2

As an alternative you can also use a QR Code:  

The GUIDs for individual cells are displayed in the table below:

Partial Autocorrelation Function
Time lag kPACF(k)T-STATP-value
10.3493732.68360.004719
20.0294920.22650.410784
30.1105660.84930.199581
40.0814620.62570.266955
5-0.133897-1.02850.153961
6-0.041995-0.32260.374082
70.2041051.56780.061143
80.0048980.03760.485058
90.2463621.89230.031677
10-0.098114-0.75360.227034
110.042710.32810.372014
120.0654070.50240.308627
13-0.017919-0.13760.445497
140.0490930.37710.35373
15-0.120871-0.92840.178483
160.0452410.34750.364724
170.0046450.03570.485828
18-0.114964-0.88310.190395
190.0121010.0930.463129
20-0.113348-0.87060.193739
21-0.101484-0.77950.219397
22-0.077137-0.59250.277891
23-0.130685-1.00380.159784
24-0.044048-0.33830.368156
25-0.166153-1.27620.103435
260.2342561.79940.038539
270.0029410.02260.491028
28-0.117258-0.90070.185711
29-0.069687-0.53530.297234
30-0.070498-0.54150.2951
310.1590571.22170.113333
320.0050680.03890.484541
330.0887880.6820.248956
340.071930.55250.291345
350.0547750.42070.33774
36-0.097143-0.74620.229265
370.0339220.26060.397671
38-0.061301-0.47090.319737
39-0.020663-0.15870.437219
40-0.14006-1.07580.143194
410.0177830.13660.445907
42-0.082839-0.63630.263521
43-0.037785-0.29020.386329
440.0502230.38580.350527
45-0.072645-0.5580.289478
46-0.045968-0.35310.362642
470.044610.34270.366537
48-0.072225-0.55480.290575


Parameters (Session):
par1 = 48 ; par2 = 1 ; par3 = 1 ; par4 = 0 ; par5 = 12 ; par6 = White Noise ; par7 = 0.95 ;
Parameters (R input):
par1 = 48 ; par2 = 1 ; par3 = 1 ; par4 = 0 ; par5 = 12 ; par6 = White Noise ; par7 = 0.95 ; par8 = ;
R code (references can be found in the software module):
if (par1 == 'Default') {
par1 = 10*log10(length(x))
} else {
par1 <- as.numeric(par1)
}
par2 <- as.numeric(par2)
par3 <- as.numeric(par3)
par4 <- as.numeric(par4)
par5 <- as.numeric(par5)
if (par6 == 'White Noise') par6 <- 'white' else par6 <- 'ma'
par7 <- as.numeric(par7)
if (par8 != '') par8 <- as.numeric(par8)
x <- na.omit(x)
ox <- x
if (par8 == '') {
if (par2 == 0) {
x <- log(x)
} else {
x <- (x ^ par2 - 1) / par2
}
} else {
x <- log(x,base=par8)
}
if (par3 > 0) x <- diff(x,lag=1,difference=par3)
if (par4 > 0) x <- diff(x,lag=par5,difference=par4)
bitmap(file='picts.png')
op <- par(mfrow=c(2,1))
plot(ox,type='l',main='Original Time Series',xlab='time',ylab='value')
if (par8=='') {
mytitle <- paste('Working Time Series (lambda=',par2,', d=',par3,', D=',par4,')',sep='')
mysub <- paste('(lambda=',par2,', d=',par3,', D=',par4,', CI=', par7, ', CI type=',par6,')',sep='')
} else {
mytitle <- paste('Working Time Series (base=',par8,', d=',par3,', D=',par4,')',sep='')
mysub <- paste('(base=',par8,', d=',par3,', D=',par4,', CI=', par7, ', CI type=',par6,')',sep='')
}
plot(x,type='l', main=mytitle,xlab='time',ylab='value')
par(op)
dev.off()
bitmap(file='pic1.png')
racf <- acf(x, par1, main='Autocorrelation', xlab='time lag', ylab='ACF', ci.type=par6, ci=par7, sub=mysub)
dev.off()
bitmap(file='pic2.png')
rpacf <- pacf(x,par1,main='Partial Autocorrelation',xlab='lags',ylab='PACF',sub=mysub)
dev.off()
(myacf <- c(racf$acf))
(mypacf <- c(rpacf$acf))
lengthx <- length(x)
sqrtn <- sqrt(lengthx)
load(file='createtable')
a<-table.start()
a<-table.row.start(a)
a<-table.element(a,'Autocorrelation Function',4,TRUE)
a<-table.row.end(a)
a<-table.row.start(a)
a<-table.element(a,'Time lag k',header=TRUE)
a<-table.element(a,hyperlink('basics.htm','ACF(k)','click here for more information about the Autocorrelation Function'),header=TRUE)
a<-table.element(a,'T-STAT',header=TRUE)
a<-table.element(a,'P-value',header=TRUE)
a<-table.row.end(a)
for (i in 2:(par1+1)) {
a<-table.row.start(a)
a<-table.element(a,i-1,header=TRUE)
a<-table.element(a,round(myacf[i],6))
mytstat <- myacf[i]*sqrtn
a<-table.element(a,round(mytstat,4))
a<-table.element(a,round(1-pt(abs(mytstat),lengthx),6))
a<-table.row.end(a)
}
a<-table.end(a)
table.save(a,file='mytable.tab')
a<-table.start()
a<-table.row.start(a)
a<-table.element(a,'Partial Autocorrelation Function',4,TRUE)
a<-table.row.end(a)
a<-table.row.start(a)
a<-table.element(a,'Time lag k',header=TRUE)
a<-table.element(a,hyperlink('basics.htm','PACF(k)','click here for more information about the Partial Autocorrelation Function'),header=TRUE)
a<-table.element(a,'T-STAT',header=TRUE)
a<-table.element(a,'P-value',header=TRUE)
a<-table.row.end(a)
for (i in 1:par1) {
a<-table.row.start(a)
a<-table.element(a,i,header=TRUE)
a<-table.element(a,round(mypacf[i],6))
mytstat <- mypacf[i]*sqrtn
a<-table.element(a,round(mytstat,4))
a<-table.element(a,round(1-pt(abs(mytstat),lengthx),6))
a<-table.row.end(a)
}
a<-table.end(a)
table.save(a,file='mytable1.tab')