Free Statistics

of Irreproducible Research!

Author's title

Author*Unverified author*
R Software Modulerwasp_autocorrelation.wasp
Title produced by software(Partial) Autocorrelation Function
Date of computationThu, 16 Mar 2017 10:46:44 +0000
Cite this page as followsStatistical Computations at FreeStatistics.org, Office for Research Development and Education, URL https://freestatistics.org/blog/index.php?v=date/2017/Mar/16/t1489661306mg28c46h9n54mga.htm/, Retrieved Tue, 14 May 2024 22:02:58 +0200
Statistical Computations at FreeStatistics.org, Office for Research Development and Education, URL https://freestatistics.org/blog/index.php?pk=, Retrieved Tue, 14 May 2024 22:02:58 +0200
QR Codes:

Original text written by user:
IsPrivate?No (this computation is public)
User-defined keywords
Estimated Impact0
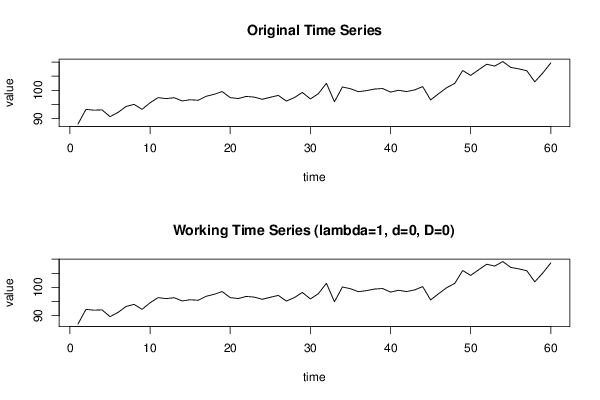
Dataseries X:
88,05
93,25
92,96
93,08
90,67
92,17
94,28
95,01
93,27
95,59
97,4
97,05
97,38
96,23
96,65
96,46
97,87
98,59
99,54
97,39
97,09
97,83
97,58
96,81
97,52
98,19
96,18
97,41
99,23
96,93
98,82
102,47
95,95
101,17
100,55
99,5
99,89
100,43
100,63
99,36
100
99,55
100,12
101,31
96,59
98,79
100,93
102,4
106,99
105,27
107,27
109,21
108,57
110,17
108,1
107,58
106,91
103
106,12
109,69


Summary of computational transaction
Raw Inputview raw input (R code)
Raw Outputview raw output of R engine
Computing time1 seconds
R Server'Gwilym Jenkins' @ jenkins.wessa.net

\begin{tabular}{lllllllll}
\hline
Summary of computational transaction \tabularnewline
Raw Input & view raw input (R code)  \tabularnewline
Raw Output & view raw output of R engine  \tabularnewline
Computing time & 1 seconds \tabularnewline
R Server & 'Gwilym Jenkins' @ jenkins.wessa.net \tabularnewline
\hline
\end{tabular}
%Source: https://freestatistics.org/blog/index.php?pk=&T=0

[TABLE]
[ROW][C]Summary of computational transaction[/C][/ROW]
[ROW][C]Raw Input[/C][C]view raw input (R code) [/C][/ROW]
[ROW][C]Raw Output[/C][C]view raw output of R engine [/C][/ROW]
[ROW][C]Computing time[/C][C]1 seconds[/C][/ROW]
[ROW][C]R Server[/C][C]'Gwilym Jenkins' @ jenkins.wessa.net[/C][/ROW]
[/TABLE]
Source: https://freestatistics.org/blog/index.php?pk=&T=0

Globally Unique Identifier (entire table): ba.freestatistics.org/blog/index.php?pk=&T=0

As an alternative you can also use a QR Code:  

The GUIDs for individual cells are displayed in the table below:

Summary of computational transaction
Raw Inputview raw input (R code)
Raw Outputview raw output of R engine
Computing time1 seconds
R Server'Gwilym Jenkins' @ jenkins.wessa.net


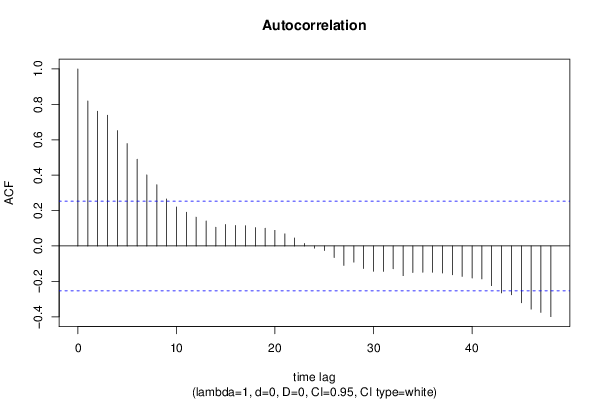
Autocorrelation Function
Time lag kACF(k)T-STATP-value
10.8193976.3470
20.7615835.89920
30.7389965.72420
40.6514485.04612e-06
50.5782244.47891.7e-05
60.490393.79850.000171
70.4015183.11010.00143
80.3464182.68330.004703
90.2651812.05410.022166
100.2200231.70430.046751
110.1902181.47340.072933
120.1628631.26150.106
130.1416541.09730.138458
140.1055430.81750.208429
150.1210640.93780.176065
160.1161170.89940.186008
170.1141590.88430.190041
180.1035850.80240.212753
190.1000490.7750.220698
200.0881020.68240.248795
210.0683370.52930.299264
220.0455650.35290.362683
230.0139310.10790.457214
24-0.012284-0.09510.462257
25-0.025581-0.19810.4218
26-0.065406-0.50660.307134
27-0.109461-0.84790.199938
28-0.091336-0.70750.241002
29-0.127598-0.98840.16347
30-0.142463-1.10350.137105
31-0.14353-1.11180.135334
32-0.12854-0.99570.161706
33-0.16754-1.29780.099669
34-0.149836-1.16060.125197
35-0.148025-1.14660.12805
36-0.148847-1.1530.126749
37-0.152845-1.18390.120555
38-0.16301-1.26270.105797
39-0.171878-1.33140.094053
40-0.181185-1.40350.082818
41-0.185864-1.43970.077575
42-0.224041-1.73540.043901
43-0.264809-2.05120.022311
44-0.275859-2.13680.018351
45-0.320685-2.4840.0079
46-0.356633-2.76250.003802
47-0.375002-2.90480.002569
48-0.399173-3.0920.001508

\begin{tabular}{lllllllll}
\hline
Autocorrelation Function \tabularnewline
Time lag k & ACF(k) & T-STAT & P-value \tabularnewline
1 & 0.819397 & 6.347 & 0 \tabularnewline
2 & 0.761583 & 5.8992 & 0 \tabularnewline
3 & 0.738996 & 5.7242 & 0 \tabularnewline
4 & 0.651448 & 5.0461 & 2e-06 \tabularnewline
5 & 0.578224 & 4.4789 & 1.7e-05 \tabularnewline
6 & 0.49039 & 3.7985 & 0.000171 \tabularnewline
7 & 0.401518 & 3.1101 & 0.00143 \tabularnewline
8 & 0.346418 & 2.6833 & 0.004703 \tabularnewline
9 & 0.265181 & 2.0541 & 0.022166 \tabularnewline
10 & 0.220023 & 1.7043 & 0.046751 \tabularnewline
11 & 0.190218 & 1.4734 & 0.072933 \tabularnewline
12 & 0.162863 & 1.2615 & 0.106 \tabularnewline
13 & 0.141654 & 1.0973 & 0.138458 \tabularnewline
14 & 0.105543 & 0.8175 & 0.208429 \tabularnewline
15 & 0.121064 & 0.9378 & 0.176065 \tabularnewline
16 & 0.116117 & 0.8994 & 0.186008 \tabularnewline
17 & 0.114159 & 0.8843 & 0.190041 \tabularnewline
18 & 0.103585 & 0.8024 & 0.212753 \tabularnewline
19 & 0.100049 & 0.775 & 0.220698 \tabularnewline
20 & 0.088102 & 0.6824 & 0.248795 \tabularnewline
21 & 0.068337 & 0.5293 & 0.299264 \tabularnewline
22 & 0.045565 & 0.3529 & 0.362683 \tabularnewline
23 & 0.013931 & 0.1079 & 0.457214 \tabularnewline
24 & -0.012284 & -0.0951 & 0.462257 \tabularnewline
25 & -0.025581 & -0.1981 & 0.4218 \tabularnewline
26 & -0.065406 & -0.5066 & 0.307134 \tabularnewline
27 & -0.109461 & -0.8479 & 0.199938 \tabularnewline
28 & -0.091336 & -0.7075 & 0.241002 \tabularnewline
29 & -0.127598 & -0.9884 & 0.16347 \tabularnewline
30 & -0.142463 & -1.1035 & 0.137105 \tabularnewline
31 & -0.14353 & -1.1118 & 0.135334 \tabularnewline
32 & -0.12854 & -0.9957 & 0.161706 \tabularnewline
33 & -0.16754 & -1.2978 & 0.099669 \tabularnewline
34 & -0.149836 & -1.1606 & 0.125197 \tabularnewline
35 & -0.148025 & -1.1466 & 0.12805 \tabularnewline
36 & -0.148847 & -1.153 & 0.126749 \tabularnewline
37 & -0.152845 & -1.1839 & 0.120555 \tabularnewline
38 & -0.16301 & -1.2627 & 0.105797 \tabularnewline
39 & -0.171878 & -1.3314 & 0.094053 \tabularnewline
40 & -0.181185 & -1.4035 & 0.082818 \tabularnewline
41 & -0.185864 & -1.4397 & 0.077575 \tabularnewline
42 & -0.224041 & -1.7354 & 0.043901 \tabularnewline
43 & -0.264809 & -2.0512 & 0.022311 \tabularnewline
44 & -0.275859 & -2.1368 & 0.018351 \tabularnewline
45 & -0.320685 & -2.484 & 0.0079 \tabularnewline
46 & -0.356633 & -2.7625 & 0.003802 \tabularnewline
47 & -0.375002 & -2.9048 & 0.002569 \tabularnewline
48 & -0.399173 & -3.092 & 0.001508 \tabularnewline
\hline
\end{tabular}
%Source: https://freestatistics.org/blog/index.php?pk=&T=1

[TABLE]
[ROW][C]Autocorrelation Function[/C][/ROW]
[ROW][C]Time lag k[/C][C]ACF(k)[/C][C]T-STAT[/C][C]P-value[/C][/ROW]
[ROW][C]1[/C][C]0.819397[/C][C]6.347[/C][C]0[/C][/ROW]
[ROW][C]2[/C][C]0.761583[/C][C]5.8992[/C][C]0[/C][/ROW]
[ROW][C]3[/C][C]0.738996[/C][C]5.7242[/C][C]0[/C][/ROW]
[ROW][C]4[/C][C]0.651448[/C][C]5.0461[/C][C]2e-06[/C][/ROW]
[ROW][C]5[/C][C]0.578224[/C][C]4.4789[/C][C]1.7e-05[/C][/ROW]
[ROW][C]6[/C][C]0.49039[/C][C]3.7985[/C][C]0.000171[/C][/ROW]
[ROW][C]7[/C][C]0.401518[/C][C]3.1101[/C][C]0.00143[/C][/ROW]
[ROW][C]8[/C][C]0.346418[/C][C]2.6833[/C][C]0.004703[/C][/ROW]
[ROW][C]9[/C][C]0.265181[/C][C]2.0541[/C][C]0.022166[/C][/ROW]
[ROW][C]10[/C][C]0.220023[/C][C]1.7043[/C][C]0.046751[/C][/ROW]
[ROW][C]11[/C][C]0.190218[/C][C]1.4734[/C][C]0.072933[/C][/ROW]
[ROW][C]12[/C][C]0.162863[/C][C]1.2615[/C][C]0.106[/C][/ROW]
[ROW][C]13[/C][C]0.141654[/C][C]1.0973[/C][C]0.138458[/C][/ROW]
[ROW][C]14[/C][C]0.105543[/C][C]0.8175[/C][C]0.208429[/C][/ROW]
[ROW][C]15[/C][C]0.121064[/C][C]0.9378[/C][C]0.176065[/C][/ROW]
[ROW][C]16[/C][C]0.116117[/C][C]0.8994[/C][C]0.186008[/C][/ROW]
[ROW][C]17[/C][C]0.114159[/C][C]0.8843[/C][C]0.190041[/C][/ROW]
[ROW][C]18[/C][C]0.103585[/C][C]0.8024[/C][C]0.212753[/C][/ROW]
[ROW][C]19[/C][C]0.100049[/C][C]0.775[/C][C]0.220698[/C][/ROW]
[ROW][C]20[/C][C]0.088102[/C][C]0.6824[/C][C]0.248795[/C][/ROW]
[ROW][C]21[/C][C]0.068337[/C][C]0.5293[/C][C]0.299264[/C][/ROW]
[ROW][C]22[/C][C]0.045565[/C][C]0.3529[/C][C]0.362683[/C][/ROW]
[ROW][C]23[/C][C]0.013931[/C][C]0.1079[/C][C]0.457214[/C][/ROW]
[ROW][C]24[/C][C]-0.012284[/C][C]-0.0951[/C][C]0.462257[/C][/ROW]
[ROW][C]25[/C][C]-0.025581[/C][C]-0.1981[/C][C]0.4218[/C][/ROW]
[ROW][C]26[/C][C]-0.065406[/C][C]-0.5066[/C][C]0.307134[/C][/ROW]
[ROW][C]27[/C][C]-0.109461[/C][C]-0.8479[/C][C]0.199938[/C][/ROW]
[ROW][C]28[/C][C]-0.091336[/C][C]-0.7075[/C][C]0.241002[/C][/ROW]
[ROW][C]29[/C][C]-0.127598[/C][C]-0.9884[/C][C]0.16347[/C][/ROW]
[ROW][C]30[/C][C]-0.142463[/C][C]-1.1035[/C][C]0.137105[/C][/ROW]
[ROW][C]31[/C][C]-0.14353[/C][C]-1.1118[/C][C]0.135334[/C][/ROW]
[ROW][C]32[/C][C]-0.12854[/C][C]-0.9957[/C][C]0.161706[/C][/ROW]
[ROW][C]33[/C][C]-0.16754[/C][C]-1.2978[/C][C]0.099669[/C][/ROW]
[ROW][C]34[/C][C]-0.149836[/C][C]-1.1606[/C][C]0.125197[/C][/ROW]
[ROW][C]35[/C][C]-0.148025[/C][C]-1.1466[/C][C]0.12805[/C][/ROW]
[ROW][C]36[/C][C]-0.148847[/C][C]-1.153[/C][C]0.126749[/C][/ROW]
[ROW][C]37[/C][C]-0.152845[/C][C]-1.1839[/C][C]0.120555[/C][/ROW]
[ROW][C]38[/C][C]-0.16301[/C][C]-1.2627[/C][C]0.105797[/C][/ROW]
[ROW][C]39[/C][C]-0.171878[/C][C]-1.3314[/C][C]0.094053[/C][/ROW]
[ROW][C]40[/C][C]-0.181185[/C][C]-1.4035[/C][C]0.082818[/C][/ROW]
[ROW][C]41[/C][C]-0.185864[/C][C]-1.4397[/C][C]0.077575[/C][/ROW]
[ROW][C]42[/C][C]-0.224041[/C][C]-1.7354[/C][C]0.043901[/C][/ROW]
[ROW][C]43[/C][C]-0.264809[/C][C]-2.0512[/C][C]0.022311[/C][/ROW]
[ROW][C]44[/C][C]-0.275859[/C][C]-2.1368[/C][C]0.018351[/C][/ROW]
[ROW][C]45[/C][C]-0.320685[/C][C]-2.484[/C][C]0.0079[/C][/ROW]
[ROW][C]46[/C][C]-0.356633[/C][C]-2.7625[/C][C]0.003802[/C][/ROW]
[ROW][C]47[/C][C]-0.375002[/C][C]-2.9048[/C][C]0.002569[/C][/ROW]
[ROW][C]48[/C][C]-0.399173[/C][C]-3.092[/C][C]0.001508[/C][/ROW]
[/TABLE]
Source: https://freestatistics.org/blog/index.php?pk=&T=1

Globally Unique Identifier (entire table): ba.freestatistics.org/blog/index.php?pk=&T=1

As an alternative you can also use a QR Code:  

The GUIDs for individual cells are displayed in the table below:

Autocorrelation Function
Time lag kACF(k)T-STATP-value
10.8193976.3470
20.7615835.89920
30.7389965.72420
40.6514485.04612e-06
50.5782244.47891.7e-05
60.490393.79850.000171
70.4015183.11010.00143
80.3464182.68330.004703
90.2651812.05410.022166
100.2200231.70430.046751
110.1902181.47340.072933
120.1628631.26150.106
130.1416541.09730.138458
140.1055430.81750.208429
150.1210640.93780.176065
160.1161170.89940.186008
170.1141590.88430.190041
180.1035850.80240.212753
190.1000490.7750.220698
200.0881020.68240.248795
210.0683370.52930.299264
220.0455650.35290.362683
230.0139310.10790.457214
24-0.012284-0.09510.462257
25-0.025581-0.19810.4218
26-0.065406-0.50660.307134
27-0.109461-0.84790.199938
28-0.091336-0.70750.241002
29-0.127598-0.98840.16347
30-0.142463-1.10350.137105
31-0.14353-1.11180.135334
32-0.12854-0.99570.161706
33-0.16754-1.29780.099669
34-0.149836-1.16060.125197
35-0.148025-1.14660.12805
36-0.148847-1.1530.126749
37-0.152845-1.18390.120555
38-0.16301-1.26270.105797
39-0.171878-1.33140.094053
40-0.181185-1.40350.082818
41-0.185864-1.43970.077575
42-0.224041-1.73540.043901
43-0.264809-2.05120.022311
44-0.275859-2.13680.018351
45-0.320685-2.4840.0079
46-0.356633-2.76250.003802
47-0.375002-2.90480.002569
48-0.399173-3.0920.001508


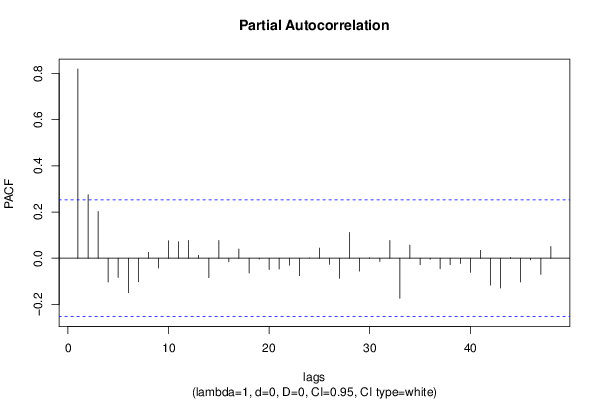
Partial Autocorrelation Function
Time lag kPACF(k)T-STATP-value
10.8193976.3470
20.2744242.12570.018828
30.2019021.56390.061547
4-0.102866-0.79680.214355
5-0.083431-0.64630.26029
6-0.149666-1.15930.125462
7-0.101764-0.78830.216824
80.0256320.19850.421646
9-0.042317-0.32780.372107
100.0759570.58840.279249
110.0711030.55080.29192
120.0765750.59310.277655
130.0126120.09770.461252
14-0.084102-0.65150.258622
150.0763860.59170.278143
16-0.015466-0.11980.452522
170.0402370.31170.378184
18-0.063745-0.49380.311638
19-0.003146-0.02440.490319
20-0.049106-0.38040.352504
21-0.046747-0.36210.359274
22-0.030811-0.23870.406092
23-0.075437-0.58430.280594
240.000510.00390.498432
250.0437090.33860.36806
26-0.026453-0.20490.419171
27-0.086805-0.67240.251959
280.111420.86310.195772
29-0.055832-0.43250.333474
300.0007920.00610.497562
31-0.014391-0.11150.455806
320.0767720.59470.277148
33-0.173154-1.34120.092448
340.0565570.43810.331448
35-0.027976-0.21670.414589
36-0.004206-0.03260.487059
37-0.045503-0.35250.362864
38-0.027983-0.21680.414566
39-0.022786-0.17650.430247
40-0.060729-0.47040.319886
410.0338840.26250.396931
42-0.11673-0.90420.184756
43-0.129065-0.99970.160727
440.0032280.0250.490067
45-0.102714-0.79560.214695
46-0.007241-0.05610.477728
47-0.06997-0.5420.294919
480.0504860.39110.348567

\begin{tabular}{lllllllll}
\hline
Partial Autocorrelation Function \tabularnewline
Time lag k & PACF(k) & T-STAT & P-value \tabularnewline
1 & 0.819397 & 6.347 & 0 \tabularnewline
2 & 0.274424 & 2.1257 & 0.018828 \tabularnewline
3 & 0.201902 & 1.5639 & 0.061547 \tabularnewline
4 & -0.102866 & -0.7968 & 0.214355 \tabularnewline
5 & -0.083431 & -0.6463 & 0.26029 \tabularnewline
6 & -0.149666 & -1.1593 & 0.125462 \tabularnewline
7 & -0.101764 & -0.7883 & 0.216824 \tabularnewline
8 & 0.025632 & 0.1985 & 0.421646 \tabularnewline
9 & -0.042317 & -0.3278 & 0.372107 \tabularnewline
10 & 0.075957 & 0.5884 & 0.279249 \tabularnewline
11 & 0.071103 & 0.5508 & 0.29192 \tabularnewline
12 & 0.076575 & 0.5931 & 0.277655 \tabularnewline
13 & 0.012612 & 0.0977 & 0.461252 \tabularnewline
14 & -0.084102 & -0.6515 & 0.258622 \tabularnewline
15 & 0.076386 & 0.5917 & 0.278143 \tabularnewline
16 & -0.015466 & -0.1198 & 0.452522 \tabularnewline
17 & 0.040237 & 0.3117 & 0.378184 \tabularnewline
18 & -0.063745 & -0.4938 & 0.311638 \tabularnewline
19 & -0.003146 & -0.0244 & 0.490319 \tabularnewline
20 & -0.049106 & -0.3804 & 0.352504 \tabularnewline
21 & -0.046747 & -0.3621 & 0.359274 \tabularnewline
22 & -0.030811 & -0.2387 & 0.406092 \tabularnewline
23 & -0.075437 & -0.5843 & 0.280594 \tabularnewline
24 & 0.00051 & 0.0039 & 0.498432 \tabularnewline
25 & 0.043709 & 0.3386 & 0.36806 \tabularnewline
26 & -0.026453 & -0.2049 & 0.419171 \tabularnewline
27 & -0.086805 & -0.6724 & 0.251959 \tabularnewline
28 & 0.11142 & 0.8631 & 0.195772 \tabularnewline
29 & -0.055832 & -0.4325 & 0.333474 \tabularnewline
30 & 0.000792 & 0.0061 & 0.497562 \tabularnewline
31 & -0.014391 & -0.1115 & 0.455806 \tabularnewline
32 & 0.076772 & 0.5947 & 0.277148 \tabularnewline
33 & -0.173154 & -1.3412 & 0.092448 \tabularnewline
34 & 0.056557 & 0.4381 & 0.331448 \tabularnewline
35 & -0.027976 & -0.2167 & 0.414589 \tabularnewline
36 & -0.004206 & -0.0326 & 0.487059 \tabularnewline
37 & -0.045503 & -0.3525 & 0.362864 \tabularnewline
38 & -0.027983 & -0.2168 & 0.414566 \tabularnewline
39 & -0.022786 & -0.1765 & 0.430247 \tabularnewline
40 & -0.060729 & -0.4704 & 0.319886 \tabularnewline
41 & 0.033884 & 0.2625 & 0.396931 \tabularnewline
42 & -0.11673 & -0.9042 & 0.184756 \tabularnewline
43 & -0.129065 & -0.9997 & 0.160727 \tabularnewline
44 & 0.003228 & 0.025 & 0.490067 \tabularnewline
45 & -0.102714 & -0.7956 & 0.214695 \tabularnewline
46 & -0.007241 & -0.0561 & 0.477728 \tabularnewline
47 & -0.06997 & -0.542 & 0.294919 \tabularnewline
48 & 0.050486 & 0.3911 & 0.348567 \tabularnewline
\hline
\end{tabular}
%Source: https://freestatistics.org/blog/index.php?pk=&T=2

[TABLE]
[ROW][C]Partial Autocorrelation Function[/C][/ROW]
[ROW][C]Time lag k[/C][C]PACF(k)[/C][C]T-STAT[/C][C]P-value[/C][/ROW]
[ROW][C]1[/C][C]0.819397[/C][C]6.347[/C][C]0[/C][/ROW]
[ROW][C]2[/C][C]0.274424[/C][C]2.1257[/C][C]0.018828[/C][/ROW]
[ROW][C]3[/C][C]0.201902[/C][C]1.5639[/C][C]0.061547[/C][/ROW]
[ROW][C]4[/C][C]-0.102866[/C][C]-0.7968[/C][C]0.214355[/C][/ROW]
[ROW][C]5[/C][C]-0.083431[/C][C]-0.6463[/C][C]0.26029[/C][/ROW]
[ROW][C]6[/C][C]-0.149666[/C][C]-1.1593[/C][C]0.125462[/C][/ROW]
[ROW][C]7[/C][C]-0.101764[/C][C]-0.7883[/C][C]0.216824[/C][/ROW]
[ROW][C]8[/C][C]0.025632[/C][C]0.1985[/C][C]0.421646[/C][/ROW]
[ROW][C]9[/C][C]-0.042317[/C][C]-0.3278[/C][C]0.372107[/C][/ROW]
[ROW][C]10[/C][C]0.075957[/C][C]0.5884[/C][C]0.279249[/C][/ROW]
[ROW][C]11[/C][C]0.071103[/C][C]0.5508[/C][C]0.29192[/C][/ROW]
[ROW][C]12[/C][C]0.076575[/C][C]0.5931[/C][C]0.277655[/C][/ROW]
[ROW][C]13[/C][C]0.012612[/C][C]0.0977[/C][C]0.461252[/C][/ROW]
[ROW][C]14[/C][C]-0.084102[/C][C]-0.6515[/C][C]0.258622[/C][/ROW]
[ROW][C]15[/C][C]0.076386[/C][C]0.5917[/C][C]0.278143[/C][/ROW]
[ROW][C]16[/C][C]-0.015466[/C][C]-0.1198[/C][C]0.452522[/C][/ROW]
[ROW][C]17[/C][C]0.040237[/C][C]0.3117[/C][C]0.378184[/C][/ROW]
[ROW][C]18[/C][C]-0.063745[/C][C]-0.4938[/C][C]0.311638[/C][/ROW]
[ROW][C]19[/C][C]-0.003146[/C][C]-0.0244[/C][C]0.490319[/C][/ROW]
[ROW][C]20[/C][C]-0.049106[/C][C]-0.3804[/C][C]0.352504[/C][/ROW]
[ROW][C]21[/C][C]-0.046747[/C][C]-0.3621[/C][C]0.359274[/C][/ROW]
[ROW][C]22[/C][C]-0.030811[/C][C]-0.2387[/C][C]0.406092[/C][/ROW]
[ROW][C]23[/C][C]-0.075437[/C][C]-0.5843[/C][C]0.280594[/C][/ROW]
[ROW][C]24[/C][C]0.00051[/C][C]0.0039[/C][C]0.498432[/C][/ROW]
[ROW][C]25[/C][C]0.043709[/C][C]0.3386[/C][C]0.36806[/C][/ROW]
[ROW][C]26[/C][C]-0.026453[/C][C]-0.2049[/C][C]0.419171[/C][/ROW]
[ROW][C]27[/C][C]-0.086805[/C][C]-0.6724[/C][C]0.251959[/C][/ROW]
[ROW][C]28[/C][C]0.11142[/C][C]0.8631[/C][C]0.195772[/C][/ROW]
[ROW][C]29[/C][C]-0.055832[/C][C]-0.4325[/C][C]0.333474[/C][/ROW]
[ROW][C]30[/C][C]0.000792[/C][C]0.0061[/C][C]0.497562[/C][/ROW]
[ROW][C]31[/C][C]-0.014391[/C][C]-0.1115[/C][C]0.455806[/C][/ROW]
[ROW][C]32[/C][C]0.076772[/C][C]0.5947[/C][C]0.277148[/C][/ROW]
[ROW][C]33[/C][C]-0.173154[/C][C]-1.3412[/C][C]0.092448[/C][/ROW]
[ROW][C]34[/C][C]0.056557[/C][C]0.4381[/C][C]0.331448[/C][/ROW]
[ROW][C]35[/C][C]-0.027976[/C][C]-0.2167[/C][C]0.414589[/C][/ROW]
[ROW][C]36[/C][C]-0.004206[/C][C]-0.0326[/C][C]0.487059[/C][/ROW]
[ROW][C]37[/C][C]-0.045503[/C][C]-0.3525[/C][C]0.362864[/C][/ROW]
[ROW][C]38[/C][C]-0.027983[/C][C]-0.2168[/C][C]0.414566[/C][/ROW]
[ROW][C]39[/C][C]-0.022786[/C][C]-0.1765[/C][C]0.430247[/C][/ROW]
[ROW][C]40[/C][C]-0.060729[/C][C]-0.4704[/C][C]0.319886[/C][/ROW]
[ROW][C]41[/C][C]0.033884[/C][C]0.2625[/C][C]0.396931[/C][/ROW]
[ROW][C]42[/C][C]-0.11673[/C][C]-0.9042[/C][C]0.184756[/C][/ROW]
[ROW][C]43[/C][C]-0.129065[/C][C]-0.9997[/C][C]0.160727[/C][/ROW]
[ROW][C]44[/C][C]0.003228[/C][C]0.025[/C][C]0.490067[/C][/ROW]
[ROW][C]45[/C][C]-0.102714[/C][C]-0.7956[/C][C]0.214695[/C][/ROW]
[ROW][C]46[/C][C]-0.007241[/C][C]-0.0561[/C][C]0.477728[/C][/ROW]
[ROW][C]47[/C][C]-0.06997[/C][C]-0.542[/C][C]0.294919[/C][/ROW]
[ROW][C]48[/C][C]0.050486[/C][C]0.3911[/C][C]0.348567[/C][/ROW]
[/TABLE]
Source: https://freestatistics.org/blog/index.php?pk=&T=2

Globally Unique Identifier (entire table): ba.freestatistics.org/blog/index.php?pk=&T=2

As an alternative you can also use a QR Code:  

The GUIDs for individual cells are displayed in the table below:

Partial Autocorrelation Function
Time lag kPACF(k)T-STATP-value
10.8193976.3470
20.2744242.12570.018828
30.2019021.56390.061547
4-0.102866-0.79680.214355
5-0.083431-0.64630.26029
6-0.149666-1.15930.125462
7-0.101764-0.78830.216824
80.0256320.19850.421646
9-0.042317-0.32780.372107
100.0759570.58840.279249
110.0711030.55080.29192
120.0765750.59310.277655
130.0126120.09770.461252
14-0.084102-0.65150.258622
150.0763860.59170.278143
16-0.015466-0.11980.452522
170.0402370.31170.378184
18-0.063745-0.49380.311638
19-0.003146-0.02440.490319
20-0.049106-0.38040.352504
21-0.046747-0.36210.359274
22-0.030811-0.23870.406092
23-0.075437-0.58430.280594
240.000510.00390.498432
250.0437090.33860.36806
26-0.026453-0.20490.419171
27-0.086805-0.67240.251959
280.111420.86310.195772
29-0.055832-0.43250.333474
300.0007920.00610.497562
31-0.014391-0.11150.455806
320.0767720.59470.277148
33-0.173154-1.34120.092448
340.0565570.43810.331448
35-0.027976-0.21670.414589
36-0.004206-0.03260.487059
37-0.045503-0.35250.362864
38-0.027983-0.21680.414566
39-0.022786-0.17650.430247
40-0.060729-0.47040.319886
410.0338840.26250.396931
42-0.11673-0.90420.184756
43-0.129065-0.99970.160727
440.0032280.0250.490067
45-0.102714-0.79560.214695
46-0.007241-0.05610.477728
47-0.06997-0.5420.294919
480.0504860.39110.348567


Parameters (Session):
par1 = 48 ; par2 = 1 ; par3 = 0 ; par4 = 0 ; par5 = 12 ; par6 = White Noise ; par7 = 0.95 ;
Parameters (R input):
par1 = 48 ; par2 = 1 ; par3 = 0 ; par4 = 0 ; par5 = 12 ; par6 = White Noise ; par7 = 0.95 ; par8 = ;
R code (references can be found in the software module):
if (par1 == 'Default') {
par1 = 10*log10(length(x))
} else {
par1 <- as.numeric(par1)
}
par2 <- as.numeric(par2)
par3 <- as.numeric(par3)
par4 <- as.numeric(par4)
par5 <- as.numeric(par5)
if (par6 == 'White Noise') par6 <- 'white' else par6 <- 'ma'
par7 <- as.numeric(par7)
if (par8 != '') par8 <- as.numeric(par8)
x <- na.omit(x)
ox <- x
if (par8 == '') {
if (par2 == 0) {
x <- log(x)
} else {
x <- (x ^ par2 - 1) / par2
}
} else {
x <- log(x,base=par8)
}
if (par3 > 0) x <- diff(x,lag=1,difference=par3)
if (par4 > 0) x <- diff(x,lag=par5,difference=par4)
bitmap(file='picts.png')
op <- par(mfrow=c(2,1))
plot(ox,type='l',main='Original Time Series',xlab='time',ylab='value')
if (par8=='') {
mytitle <- paste('Working Time Series (lambda=',par2,', d=',par3,', D=',par4,')',sep='')
mysub <- paste('(lambda=',par2,', d=',par3,', D=',par4,', CI=', par7, ', CI type=',par6,')',sep='')
} else {
mytitle <- paste('Working Time Series (base=',par8,', d=',par3,', D=',par4,')',sep='')
mysub <- paste('(base=',par8,', d=',par3,', D=',par4,', CI=', par7, ', CI type=',par6,')',sep='')
}
plot(x,type='l', main=mytitle,xlab='time',ylab='value')
par(op)
dev.off()
bitmap(file='pic1.png')
racf <- acf(x, par1, main='Autocorrelation', xlab='time lag', ylab='ACF', ci.type=par6, ci=par7, sub=mysub)
dev.off()
bitmap(file='pic2.png')
rpacf <- pacf(x,par1,main='Partial Autocorrelation',xlab='lags',ylab='PACF',sub=mysub)
dev.off()
(myacf <- c(racf$acf))
(mypacf <- c(rpacf$acf))
lengthx <- length(x)
sqrtn <- sqrt(lengthx)
load(file='createtable')
a<-table.start()
a<-table.row.start(a)
a<-table.element(a,'Autocorrelation Function',4,TRUE)
a<-table.row.end(a)
a<-table.row.start(a)
a<-table.element(a,'Time lag k',header=TRUE)
a<-table.element(a,hyperlink('basics.htm','ACF(k)','click here for more information about the Autocorrelation Function'),header=TRUE)
a<-table.element(a,'T-STAT',header=TRUE)
a<-table.element(a,'P-value',header=TRUE)
a<-table.row.end(a)
for (i in 2:(par1+1)) {
a<-table.row.start(a)
a<-table.element(a,i-1,header=TRUE)
a<-table.element(a,round(myacf[i],6))
mytstat <- myacf[i]*sqrtn
a<-table.element(a,round(mytstat,4))
a<-table.element(a,round(1-pt(abs(mytstat),lengthx),6))
a<-table.row.end(a)
}
a<-table.end(a)
table.save(a,file='mytable.tab')
a<-table.start()
a<-table.row.start(a)
a<-table.element(a,'Partial Autocorrelation Function',4,TRUE)
a<-table.row.end(a)
a<-table.row.start(a)
a<-table.element(a,'Time lag k',header=TRUE)
a<-table.element(a,hyperlink('basics.htm','PACF(k)','click here for more information about the Partial Autocorrelation Function'),header=TRUE)
a<-table.element(a,'T-STAT',header=TRUE)
a<-table.element(a,'P-value',header=TRUE)
a<-table.row.end(a)
for (i in 1:par1) {
a<-table.row.start(a)
a<-table.element(a,i,header=TRUE)
a<-table.element(a,round(mypacf[i],6))
mytstat <- mypacf[i]*sqrtn
a<-table.element(a,round(mytstat,4))
a<-table.element(a,round(1-pt(abs(mytstat),lengthx),6))
a<-table.row.end(a)
}
a<-table.end(a)
table.save(a,file='mytable1.tab')