Free Statistics

of Irreproducible Research!

Author's title

Author*Unverified author*
R Software Modulerwasp_autocorrelation.wasp
Title produced by software(Partial) Autocorrelation Function
Date of computationThu, 16 Mar 2017 10:59:36 +0000
Cite this page as followsStatistical Computations at FreeStatistics.org, Office for Research Development and Education, URL https://freestatistics.org/blog/index.php?v=date/2017/Mar/16/t14896621562d4raytbtdtvl77.htm/, Retrieved Tue, 14 May 2024 19:52:12 +0200
Statistical Computations at FreeStatistics.org, Office for Research Development and Education, URL https://freestatistics.org/blog/index.php?pk=, Retrieved Tue, 14 May 2024 19:52:12 +0200
QR Codes:

Original text written by user:
IsPrivate?No (this computation is public)
User-defined keywords
Estimated Impact0
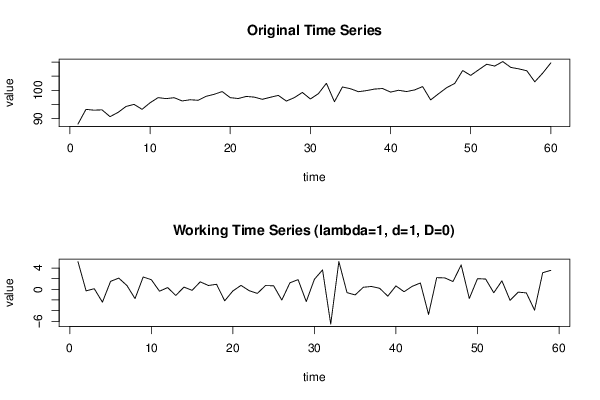
Dataseries X:
88.05
93.25
92.96
93.08
90.67
92.17
94.28
95.01
93.27
95.59
97.4
97.05
97.38
96.23
96.65
96.46
97.87
98.59
99.54
97.39
97.09
97.83
97.58
96.81
97.52
98.19
96.18
97.41
99.23
96.93
98.82
102.47
95.95
101.17
100.55
99.5
99.89
100.43
100.63
99.36
100
99.55
100.12
101.31
96.59
98.79
100.93
102.4
106.99
105.27
107.27
109.21
108.57
110.17
108.1
107.58
106.91
103
106.12
109.69


Summary of computational transaction
Raw Inputview raw input (R code)
Raw Outputview raw output of R engine
Computing time1 seconds
R Server'Gwilym Jenkins' @ jenkins.wessa.net

\begin{tabular}{lllllllll}
\hline
Summary of computational transaction \tabularnewline
Raw Input & view raw input (R code)  \tabularnewline
Raw Output & view raw output of R engine  \tabularnewline
Computing time & 1 seconds \tabularnewline
R Server & 'Gwilym Jenkins' @ jenkins.wessa.net \tabularnewline
\hline
\end{tabular}
%Source: https://freestatistics.org/blog/index.php?pk=&T=0

[TABLE]
[ROW][C]Summary of computational transaction[/C][/ROW]
[ROW][C]Raw Input[/C][C]view raw input (R code) [/C][/ROW]
[ROW][C]Raw Output[/C][C]view raw output of R engine [/C][/ROW]
[ROW][C]Computing time[/C][C]1 seconds[/C][/ROW]
[ROW][C]R Server[/C][C]'Gwilym Jenkins' @ jenkins.wessa.net[/C][/ROW]
[/TABLE]
Source: https://freestatistics.org/blog/index.php?pk=&T=0

Globally Unique Identifier (entire table): ba.freestatistics.org/blog/index.php?pk=&T=0

As an alternative you can also use a QR Code:  

The GUIDs for individual cells are displayed in the table below:

Summary of computational transaction
Raw Inputview raw input (R code)
Raw Outputview raw output of R engine
Computing time1 seconds
R Server'Gwilym Jenkins' @ jenkins.wessa.net


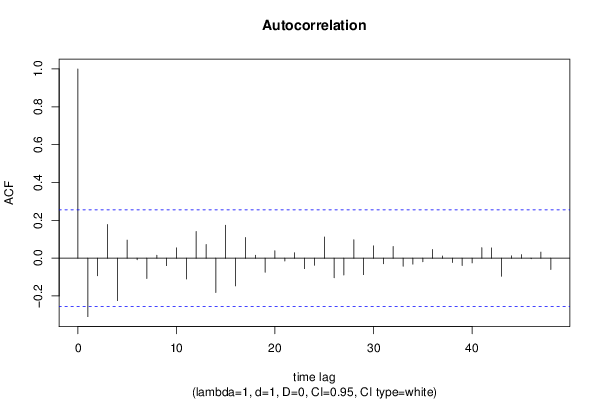
Autocorrelation Function
Time lag kACF(k)T-STATP-value
1-0.309191-2.37490.010411
2-0.093371-0.71720.238042
30.1775241.36360.088939
4-0.224405-1.72370.045001
50.0952050.73130.23375
6-0.008881-0.06820.472922
7-0.107614-0.82660.205898
80.0150290.11540.454243
9-0.039445-0.3030.381484
100.0544370.41810.338682
11-0.110467-0.84850.199792
120.1410261.08320.141555
130.0725230.55710.289797
14-0.181608-1.3950.084129
150.1738691.33550.093419
16-0.146486-1.12520.132535
170.1090310.83750.20285
180.0151810.11660.453785
19-0.074937-0.57560.283537
200.0395030.30340.381317
21-0.015277-0.11730.453493
220.0287790.22110.412907
23-0.055389-0.42550.336027
24-0.037792-0.29030.386307
250.111470.85620.19767
26-0.103953-0.79850.213898
27-0.089198-0.68510.247968
280.0969070.74440.229807
29-0.087024-0.66840.253228
300.0649960.49920.309731
31-0.029538-0.22690.410647
320.0619930.47620.317854
33-0.04293-0.32980.371376
34-0.031613-0.24280.404493
35-0.019219-0.14760.44157
360.0458130.35190.363084
370.0113780.08740.465325
38-0.022746-0.17470.43095
39-0.038746-0.29760.383523
40-0.024997-0.1920.4242
410.0554940.42630.335737
420.0542010.41630.33934
43-0.095281-0.73190.233575
440.0119910.09210.463462
450.0185440.14240.443609
46-0.003557-0.02730.489148
470.0317910.24420.403966
48-0.059886-0.460.323606

\begin{tabular}{lllllllll}
\hline
Autocorrelation Function \tabularnewline
Time lag k & ACF(k) & T-STAT & P-value \tabularnewline
1 & -0.309191 & -2.3749 & 0.010411 \tabularnewline
2 & -0.093371 & -0.7172 & 0.238042 \tabularnewline
3 & 0.177524 & 1.3636 & 0.088939 \tabularnewline
4 & -0.224405 & -1.7237 & 0.045001 \tabularnewline
5 & 0.095205 & 0.7313 & 0.23375 \tabularnewline
6 & -0.008881 & -0.0682 & 0.472922 \tabularnewline
7 & -0.107614 & -0.8266 & 0.205898 \tabularnewline
8 & 0.015029 & 0.1154 & 0.454243 \tabularnewline
9 & -0.039445 & -0.303 & 0.381484 \tabularnewline
10 & 0.054437 & 0.4181 & 0.338682 \tabularnewline
11 & -0.110467 & -0.8485 & 0.199792 \tabularnewline
12 & 0.141026 & 1.0832 & 0.141555 \tabularnewline
13 & 0.072523 & 0.5571 & 0.289797 \tabularnewline
14 & -0.181608 & -1.395 & 0.084129 \tabularnewline
15 & 0.173869 & 1.3355 & 0.093419 \tabularnewline
16 & -0.146486 & -1.1252 & 0.132535 \tabularnewline
17 & 0.109031 & 0.8375 & 0.20285 \tabularnewline
18 & 0.015181 & 0.1166 & 0.453785 \tabularnewline
19 & -0.074937 & -0.5756 & 0.283537 \tabularnewline
20 & 0.039503 & 0.3034 & 0.381317 \tabularnewline
21 & -0.015277 & -0.1173 & 0.453493 \tabularnewline
22 & 0.028779 & 0.2211 & 0.412907 \tabularnewline
23 & -0.055389 & -0.4255 & 0.336027 \tabularnewline
24 & -0.037792 & -0.2903 & 0.386307 \tabularnewline
25 & 0.11147 & 0.8562 & 0.19767 \tabularnewline
26 & -0.103953 & -0.7985 & 0.213898 \tabularnewline
27 & -0.089198 & -0.6851 & 0.247968 \tabularnewline
28 & 0.096907 & 0.7444 & 0.229807 \tabularnewline
29 & -0.087024 & -0.6684 & 0.253228 \tabularnewline
30 & 0.064996 & 0.4992 & 0.309731 \tabularnewline
31 & -0.029538 & -0.2269 & 0.410647 \tabularnewline
32 & 0.061993 & 0.4762 & 0.317854 \tabularnewline
33 & -0.04293 & -0.3298 & 0.371376 \tabularnewline
34 & -0.031613 & -0.2428 & 0.404493 \tabularnewline
35 & -0.019219 & -0.1476 & 0.44157 \tabularnewline
36 & 0.045813 & 0.3519 & 0.363084 \tabularnewline
37 & 0.011378 & 0.0874 & 0.465325 \tabularnewline
38 & -0.022746 & -0.1747 & 0.43095 \tabularnewline
39 & -0.038746 & -0.2976 & 0.383523 \tabularnewline
40 & -0.024997 & -0.192 & 0.4242 \tabularnewline
41 & 0.055494 & 0.4263 & 0.335737 \tabularnewline
42 & 0.054201 & 0.4163 & 0.33934 \tabularnewline
43 & -0.095281 & -0.7319 & 0.233575 \tabularnewline
44 & 0.011991 & 0.0921 & 0.463462 \tabularnewline
45 & 0.018544 & 0.1424 & 0.443609 \tabularnewline
46 & -0.003557 & -0.0273 & 0.489148 \tabularnewline
47 & 0.031791 & 0.2442 & 0.403966 \tabularnewline
48 & -0.059886 & -0.46 & 0.323606 \tabularnewline
\hline
\end{tabular}
%Source: https://freestatistics.org/blog/index.php?pk=&T=1

[TABLE]
[ROW][C]Autocorrelation Function[/C][/ROW]
[ROW][C]Time lag k[/C][C]ACF(k)[/C][C]T-STAT[/C][C]P-value[/C][/ROW]
[ROW][C]1[/C][C]-0.309191[/C][C]-2.3749[/C][C]0.010411[/C][/ROW]
[ROW][C]2[/C][C]-0.093371[/C][C]-0.7172[/C][C]0.238042[/C][/ROW]
[ROW][C]3[/C][C]0.177524[/C][C]1.3636[/C][C]0.088939[/C][/ROW]
[ROW][C]4[/C][C]-0.224405[/C][C]-1.7237[/C][C]0.045001[/C][/ROW]
[ROW][C]5[/C][C]0.095205[/C][C]0.7313[/C][C]0.23375[/C][/ROW]
[ROW][C]6[/C][C]-0.008881[/C][C]-0.0682[/C][C]0.472922[/C][/ROW]
[ROW][C]7[/C][C]-0.107614[/C][C]-0.8266[/C][C]0.205898[/C][/ROW]
[ROW][C]8[/C][C]0.015029[/C][C]0.1154[/C][C]0.454243[/C][/ROW]
[ROW][C]9[/C][C]-0.039445[/C][C]-0.303[/C][C]0.381484[/C][/ROW]
[ROW][C]10[/C][C]0.054437[/C][C]0.4181[/C][C]0.338682[/C][/ROW]
[ROW][C]11[/C][C]-0.110467[/C][C]-0.8485[/C][C]0.199792[/C][/ROW]
[ROW][C]12[/C][C]0.141026[/C][C]1.0832[/C][C]0.141555[/C][/ROW]
[ROW][C]13[/C][C]0.072523[/C][C]0.5571[/C][C]0.289797[/C][/ROW]
[ROW][C]14[/C][C]-0.181608[/C][C]-1.395[/C][C]0.084129[/C][/ROW]
[ROW][C]15[/C][C]0.173869[/C][C]1.3355[/C][C]0.093419[/C][/ROW]
[ROW][C]16[/C][C]-0.146486[/C][C]-1.1252[/C][C]0.132535[/C][/ROW]
[ROW][C]17[/C][C]0.109031[/C][C]0.8375[/C][C]0.20285[/C][/ROW]
[ROW][C]18[/C][C]0.015181[/C][C]0.1166[/C][C]0.453785[/C][/ROW]
[ROW][C]19[/C][C]-0.074937[/C][C]-0.5756[/C][C]0.283537[/C][/ROW]
[ROW][C]20[/C][C]0.039503[/C][C]0.3034[/C][C]0.381317[/C][/ROW]
[ROW][C]21[/C][C]-0.015277[/C][C]-0.1173[/C][C]0.453493[/C][/ROW]
[ROW][C]22[/C][C]0.028779[/C][C]0.2211[/C][C]0.412907[/C][/ROW]
[ROW][C]23[/C][C]-0.055389[/C][C]-0.4255[/C][C]0.336027[/C][/ROW]
[ROW][C]24[/C][C]-0.037792[/C][C]-0.2903[/C][C]0.386307[/C][/ROW]
[ROW][C]25[/C][C]0.11147[/C][C]0.8562[/C][C]0.19767[/C][/ROW]
[ROW][C]26[/C][C]-0.103953[/C][C]-0.7985[/C][C]0.213898[/C][/ROW]
[ROW][C]27[/C][C]-0.089198[/C][C]-0.6851[/C][C]0.247968[/C][/ROW]
[ROW][C]28[/C][C]0.096907[/C][C]0.7444[/C][C]0.229807[/C][/ROW]
[ROW][C]29[/C][C]-0.087024[/C][C]-0.6684[/C][C]0.253228[/C][/ROW]
[ROW][C]30[/C][C]0.064996[/C][C]0.4992[/C][C]0.309731[/C][/ROW]
[ROW][C]31[/C][C]-0.029538[/C][C]-0.2269[/C][C]0.410647[/C][/ROW]
[ROW][C]32[/C][C]0.061993[/C][C]0.4762[/C][C]0.317854[/C][/ROW]
[ROW][C]33[/C][C]-0.04293[/C][C]-0.3298[/C][C]0.371376[/C][/ROW]
[ROW][C]34[/C][C]-0.031613[/C][C]-0.2428[/C][C]0.404493[/C][/ROW]
[ROW][C]35[/C][C]-0.019219[/C][C]-0.1476[/C][C]0.44157[/C][/ROW]
[ROW][C]36[/C][C]0.045813[/C][C]0.3519[/C][C]0.363084[/C][/ROW]
[ROW][C]37[/C][C]0.011378[/C][C]0.0874[/C][C]0.465325[/C][/ROW]
[ROW][C]38[/C][C]-0.022746[/C][C]-0.1747[/C][C]0.43095[/C][/ROW]
[ROW][C]39[/C][C]-0.038746[/C][C]-0.2976[/C][C]0.383523[/C][/ROW]
[ROW][C]40[/C][C]-0.024997[/C][C]-0.192[/C][C]0.4242[/C][/ROW]
[ROW][C]41[/C][C]0.055494[/C][C]0.4263[/C][C]0.335737[/C][/ROW]
[ROW][C]42[/C][C]0.054201[/C][C]0.4163[/C][C]0.33934[/C][/ROW]
[ROW][C]43[/C][C]-0.095281[/C][C]-0.7319[/C][C]0.233575[/C][/ROW]
[ROW][C]44[/C][C]0.011991[/C][C]0.0921[/C][C]0.463462[/C][/ROW]
[ROW][C]45[/C][C]0.018544[/C][C]0.1424[/C][C]0.443609[/C][/ROW]
[ROW][C]46[/C][C]-0.003557[/C][C]-0.0273[/C][C]0.489148[/C][/ROW]
[ROW][C]47[/C][C]0.031791[/C][C]0.2442[/C][C]0.403966[/C][/ROW]
[ROW][C]48[/C][C]-0.059886[/C][C]-0.46[/C][C]0.323606[/C][/ROW]
[/TABLE]
Source: https://freestatistics.org/blog/index.php?pk=&T=1

Globally Unique Identifier (entire table): ba.freestatistics.org/blog/index.php?pk=&T=1

As an alternative you can also use a QR Code:  

The GUIDs for individual cells are displayed in the table below:

Autocorrelation Function
Time lag kACF(k)T-STATP-value
1-0.309191-2.37490.010411
2-0.093371-0.71720.238042
30.1775241.36360.088939
4-0.224405-1.72370.045001
50.0952050.73130.23375
6-0.008881-0.06820.472922
7-0.107614-0.82660.205898
80.0150290.11540.454243
9-0.039445-0.3030.381484
100.0544370.41810.338682
11-0.110467-0.84850.199792
120.1410261.08320.141555
130.0725230.55710.289797
14-0.181608-1.3950.084129
150.1738691.33550.093419
16-0.146486-1.12520.132535
170.1090310.83750.20285
180.0151810.11660.453785
19-0.074937-0.57560.283537
200.0395030.30340.381317
21-0.015277-0.11730.453493
220.0287790.22110.412907
23-0.055389-0.42550.336027
24-0.037792-0.29030.386307
250.111470.85620.19767
26-0.103953-0.79850.213898
27-0.089198-0.68510.247968
280.0969070.74440.229807
29-0.087024-0.66840.253228
300.0649960.49920.309731
31-0.029538-0.22690.410647
320.0619930.47620.317854
33-0.04293-0.32980.371376
34-0.031613-0.24280.404493
35-0.019219-0.14760.44157
360.0458130.35190.363084
370.0113780.08740.465325
38-0.022746-0.17470.43095
39-0.038746-0.29760.383523
40-0.024997-0.1920.4242
410.0554940.42630.335737
420.0542010.41630.33934
43-0.095281-0.73190.233575
440.0119910.09210.463462
450.0185440.14240.443609
46-0.003557-0.02730.489148
470.0317910.24420.403966
48-0.059886-0.460.323606


Partial Autocorrelation Function
Time lag kPACF(k)T-STATP-value
1-0.309191-2.37490.010411
2-0.208945-1.60490.056924
30.0902030.69290.245557
4-0.174691-1.34180.092396
50.005110.03930.484411
6-0.051292-0.3940.347507
7-0.081596-0.62670.26662
8-0.113045-0.86830.19437
9-0.089977-0.69110.246099
100.0090710.06970.472344
11-0.15415-1.18410.12057
120.0816070.62680.266593
130.0995590.76470.223741
14-0.087342-0.67090.252456
150.0483270.37120.355908
16-0.116573-0.89540.187103
170.1340091.02930.153761
18-0.043973-0.33780.368371
190.0594080.45630.324917
20-0.032386-0.24880.402205
210.042680.32780.372099
220.0360310.27680.391466
23-0.059912-0.46020.323535
24-0.031225-0.23980.40564
250.0220.1690.433192
26-0.002941-0.02260.491026
27-0.19098-1.46690.073851
28-0.001499-0.01150.495426
29-0.074551-0.57260.284533
30-0.040181-0.30860.379342
31-0.068974-0.52980.29912
320.0588450.4520.326464
33-0.046544-0.35750.360993
34-0.130659-1.00360.159833
35-0.11805-0.90680.184112
360.0354010.27190.393315
37-0.021005-0.16130.436187
38-0.061293-0.47080.319758
39-0.031028-0.23830.406226
40-0.076954-0.59110.278357
410.0045290.03480.486183
420.0540330.4150.339812
43-0.100242-0.770.222194
44-0.011544-0.08870.464821
45-0.067544-0.51880.302915
460.0735320.56480.287171
47-0.039686-0.30480.380782
48-0.01272-0.09770.461249

\begin{tabular}{lllllllll}
\hline
Partial Autocorrelation Function \tabularnewline
Time lag k & PACF(k) & T-STAT & P-value \tabularnewline
1 & -0.309191 & -2.3749 & 0.010411 \tabularnewline
2 & -0.208945 & -1.6049 & 0.056924 \tabularnewline
3 & 0.090203 & 0.6929 & 0.245557 \tabularnewline
4 & -0.174691 & -1.3418 & 0.092396 \tabularnewline
5 & 0.00511 & 0.0393 & 0.484411 \tabularnewline
6 & -0.051292 & -0.394 & 0.347507 \tabularnewline
7 & -0.081596 & -0.6267 & 0.26662 \tabularnewline
8 & -0.113045 & -0.8683 & 0.19437 \tabularnewline
9 & -0.089977 & -0.6911 & 0.246099 \tabularnewline
10 & 0.009071 & 0.0697 & 0.472344 \tabularnewline
11 & -0.15415 & -1.1841 & 0.12057 \tabularnewline
12 & 0.081607 & 0.6268 & 0.266593 \tabularnewline
13 & 0.099559 & 0.7647 & 0.223741 \tabularnewline
14 & -0.087342 & -0.6709 & 0.252456 \tabularnewline
15 & 0.048327 & 0.3712 & 0.355908 \tabularnewline
16 & -0.116573 & -0.8954 & 0.187103 \tabularnewline
17 & 0.134009 & 1.0293 & 0.153761 \tabularnewline
18 & -0.043973 & -0.3378 & 0.368371 \tabularnewline
19 & 0.059408 & 0.4563 & 0.324917 \tabularnewline
20 & -0.032386 & -0.2488 & 0.402205 \tabularnewline
21 & 0.04268 & 0.3278 & 0.372099 \tabularnewline
22 & 0.036031 & 0.2768 & 0.391466 \tabularnewline
23 & -0.059912 & -0.4602 & 0.323535 \tabularnewline
24 & -0.031225 & -0.2398 & 0.40564 \tabularnewline
25 & 0.022 & 0.169 & 0.433192 \tabularnewline
26 & -0.002941 & -0.0226 & 0.491026 \tabularnewline
27 & -0.19098 & -1.4669 & 0.073851 \tabularnewline
28 & -0.001499 & -0.0115 & 0.495426 \tabularnewline
29 & -0.074551 & -0.5726 & 0.284533 \tabularnewline
30 & -0.040181 & -0.3086 & 0.379342 \tabularnewline
31 & -0.068974 & -0.5298 & 0.29912 \tabularnewline
32 & 0.058845 & 0.452 & 0.326464 \tabularnewline
33 & -0.046544 & -0.3575 & 0.360993 \tabularnewline
34 & -0.130659 & -1.0036 & 0.159833 \tabularnewline
35 & -0.11805 & -0.9068 & 0.184112 \tabularnewline
36 & 0.035401 & 0.2719 & 0.393315 \tabularnewline
37 & -0.021005 & -0.1613 & 0.436187 \tabularnewline
38 & -0.061293 & -0.4708 & 0.319758 \tabularnewline
39 & -0.031028 & -0.2383 & 0.406226 \tabularnewline
40 & -0.076954 & -0.5911 & 0.278357 \tabularnewline
41 & 0.004529 & 0.0348 & 0.486183 \tabularnewline
42 & 0.054033 & 0.415 & 0.339812 \tabularnewline
43 & -0.100242 & -0.77 & 0.222194 \tabularnewline
44 & -0.011544 & -0.0887 & 0.464821 \tabularnewline
45 & -0.067544 & -0.5188 & 0.302915 \tabularnewline
46 & 0.073532 & 0.5648 & 0.287171 \tabularnewline
47 & -0.039686 & -0.3048 & 0.380782 \tabularnewline
48 & -0.01272 & -0.0977 & 0.461249 \tabularnewline
\hline
\end{tabular}
%Source: https://freestatistics.org/blog/index.php?pk=&T=2

[TABLE]
[ROW][C]Partial Autocorrelation Function[/C][/ROW]
[ROW][C]Time lag k[/C][C]PACF(k)[/C][C]T-STAT[/C][C]P-value[/C][/ROW]
[ROW][C]1[/C][C]-0.309191[/C][C]-2.3749[/C][C]0.010411[/C][/ROW]
[ROW][C]2[/C][C]-0.208945[/C][C]-1.6049[/C][C]0.056924[/C][/ROW]
[ROW][C]3[/C][C]0.090203[/C][C]0.6929[/C][C]0.245557[/C][/ROW]
[ROW][C]4[/C][C]-0.174691[/C][C]-1.3418[/C][C]0.092396[/C][/ROW]
[ROW][C]5[/C][C]0.00511[/C][C]0.0393[/C][C]0.484411[/C][/ROW]
[ROW][C]6[/C][C]-0.051292[/C][C]-0.394[/C][C]0.347507[/C][/ROW]
[ROW][C]7[/C][C]-0.081596[/C][C]-0.6267[/C][C]0.26662[/C][/ROW]
[ROW][C]8[/C][C]-0.113045[/C][C]-0.8683[/C][C]0.19437[/C][/ROW]
[ROW][C]9[/C][C]-0.089977[/C][C]-0.6911[/C][C]0.246099[/C][/ROW]
[ROW][C]10[/C][C]0.009071[/C][C]0.0697[/C][C]0.472344[/C][/ROW]
[ROW][C]11[/C][C]-0.15415[/C][C]-1.1841[/C][C]0.12057[/C][/ROW]
[ROW][C]12[/C][C]0.081607[/C][C]0.6268[/C][C]0.266593[/C][/ROW]
[ROW][C]13[/C][C]0.099559[/C][C]0.7647[/C][C]0.223741[/C][/ROW]
[ROW][C]14[/C][C]-0.087342[/C][C]-0.6709[/C][C]0.252456[/C][/ROW]
[ROW][C]15[/C][C]0.048327[/C][C]0.3712[/C][C]0.355908[/C][/ROW]
[ROW][C]16[/C][C]-0.116573[/C][C]-0.8954[/C][C]0.187103[/C][/ROW]
[ROW][C]17[/C][C]0.134009[/C][C]1.0293[/C][C]0.153761[/C][/ROW]
[ROW][C]18[/C][C]-0.043973[/C][C]-0.3378[/C][C]0.368371[/C][/ROW]
[ROW][C]19[/C][C]0.059408[/C][C]0.4563[/C][C]0.324917[/C][/ROW]
[ROW][C]20[/C][C]-0.032386[/C][C]-0.2488[/C][C]0.402205[/C][/ROW]
[ROW][C]21[/C][C]0.04268[/C][C]0.3278[/C][C]0.372099[/C][/ROW]
[ROW][C]22[/C][C]0.036031[/C][C]0.2768[/C][C]0.391466[/C][/ROW]
[ROW][C]23[/C][C]-0.059912[/C][C]-0.4602[/C][C]0.323535[/C][/ROW]
[ROW][C]24[/C][C]-0.031225[/C][C]-0.2398[/C][C]0.40564[/C][/ROW]
[ROW][C]25[/C][C]0.022[/C][C]0.169[/C][C]0.433192[/C][/ROW]
[ROW][C]26[/C][C]-0.002941[/C][C]-0.0226[/C][C]0.491026[/C][/ROW]
[ROW][C]27[/C][C]-0.19098[/C][C]-1.4669[/C][C]0.073851[/C][/ROW]
[ROW][C]28[/C][C]-0.001499[/C][C]-0.0115[/C][C]0.495426[/C][/ROW]
[ROW][C]29[/C][C]-0.074551[/C][C]-0.5726[/C][C]0.284533[/C][/ROW]
[ROW][C]30[/C][C]-0.040181[/C][C]-0.3086[/C][C]0.379342[/C][/ROW]
[ROW][C]31[/C][C]-0.068974[/C][C]-0.5298[/C][C]0.29912[/C][/ROW]
[ROW][C]32[/C][C]0.058845[/C][C]0.452[/C][C]0.326464[/C][/ROW]
[ROW][C]33[/C][C]-0.046544[/C][C]-0.3575[/C][C]0.360993[/C][/ROW]
[ROW][C]34[/C][C]-0.130659[/C][C]-1.0036[/C][C]0.159833[/C][/ROW]
[ROW][C]35[/C][C]-0.11805[/C][C]-0.9068[/C][C]0.184112[/C][/ROW]
[ROW][C]36[/C][C]0.035401[/C][C]0.2719[/C][C]0.393315[/C][/ROW]
[ROW][C]37[/C][C]-0.021005[/C][C]-0.1613[/C][C]0.436187[/C][/ROW]
[ROW][C]38[/C][C]-0.061293[/C][C]-0.4708[/C][C]0.319758[/C][/ROW]
[ROW][C]39[/C][C]-0.031028[/C][C]-0.2383[/C][C]0.406226[/C][/ROW]
[ROW][C]40[/C][C]-0.076954[/C][C]-0.5911[/C][C]0.278357[/C][/ROW]
[ROW][C]41[/C][C]0.004529[/C][C]0.0348[/C][C]0.486183[/C][/ROW]
[ROW][C]42[/C][C]0.054033[/C][C]0.415[/C][C]0.339812[/C][/ROW]
[ROW][C]43[/C][C]-0.100242[/C][C]-0.77[/C][C]0.222194[/C][/ROW]
[ROW][C]44[/C][C]-0.011544[/C][C]-0.0887[/C][C]0.464821[/C][/ROW]
[ROW][C]45[/C][C]-0.067544[/C][C]-0.5188[/C][C]0.302915[/C][/ROW]
[ROW][C]46[/C][C]0.073532[/C][C]0.5648[/C][C]0.287171[/C][/ROW]
[ROW][C]47[/C][C]-0.039686[/C][C]-0.3048[/C][C]0.380782[/C][/ROW]
[ROW][C]48[/C][C]-0.01272[/C][C]-0.0977[/C][C]0.461249[/C][/ROW]
[/TABLE]
Source: https://freestatistics.org/blog/index.php?pk=&T=2

Globally Unique Identifier (entire table): ba.freestatistics.org/blog/index.php?pk=&T=2

As an alternative you can also use a QR Code:  

The GUIDs for individual cells are displayed in the table below:

Partial Autocorrelation Function
Time lag kPACF(k)T-STATP-value
1-0.309191-2.37490.010411
2-0.208945-1.60490.056924
30.0902030.69290.245557
4-0.174691-1.34180.092396
50.005110.03930.484411
6-0.051292-0.3940.347507
7-0.081596-0.62670.26662
8-0.113045-0.86830.19437
9-0.089977-0.69110.246099
100.0090710.06970.472344
11-0.15415-1.18410.12057
120.0816070.62680.266593
130.0995590.76470.223741
14-0.087342-0.67090.252456
150.0483270.37120.355908
16-0.116573-0.89540.187103
170.1340091.02930.153761
18-0.043973-0.33780.368371
190.0594080.45630.324917
20-0.032386-0.24880.402205
210.042680.32780.372099
220.0360310.27680.391466
23-0.059912-0.46020.323535
24-0.031225-0.23980.40564
250.0220.1690.433192
26-0.002941-0.02260.491026
27-0.19098-1.46690.073851
28-0.001499-0.01150.495426
29-0.074551-0.57260.284533
30-0.040181-0.30860.379342
31-0.068974-0.52980.29912
320.0588450.4520.326464
33-0.046544-0.35750.360993
34-0.130659-1.00360.159833
35-0.11805-0.90680.184112
360.0354010.27190.393315
37-0.021005-0.16130.436187
38-0.061293-0.47080.319758
39-0.031028-0.23830.406226
40-0.076954-0.59110.278357
410.0045290.03480.486183
420.0540330.4150.339812
43-0.100242-0.770.222194
44-0.011544-0.08870.464821
45-0.067544-0.51880.302915
460.0735320.56480.287171
47-0.039686-0.30480.380782
48-0.01272-0.09770.461249


Parameters (Session):
par1 = 48 ; par2 = 1 ; par3 = 1 ; par4 = 0 ; par5 = 12 ; par6 = White Noise ; par7 = 0.95 ;
Parameters (R input):
par1 = 48 ; par2 = 1 ; par3 = 1 ; par4 = 0 ; par5 = 12 ; par6 = White Noise ; par7 = 0.95 ; par8 = ;
R code (references can be found in the software module):
if (par1 == 'Default') {
par1 = 10*log10(length(x))
} else {
par1 <- as.numeric(par1)
}
par2 <- as.numeric(par2)
par3 <- as.numeric(par3)
par4 <- as.numeric(par4)
par5 <- as.numeric(par5)
if (par6 == 'White Noise') par6 <- 'white' else par6 <- 'ma'
par7 <- as.numeric(par7)
if (par8 != '') par8 <- as.numeric(par8)
x <- na.omit(x)
ox <- x
if (par8 == '') {
if (par2 == 0) {
x <- log(x)
} else {
x <- (x ^ par2 - 1) / par2
}
} else {
x <- log(x,base=par8)
}
if (par3 > 0) x <- diff(x,lag=1,difference=par3)
if (par4 > 0) x <- diff(x,lag=par5,difference=par4)
bitmap(file='picts.png')
op <- par(mfrow=c(2,1))
plot(ox,type='l',main='Original Time Series',xlab='time',ylab='value')
if (par8=='') {
mytitle <- paste('Working Time Series (lambda=',par2,', d=',par3,', D=',par4,')',sep='')
mysub <- paste('(lambda=',par2,', d=',par3,', D=',par4,', CI=', par7, ', CI type=',par6,')',sep='')
} else {
mytitle <- paste('Working Time Series (base=',par8,', d=',par3,', D=',par4,')',sep='')
mysub <- paste('(base=',par8,', d=',par3,', D=',par4,', CI=', par7, ', CI type=',par6,')',sep='')
}
plot(x,type='l', main=mytitle,xlab='time',ylab='value')
par(op)
dev.off()
bitmap(file='pic1.png')
racf <- acf(x, par1, main='Autocorrelation', xlab='time lag', ylab='ACF', ci.type=par6, ci=par7, sub=mysub)
dev.off()
bitmap(file='pic2.png')
rpacf <- pacf(x,par1,main='Partial Autocorrelation',xlab='lags',ylab='PACF',sub=mysub)
dev.off()
(myacf <- c(racf$acf))
(mypacf <- c(rpacf$acf))
lengthx <- length(x)
sqrtn <- sqrt(lengthx)
load(file='createtable')
a<-table.start()
a<-table.row.start(a)
a<-table.element(a,'Autocorrelation Function',4,TRUE)
a<-table.row.end(a)
a<-table.row.start(a)
a<-table.element(a,'Time lag k',header=TRUE)
a<-table.element(a,hyperlink('basics.htm','ACF(k)','click here for more information about the Autocorrelation Function'),header=TRUE)
a<-table.element(a,'T-STAT',header=TRUE)
a<-table.element(a,'P-value',header=TRUE)
a<-table.row.end(a)
for (i in 2:(par1+1)) {
a<-table.row.start(a)
a<-table.element(a,i-1,header=TRUE)
a<-table.element(a,round(myacf[i],6))
mytstat <- myacf[i]*sqrtn
a<-table.element(a,round(mytstat,4))
a<-table.element(a,round(1-pt(abs(mytstat),lengthx),6))
a<-table.row.end(a)
}
a<-table.end(a)
table.save(a,file='mytable.tab')
a<-table.start()
a<-table.row.start(a)
a<-table.element(a,'Partial Autocorrelation Function',4,TRUE)
a<-table.row.end(a)
a<-table.row.start(a)
a<-table.element(a,'Time lag k',header=TRUE)
a<-table.element(a,hyperlink('basics.htm','PACF(k)','click here for more information about the Partial Autocorrelation Function'),header=TRUE)
a<-table.element(a,'T-STAT',header=TRUE)
a<-table.element(a,'P-value',header=TRUE)
a<-table.row.end(a)
for (i in 1:par1) {
a<-table.row.start(a)
a<-table.element(a,i,header=TRUE)
a<-table.element(a,round(mypacf[i],6))
mytstat <- mypacf[i]*sqrtn
a<-table.element(a,round(mytstat,4))
a<-table.element(a,round(1-pt(abs(mytstat),lengthx),6))
a<-table.row.end(a)
}
a<-table.end(a)
table.save(a,file='mytable1.tab')